Free Statistics

of Irreproducible Research!

Author's title

Author*The author of this computation has been verified*
R Software Modulerwasp_multipleregression.wasp
Title produced by softwareMultiple Regression
Date of computationSun, 13 Dec 2015 21:56:46 +0000
Cite this page as followsStatistical Computations at FreeStatistics.org, Office for Research Development and Education, URL https://freestatistics.org/blog/index.php?v=date/2015/Dec/13/t1450044062nkqurcae4h4adym.htm/, Retrieved Thu, 16 May 2024 20:23:38 +0000
Statistical Computations at FreeStatistics.org, Office for Research Development and Education, URL https://freestatistics.org/blog/index.php?pk=286244, Retrieved Thu, 16 May 2024 20:23:38 +0000
QR Codes:

Original text written by user:
IsPrivate?No (this computation is public)
User-defined keywords
Estimated Impact75
Family? (F = Feedback message, R = changed R code, M = changed R Module, P = changed Parameters, D = changed Data)
-       [Multiple Regression] [paper15] [2015-12-13 21:56:46] [1e67203134127d491eaf7d256835640d] [Current]
Feedback Forum

Post a new message
Dataseries X:
242961	292068
273849	315646
273528	321514
245372	312051
217615	299146
208888	291957
187797	271628
167503	251801
161264	241526
177969	251527
199128	273778
237538	312201
257043	331634
259605	337268
255538	332714
249583	320463
237399	303648
224687	282945
208658	265768
210871	258868
228047	263434
253089	285052
271250	305363
279551	316846
278778	309483
253214	279245
242542	262323
281133	273396
290200	276992
277630	268843
289492	270875
306752	277550
315256	282518


Summary of computational transaction
Raw Inputview raw input (R code)
Raw Outputview raw output of R engine
Computing time4 seconds
R Server'Gertrude Mary Cox' @ cox.wessa.net

\begin{tabular}{lllllllll}
\hline
Summary of computational transaction \tabularnewline
Raw Input & view raw input (R code)  \tabularnewline
Raw Output & view raw output of R engine  \tabularnewline
Computing time & 4 seconds \tabularnewline
R Server & 'Gertrude Mary Cox' @ cox.wessa.net \tabularnewline
\hline
\end{tabular}
%Source: https://freestatistics.org/blog/index.php?pk=286244&T=0

[TABLE]
[ROW][C]Summary of computational transaction[/C][/ROW]
[ROW][C]Raw Input[/C][C]view raw input (R code) [/C][/ROW]
[ROW][C]Raw Output[/C][C]view raw output of R engine [/C][/ROW]
[ROW][C]Computing time[/C][C]4 seconds[/C][/ROW]
[ROW][C]R Server[/C][C]'Gertrude Mary Cox' @ cox.wessa.net[/C][/ROW]
[/TABLE]
Source: https://freestatistics.org/blog/index.php?pk=286244&T=0

Globally Unique Identifier (entire table): ba.freestatistics.org/blog/index.php?pk=286244&T=0

As an alternative you can also use a QR Code:  

The GUIDs for individual cells are displayed in the table below:

Summary of computational transaction
Raw Inputview raw input (R code)
Raw Outputview raw output of R engine
Computing time4 seconds
R Server'Gertrude Mary Cox' @ cox.wessa.net


Multiple Linear Regression - Estimated Regression Equation
mannen[t] = -80351.3 + 0.948383vrouwen[t] + 2972.7t + e[t]

\begin{tabular}{lllllllll}
\hline
Multiple Linear Regression - Estimated Regression Equation \tabularnewline
mannen[t] =  -80351.3 +  0.948383vrouwen[t] +  2972.7t  + e[t] \tabularnewline
 \tabularnewline
\hline
\end{tabular}
%Source: https://freestatistics.org/blog/index.php?pk=286244&T=1

[TABLE]
[ROW][C]Multiple Linear Regression - Estimated Regression Equation[/C][/ROW]
[ROW][C]mannen[t] =  -80351.3 +  0.948383vrouwen[t] +  2972.7t  + e[t][/C][/ROW]
[ROW][C][/C][/ROW]
[/TABLE]
Source: https://freestatistics.org/blog/index.php?pk=286244&T=1

Globally Unique Identifier (entire table): ba.freestatistics.org/blog/index.php?pk=286244&T=1

As an alternative you can also use a QR Code:  

The GUIDs for individual cells are displayed in the table below:

Multiple Linear Regression - Estimated Regression Equation
mannen[t] = -80351.3 + 0.948383vrouwen[t] + 2972.7t + e[t]


Multiple Linear Regression - Ordinary Least Squares
VariableParameterS.D.T-STATH0: parameter = 02-tail p-value1-tail p-value
(Intercept)-8.035e+04 4.585e+04-1.7520e+00 0.08991 0.04495
vrouwen+0.9484 0.1507+6.2950e+00 6.127e-07 3.064e-07
t+2973 404+7.3590e+00 3.383e-08 1.692e-08

\begin{tabular}{lllllllll}
\hline
Multiple Linear Regression - Ordinary Least Squares \tabularnewline
Variable & Parameter & S.D. & T-STATH0: parameter = 0 & 2-tail p-value & 1-tail p-value \tabularnewline
(Intercept) & -8.035e+04 &  4.585e+04 & -1.7520e+00 &  0.08991 &  0.04495 \tabularnewline
vrouwen & +0.9484 &  0.1507 & +6.2950e+00 &  6.127e-07 &  3.064e-07 \tabularnewline
t & +2973 &  404 & +7.3590e+00 &  3.383e-08 &  1.692e-08 \tabularnewline
\hline
\end{tabular}
%Source: https://freestatistics.org/blog/index.php?pk=286244&T=2

[TABLE]
[ROW][C]Multiple Linear Regression - Ordinary Least Squares[/C][/ROW]
[ROW][C]Variable[/C][C]Parameter[/C][C]S.D.[/C][C]T-STATH0: parameter = 0[/C][C]2-tail p-value[/C][C]1-tail p-value[/C][/ROW]
[ROW][C](Intercept)[/C][C]-8.035e+04[/C][C] 4.585e+04[/C][C]-1.7520e+00[/C][C] 0.08991[/C][C] 0.04495[/C][/ROW]
[ROW][C]vrouwen[/C][C]+0.9484[/C][C] 0.1507[/C][C]+6.2950e+00[/C][C] 6.127e-07[/C][C] 3.064e-07[/C][/ROW]
[ROW][C]t[/C][C]+2973[/C][C] 404[/C][C]+7.3590e+00[/C][C] 3.383e-08[/C][C] 1.692e-08[/C][/ROW]
[/TABLE]
Source: https://freestatistics.org/blog/index.php?pk=286244&T=2

Globally Unique Identifier (entire table): ba.freestatistics.org/blog/index.php?pk=286244&T=2

As an alternative you can also use a QR Code:  

The GUIDs for individual cells are displayed in the table below:

Multiple Linear Regression - Ordinary Least Squares
VariableParameterS.D.T-STATH0: parameter = 02-tail p-value1-tail p-value
(Intercept)-8.035e+04 4.585e+04-1.7520e+00 0.08991 0.04495
vrouwen+0.9484 0.1507+6.2950e+00 6.127e-07 3.064e-07
t+2973 404+7.3590e+00 3.383e-08 1.692e-08


Multiple Linear Regression - Regression Statistics
Multiple R 0.8465
R-squared 0.7166
Adjusted R-squared 0.6977
F-TEST (value) 37.92
F-TEST (DF numerator)2
F-TEST (DF denominator)30
p-value 6.124e-09
Multiple Linear Regression - Residual Statistics
Residual Standard Deviation 2.144e+04
Sum Squared Residuals 1.38e+10

\begin{tabular}{lllllllll}
\hline
Multiple Linear Regression - Regression Statistics \tabularnewline
Multiple R &  0.8465 \tabularnewline
R-squared &  0.7166 \tabularnewline
Adjusted R-squared &  0.6977 \tabularnewline
F-TEST (value) &  37.92 \tabularnewline
F-TEST (DF numerator) & 2 \tabularnewline
F-TEST (DF denominator) & 30 \tabularnewline
p-value &  6.124e-09 \tabularnewline
Multiple Linear Regression - Residual Statistics \tabularnewline
Residual Standard Deviation &  2.144e+04 \tabularnewline
Sum Squared Residuals &  1.38e+10 \tabularnewline
\hline
\end{tabular}
%Source: https://freestatistics.org/blog/index.php?pk=286244&T=3

[TABLE]
[ROW][C]Multiple Linear Regression - Regression Statistics[/C][/ROW]
[ROW][C]Multiple R[/C][C] 0.8465[/C][/ROW]
[ROW][C]R-squared[/C][C] 0.7166[/C][/ROW]
[ROW][C]Adjusted R-squared[/C][C] 0.6977[/C][/ROW]
[ROW][C]F-TEST (value)[/C][C] 37.92[/C][/ROW]
[ROW][C]F-TEST (DF numerator)[/C][C]2[/C][/ROW]
[ROW][C]F-TEST (DF denominator)[/C][C]30[/C][/ROW]
[ROW][C]p-value[/C][C] 6.124e-09[/C][/ROW]
[ROW][C]Multiple Linear Regression - Residual Statistics[/C][/ROW]
[ROW][C]Residual Standard Deviation[/C][C] 2.144e+04[/C][/ROW]
[ROW][C]Sum Squared Residuals[/C][C] 1.38e+10[/C][/ROW]
[/TABLE]
Source: https://freestatistics.org/blog/index.php?pk=286244&T=3

Globally Unique Identifier (entire table): ba.freestatistics.org/blog/index.php?pk=286244&T=3

As an alternative you can also use a QR Code:  

The GUIDs for individual cells are displayed in the table below:

Multiple Linear Regression - Regression Statistics
Multiple R 0.8465
R-squared 0.7166
Adjusted R-squared 0.6977
F-TEST (value) 37.92
F-TEST (DF numerator)2
F-TEST (DF denominator)30
p-value 6.124e-09
Multiple Linear Regression - Residual Statistics
Residual Standard Deviation 2.144e+04
Sum Squared Residuals 1.38e+10


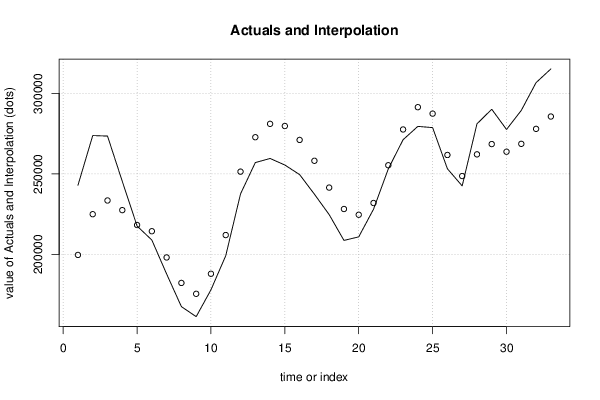
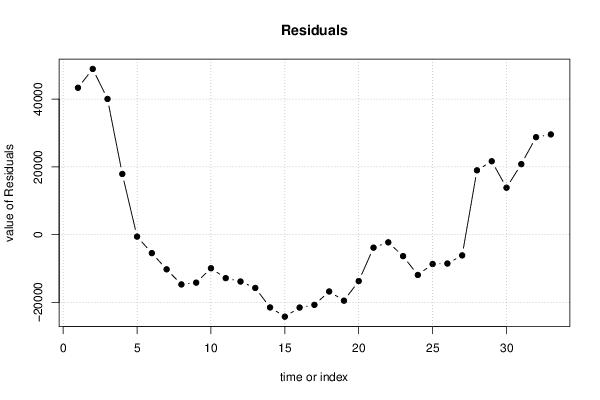
Multiple Linear Regression - Actuals, Interpolation, and Residuals
Time or IndexActualsInterpolationForecastResidualsPrediction Error
1 2.43e+05 1.996e+05 4.335e+04
2 2.738e+05 2.249e+05 4.89e+04
3 2.735e+05 2.335e+05 4.004e+04
4 2.454e+05 2.275e+05 1.789e+04
5 2.176e+05 2.182e+05-602.1
6 2.089e+05 2.144e+05-5484
7 1.878e+05 1.981e+05-1.027e+04
8 1.675e+05 1.822e+05-1.473e+04
9 1.613e+05 1.755e+05-1.42e+04
10 1.78e+05 1.879e+05-9951
11 1.991e+05 2.12e+05-1.287e+04
12 2.375e+05 2.514e+05-1.387e+04
13 2.57e+05 2.728e+05-1.577e+04
14 2.596e+05 2.811e+05-2.152e+04
15 2.555e+05 2.798e+05-2.424e+04
16 2.496e+05 2.711e+05-2.155e+04
17 2.374e+05 2.582e+05-2.076e+04
18 2.247e+05 2.415e+05-1.681e+04
19 2.087e+05 2.282e+05-1.952e+04
20 2.109e+05 2.246e+05-1.374e+04
21 2.28e+05 2.319e+05-3865
22 2.531e+05 2.554e+05-2297
23 2.712e+05 2.776e+05-6372
24 2.796e+05 2.915e+05-1.193e+04
25 2.788e+05 2.875e+05-8696
26 2.532e+05 2.618e+05-8556
27 2.425e+05 2.487e+05-6152
28 2.811e+05 2.622e+05 1.896e+04
29 2.902e+05 2.686e+05 2.165e+04
30 2.776e+05 2.638e+05 1.383e+04
31 2.895e+05 2.687e+05 2.08e+04
32 3.068e+05 2.78e+05 2.875e+04
33 3.153e+05 2.857e+05 2.957e+04

\begin{tabular}{lllllllll}
\hline
Multiple Linear Regression - Actuals, Interpolation, and Residuals \tabularnewline
Time or Index & Actuals & InterpolationForecast & ResidualsPrediction Error \tabularnewline
1 &  2.43e+05 &  1.996e+05 &  4.335e+04 \tabularnewline
2 &  2.738e+05 &  2.249e+05 &  4.89e+04 \tabularnewline
3 &  2.735e+05 &  2.335e+05 &  4.004e+04 \tabularnewline
4 &  2.454e+05 &  2.275e+05 &  1.789e+04 \tabularnewline
5 &  2.176e+05 &  2.182e+05 & -602.1 \tabularnewline
6 &  2.089e+05 &  2.144e+05 & -5484 \tabularnewline
7 &  1.878e+05 &  1.981e+05 & -1.027e+04 \tabularnewline
8 &  1.675e+05 &  1.822e+05 & -1.473e+04 \tabularnewline
9 &  1.613e+05 &  1.755e+05 & -1.42e+04 \tabularnewline
10 &  1.78e+05 &  1.879e+05 & -9951 \tabularnewline
11 &  1.991e+05 &  2.12e+05 & -1.287e+04 \tabularnewline
12 &  2.375e+05 &  2.514e+05 & -1.387e+04 \tabularnewline
13 &  2.57e+05 &  2.728e+05 & -1.577e+04 \tabularnewline
14 &  2.596e+05 &  2.811e+05 & -2.152e+04 \tabularnewline
15 &  2.555e+05 &  2.798e+05 & -2.424e+04 \tabularnewline
16 &  2.496e+05 &  2.711e+05 & -2.155e+04 \tabularnewline
17 &  2.374e+05 &  2.582e+05 & -2.076e+04 \tabularnewline
18 &  2.247e+05 &  2.415e+05 & -1.681e+04 \tabularnewline
19 &  2.087e+05 &  2.282e+05 & -1.952e+04 \tabularnewline
20 &  2.109e+05 &  2.246e+05 & -1.374e+04 \tabularnewline
21 &  2.28e+05 &  2.319e+05 & -3865 \tabularnewline
22 &  2.531e+05 &  2.554e+05 & -2297 \tabularnewline
23 &  2.712e+05 &  2.776e+05 & -6372 \tabularnewline
24 &  2.796e+05 &  2.915e+05 & -1.193e+04 \tabularnewline
25 &  2.788e+05 &  2.875e+05 & -8696 \tabularnewline
26 &  2.532e+05 &  2.618e+05 & -8556 \tabularnewline
27 &  2.425e+05 &  2.487e+05 & -6152 \tabularnewline
28 &  2.811e+05 &  2.622e+05 &  1.896e+04 \tabularnewline
29 &  2.902e+05 &  2.686e+05 &  2.165e+04 \tabularnewline
30 &  2.776e+05 &  2.638e+05 &  1.383e+04 \tabularnewline
31 &  2.895e+05 &  2.687e+05 &  2.08e+04 \tabularnewline
32 &  3.068e+05 &  2.78e+05 &  2.875e+04 \tabularnewline
33 &  3.153e+05 &  2.857e+05 &  2.957e+04 \tabularnewline
\hline
\end{tabular}
%Source: https://freestatistics.org/blog/index.php?pk=286244&T=4

[TABLE]
[ROW][C]Multiple Linear Regression - Actuals, Interpolation, and Residuals[/C][/ROW]
[ROW][C]Time or Index[/C][C]Actuals[/C][C]InterpolationForecast[/C][C]ResidualsPrediction Error[/C][/ROW]
[ROW][C]1[/C][C] 2.43e+05[/C][C] 1.996e+05[/C][C] 4.335e+04[/C][/ROW]
[ROW][C]2[/C][C] 2.738e+05[/C][C] 2.249e+05[/C][C] 4.89e+04[/C][/ROW]
[ROW][C]3[/C][C] 2.735e+05[/C][C] 2.335e+05[/C][C] 4.004e+04[/C][/ROW]
[ROW][C]4[/C][C] 2.454e+05[/C][C] 2.275e+05[/C][C] 1.789e+04[/C][/ROW]
[ROW][C]5[/C][C] 2.176e+05[/C][C] 2.182e+05[/C][C]-602.1[/C][/ROW]
[ROW][C]6[/C][C] 2.089e+05[/C][C] 2.144e+05[/C][C]-5484[/C][/ROW]
[ROW][C]7[/C][C] 1.878e+05[/C][C] 1.981e+05[/C][C]-1.027e+04[/C][/ROW]
[ROW][C]8[/C][C] 1.675e+05[/C][C] 1.822e+05[/C][C]-1.473e+04[/C][/ROW]
[ROW][C]9[/C][C] 1.613e+05[/C][C] 1.755e+05[/C][C]-1.42e+04[/C][/ROW]
[ROW][C]10[/C][C] 1.78e+05[/C][C] 1.879e+05[/C][C]-9951[/C][/ROW]
[ROW][C]11[/C][C] 1.991e+05[/C][C] 2.12e+05[/C][C]-1.287e+04[/C][/ROW]
[ROW][C]12[/C][C] 2.375e+05[/C][C] 2.514e+05[/C][C]-1.387e+04[/C][/ROW]
[ROW][C]13[/C][C] 2.57e+05[/C][C] 2.728e+05[/C][C]-1.577e+04[/C][/ROW]
[ROW][C]14[/C][C] 2.596e+05[/C][C] 2.811e+05[/C][C]-2.152e+04[/C][/ROW]
[ROW][C]15[/C][C] 2.555e+05[/C][C] 2.798e+05[/C][C]-2.424e+04[/C][/ROW]
[ROW][C]16[/C][C] 2.496e+05[/C][C] 2.711e+05[/C][C]-2.155e+04[/C][/ROW]
[ROW][C]17[/C][C] 2.374e+05[/C][C] 2.582e+05[/C][C]-2.076e+04[/C][/ROW]
[ROW][C]18[/C][C] 2.247e+05[/C][C] 2.415e+05[/C][C]-1.681e+04[/C][/ROW]
[ROW][C]19[/C][C] 2.087e+05[/C][C] 2.282e+05[/C][C]-1.952e+04[/C][/ROW]
[ROW][C]20[/C][C] 2.109e+05[/C][C] 2.246e+05[/C][C]-1.374e+04[/C][/ROW]
[ROW][C]21[/C][C] 2.28e+05[/C][C] 2.319e+05[/C][C]-3865[/C][/ROW]
[ROW][C]22[/C][C] 2.531e+05[/C][C] 2.554e+05[/C][C]-2297[/C][/ROW]
[ROW][C]23[/C][C] 2.712e+05[/C][C] 2.776e+05[/C][C]-6372[/C][/ROW]
[ROW][C]24[/C][C] 2.796e+05[/C][C] 2.915e+05[/C][C]-1.193e+04[/C][/ROW]
[ROW][C]25[/C][C] 2.788e+05[/C][C] 2.875e+05[/C][C]-8696[/C][/ROW]
[ROW][C]26[/C][C] 2.532e+05[/C][C] 2.618e+05[/C][C]-8556[/C][/ROW]
[ROW][C]27[/C][C] 2.425e+05[/C][C] 2.487e+05[/C][C]-6152[/C][/ROW]
[ROW][C]28[/C][C] 2.811e+05[/C][C] 2.622e+05[/C][C] 1.896e+04[/C][/ROW]
[ROW][C]29[/C][C] 2.902e+05[/C][C] 2.686e+05[/C][C] 2.165e+04[/C][/ROW]
[ROW][C]30[/C][C] 2.776e+05[/C][C] 2.638e+05[/C][C] 1.383e+04[/C][/ROW]
[ROW][C]31[/C][C] 2.895e+05[/C][C] 2.687e+05[/C][C] 2.08e+04[/C][/ROW]
[ROW][C]32[/C][C] 3.068e+05[/C][C] 2.78e+05[/C][C] 2.875e+04[/C][/ROW]
[ROW][C]33[/C][C] 3.153e+05[/C][C] 2.857e+05[/C][C] 2.957e+04[/C][/ROW]
[/TABLE]
Source: https://freestatistics.org/blog/index.php?pk=286244&T=4

Globally Unique Identifier (entire table): ba.freestatistics.org/blog/index.php?pk=286244&T=4

As an alternative you can also use a QR Code:  

The GUIDs for individual cells are displayed in the table below:

Multiple Linear Regression - Actuals, Interpolation, and Residuals
Time or IndexActualsInterpolationForecastResidualsPrediction Error
1 2.43e+05 1.996e+05 4.335e+04
2 2.738e+05 2.249e+05 4.89e+04
3 2.735e+05 2.335e+05 4.004e+04
4 2.454e+05 2.275e+05 1.789e+04
5 2.176e+05 2.182e+05-602.1
6 2.089e+05 2.144e+05-5484
7 1.878e+05 1.981e+05-1.027e+04
8 1.675e+05 1.822e+05-1.473e+04
9 1.613e+05 1.755e+05-1.42e+04
10 1.78e+05 1.879e+05-9951
11 1.991e+05 2.12e+05-1.287e+04
12 2.375e+05 2.514e+05-1.387e+04
13 2.57e+05 2.728e+05-1.577e+04
14 2.596e+05 2.811e+05-2.152e+04
15 2.555e+05 2.798e+05-2.424e+04
16 2.496e+05 2.711e+05-2.155e+04
17 2.374e+05 2.582e+05-2.076e+04
18 2.247e+05 2.415e+05-1.681e+04
19 2.087e+05 2.282e+05-1.952e+04
20 2.109e+05 2.246e+05-1.374e+04
21 2.28e+05 2.319e+05-3865
22 2.531e+05 2.554e+05-2297
23 2.712e+05 2.776e+05-6372
24 2.796e+05 2.915e+05-1.193e+04
25 2.788e+05 2.875e+05-8696
26 2.532e+05 2.618e+05-8556
27 2.425e+05 2.487e+05-6152
28 2.811e+05 2.622e+05 1.896e+04
29 2.902e+05 2.686e+05 2.165e+04
30 2.776e+05 2.638e+05 1.383e+04
31 2.895e+05 2.687e+05 2.08e+04
32 3.068e+05 2.78e+05 2.875e+04
33 3.153e+05 2.857e+05 2.957e+04


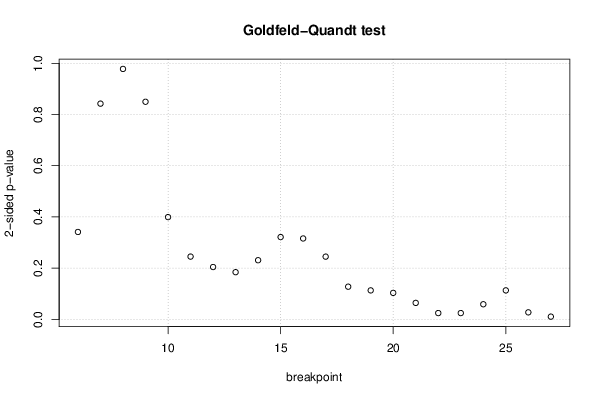
Goldfeld-Quandt test for Heteroskedasticity
p-valuesAlternative Hypothesis
breakpoint indexgreater2-sidedless
6 0.1706 0.3413 0.8294
7 0.4212 0.8425 0.5788
8 0.489 0.978 0.511
9 0.5751 0.8498 0.4249
10 0.8003 0.3995 0.1997
11 0.8774 0.2452 0.1226
12 0.8978 0.2044 0.1022
13 0.9079 0.1843 0.09214
14 0.8845 0.231 0.1155
15 0.8393 0.3213 0.1607
16 0.842 0.316 0.158
17 0.8775 0.245 0.1225
18 0.9362 0.1276 0.0638
19 0.9434 0.1132 0.05659
20 0.9483 0.1034 0.05172
21 0.9678 0.06436 0.03218
22 0.9877 0.02465 0.01232
23 0.9877 0.02459 0.01229
24 0.9705 0.05904 0.02952
25 0.9434 0.1133 0.05663
26 0.9863 0.02746 0.01373
27 0.9947 0.01061 0.005307

\begin{tabular}{lllllllll}
\hline
Goldfeld-Quandt test for Heteroskedasticity \tabularnewline
p-values & Alternative Hypothesis \tabularnewline
breakpoint index & greater & 2-sided & less \tabularnewline
6 &  0.1706 &  0.3413 &  0.8294 \tabularnewline
7 &  0.4212 &  0.8425 &  0.5788 \tabularnewline
8 &  0.489 &  0.978 &  0.511 \tabularnewline
9 &  0.5751 &  0.8498 &  0.4249 \tabularnewline
10 &  0.8003 &  0.3995 &  0.1997 \tabularnewline
11 &  0.8774 &  0.2452 &  0.1226 \tabularnewline
12 &  0.8978 &  0.2044 &  0.1022 \tabularnewline
13 &  0.9079 &  0.1843 &  0.09214 \tabularnewline
14 &  0.8845 &  0.231 &  0.1155 \tabularnewline
15 &  0.8393 &  0.3213 &  0.1607 \tabularnewline
16 &  0.842 &  0.316 &  0.158 \tabularnewline
17 &  0.8775 &  0.245 &  0.1225 \tabularnewline
18 &  0.9362 &  0.1276 &  0.0638 \tabularnewline
19 &  0.9434 &  0.1132 &  0.05659 \tabularnewline
20 &  0.9483 &  0.1034 &  0.05172 \tabularnewline
21 &  0.9678 &  0.06436 &  0.03218 \tabularnewline
22 &  0.9877 &  0.02465 &  0.01232 \tabularnewline
23 &  0.9877 &  0.02459 &  0.01229 \tabularnewline
24 &  0.9705 &  0.05904 &  0.02952 \tabularnewline
25 &  0.9434 &  0.1133 &  0.05663 \tabularnewline
26 &  0.9863 &  0.02746 &  0.01373 \tabularnewline
27 &  0.9947 &  0.01061 &  0.005307 \tabularnewline
\hline
\end{tabular}
%Source: https://freestatistics.org/blog/index.php?pk=286244&T=5

[TABLE]
[ROW][C]Goldfeld-Quandt test for Heteroskedasticity[/C][/ROW]
[ROW][C]p-values[/C][C]Alternative Hypothesis[/C][/ROW]
[ROW][C]breakpoint index[/C][C]greater[/C][C]2-sided[/C][C]less[/C][/ROW]
[ROW][C]6[/C][C] 0.1706[/C][C] 0.3413[/C][C] 0.8294[/C][/ROW]
[ROW][C]7[/C][C] 0.4212[/C][C] 0.8425[/C][C] 0.5788[/C][/ROW]
[ROW][C]8[/C][C] 0.489[/C][C] 0.978[/C][C] 0.511[/C][/ROW]
[ROW][C]9[/C][C] 0.5751[/C][C] 0.8498[/C][C] 0.4249[/C][/ROW]
[ROW][C]10[/C][C] 0.8003[/C][C] 0.3995[/C][C] 0.1997[/C][/ROW]
[ROW][C]11[/C][C] 0.8774[/C][C] 0.2452[/C][C] 0.1226[/C][/ROW]
[ROW][C]12[/C][C] 0.8978[/C][C] 0.2044[/C][C] 0.1022[/C][/ROW]
[ROW][C]13[/C][C] 0.9079[/C][C] 0.1843[/C][C] 0.09214[/C][/ROW]
[ROW][C]14[/C][C] 0.8845[/C][C] 0.231[/C][C] 0.1155[/C][/ROW]
[ROW][C]15[/C][C] 0.8393[/C][C] 0.3213[/C][C] 0.1607[/C][/ROW]
[ROW][C]16[/C][C] 0.842[/C][C] 0.316[/C][C] 0.158[/C][/ROW]
[ROW][C]17[/C][C] 0.8775[/C][C] 0.245[/C][C] 0.1225[/C][/ROW]
[ROW][C]18[/C][C] 0.9362[/C][C] 0.1276[/C][C] 0.0638[/C][/ROW]
[ROW][C]19[/C][C] 0.9434[/C][C] 0.1132[/C][C] 0.05659[/C][/ROW]
[ROW][C]20[/C][C] 0.9483[/C][C] 0.1034[/C][C] 0.05172[/C][/ROW]
[ROW][C]21[/C][C] 0.9678[/C][C] 0.06436[/C][C] 0.03218[/C][/ROW]
[ROW][C]22[/C][C] 0.9877[/C][C] 0.02465[/C][C] 0.01232[/C][/ROW]
[ROW][C]23[/C][C] 0.9877[/C][C] 0.02459[/C][C] 0.01229[/C][/ROW]
[ROW][C]24[/C][C] 0.9705[/C][C] 0.05904[/C][C] 0.02952[/C][/ROW]
[ROW][C]25[/C][C] 0.9434[/C][C] 0.1133[/C][C] 0.05663[/C][/ROW]
[ROW][C]26[/C][C] 0.9863[/C][C] 0.02746[/C][C] 0.01373[/C][/ROW]
[ROW][C]27[/C][C] 0.9947[/C][C] 0.01061[/C][C] 0.005307[/C][/ROW]
[/TABLE]
Source: https://freestatistics.org/blog/index.php?pk=286244&T=5

Globally Unique Identifier (entire table): ba.freestatistics.org/blog/index.php?pk=286244&T=5

As an alternative you can also use a QR Code:  

The GUIDs for individual cells are displayed in the table below:

Goldfeld-Quandt test for Heteroskedasticity
p-valuesAlternative Hypothesis
breakpoint indexgreater2-sidedless
6 0.1706 0.3413 0.8294
7 0.4212 0.8425 0.5788
8 0.489 0.978 0.511
9 0.5751 0.8498 0.4249
10 0.8003 0.3995 0.1997
11 0.8774 0.2452 0.1226
12 0.8978 0.2044 0.1022
13 0.9079 0.1843 0.09214
14 0.8845 0.231 0.1155
15 0.8393 0.3213 0.1607
16 0.842 0.316 0.158
17 0.8775 0.245 0.1225
18 0.9362 0.1276 0.0638
19 0.9434 0.1132 0.05659
20 0.9483 0.1034 0.05172
21 0.9678 0.06436 0.03218
22 0.9877 0.02465 0.01232
23 0.9877 0.02459 0.01229
24 0.9705 0.05904 0.02952
25 0.9434 0.1133 0.05663
26 0.9863 0.02746 0.01373
27 0.9947 0.01061 0.005307


Meta Analysis of Goldfeld-Quandt test for Heteroskedasticity
Description# significant tests% significant testsOK/NOK
1% type I error level0 0OK
5% type I error level40.181818NOK
10% type I error level60.272727NOK

\begin{tabular}{lllllllll}
\hline
Meta Analysis of Goldfeld-Quandt test for Heteroskedasticity \tabularnewline
Description & # significant tests & % significant tests & OK/NOK \tabularnewline
1% type I error level & 0 &  0 & OK \tabularnewline
5% type I error level & 4 & 0.181818 & NOK \tabularnewline
10% type I error level & 6 & 0.272727 & NOK \tabularnewline
\hline
\end{tabular}
%Source: https://freestatistics.org/blog/index.php?pk=286244&T=6

[TABLE]
[ROW][C]Meta Analysis of Goldfeld-Quandt test for Heteroskedasticity[/C][/ROW]
[ROW][C]Description[/C][C]# significant tests[/C][C]% significant tests[/C][C]OK/NOK[/C][/ROW]
[ROW][C]1% type I error level[/C][C]0[/C][C] 0[/C][C]OK[/C][/ROW]
[ROW][C]5% type I error level[/C][C]4[/C][C]0.181818[/C][C]NOK[/C][/ROW]
[ROW][C]10% type I error level[/C][C]6[/C][C]0.272727[/C][C]NOK[/C][/ROW]
[/TABLE]
Source: https://freestatistics.org/blog/index.php?pk=286244&T=6

Globally Unique Identifier (entire table): ba.freestatistics.org/blog/index.php?pk=286244&T=6

As an alternative you can also use a QR Code:  

The GUIDs for individual cells are displayed in the table below:

Meta Analysis of Goldfeld-Quandt test for Heteroskedasticity
Description# significant tests% significant testsOK/NOK
1% type I error level0 0OK
5% type I error level40.181818NOK
10% type I error level60.272727NOK


Parameters (Session):
Parameters (R input):
par1 = 1 ; par2 = Do not include Seasonal Dummies ; par3 = Linear Trend ; par4 = 0 ; par5 = 0 ;
R code (references can be found in the software module):
library(lattice)
library(lmtest)
n25 <- 25 #minimum number of obs. for Goldfeld-Quandt test
mywarning <- ''
par1 <- as.numeric(par1)
if(is.na(par1)) {
par1 <- 1
mywarning = 'Warning: you did not specify the column number of the endogenous series! The first column was selected by default.'
}
if (par4=='') par4 <- 0
par4 <- as.numeric(par4)
if (par5=='') par5 <- 0
par5 <- as.numeric(par5)
x <- na.omit(t(y))
k <- length(x[1,])
n <- length(x[,1])
x1 <- cbind(x[,par1], x[,1:k!=par1])
mycolnames <- c(colnames(x)[par1], colnames(x)[1:k!=par1])
colnames(x1) <- mycolnames #colnames(x)[par1]
x <- x1
if (par3 == 'First Differences'){
(n <- n -1)
x2 <- array(0, dim=c(n,k), dimnames=list(1:n, paste('(1-B)',colnames(x),sep='')))
for (i in 1:n) {
for (j in 1:k) {
x2[i,j] <- x[i+1,j] - x[i,j]
}
}
x <- x2
}
if (par3 == 'Seasonal Differences (s=12)'){
(n <- n - 12)
x2 <- array(0, dim=c(n,k), dimnames=list(1:n, paste('(1-B12)',colnames(x),sep='')))
for (i in 1:n) {
for (j in 1:k) {
x2[i,j] <- x[i+12,j] - x[i,j]
}
}
x <- x2
}
if (par3 == 'First and Seasonal Differences (s=12)'){
(n <- n -1)
x2 <- array(0, dim=c(n,k), dimnames=list(1:n, paste('(1-B)',colnames(x),sep='')))
for (i in 1:n) {
for (j in 1:k) {
x2[i,j] <- x[i+1,j] - x[i,j]
}
}
x <- x2
(n <- n - 12)
x2 <- array(0, dim=c(n,k), dimnames=list(1:n, paste('(1-B12)',colnames(x),sep='')))
for (i in 1:n) {
for (j in 1:k) {
x2[i,j] <- x[i+12,j] - x[i,j]
}
}
x <- x2
}
if(par4 > 0) {
x2 <- array(0, dim=c(n-par4,par4), dimnames=list(1:(n-par4), paste(colnames(x)[par1],'(t-',1:par4,')',sep='')))
for (i in 1:(n-par4)) {
for (j in 1:par4) {
x2[i,j] <- x[i+par4-j,par1]
}
}
x <- cbind(x[(par4+1):n,], x2)
n <- n - par4
}
if(par5 > 0) {
x2 <- array(0, dim=c(n-par5*12,par5), dimnames=list(1:(n-par5*12), paste(colnames(x)[par1],'(t-',1:par5,'s)',sep='')))
for (i in 1:(n-par5*12)) {
for (j in 1:par5) {
x2[i,j] <- x[i+par5*12-j*12,par1]
}
}
x <- cbind(x[(par5*12+1):n,], x2)
n <- n - par5*12
}
if (par2 == 'Include Monthly Dummies'){
x2 <- array(0, dim=c(n,11), dimnames=list(1:n, paste('M', seq(1:11), sep ='')))
for (i in 1:11){
x2[seq(i,n,12),i] <- 1
}
x <- cbind(x, x2)
}
if (par2 == 'Include Quarterly Dummies'){
x2 <- array(0, dim=c(n,3), dimnames=list(1:n, paste('Q', seq(1:3), sep ='')))
for (i in 1:3){
x2[seq(i,n,4),i] <- 1
}
x <- cbind(x, x2)
}
(k <- length(x[n,]))
if (par3 == 'Linear Trend'){
x <- cbind(x, c(1:n))
colnames(x)[k+1] <- 't'
}
x
(k <- length(x[n,]))
head(x)
df <- as.data.frame(x)
(mylm <- lm(df))
(mysum <- summary(mylm))
if (n > n25) {
kp3 <- k + 3
nmkm3 <- n - k - 3
gqarr <- array(NA, dim=c(nmkm3-kp3+1,3))
numgqtests <- 0
numsignificant1 <- 0
numsignificant5 <- 0
numsignificant10 <- 0
for (mypoint in kp3:nmkm3) {
j <- 0
numgqtests <- numgqtests + 1
for (myalt in c('greater', 'two.sided', 'less')) {
j <- j + 1
gqarr[mypoint-kp3+1,j] <- gqtest(mylm, point=mypoint, alternative=myalt)$p.value
}
if (gqarr[mypoint-kp3+1,2] < 0.01) numsignificant1 <- numsignificant1 + 1
if (gqarr[mypoint-kp3+1,2] < 0.05) numsignificant5 <- numsignificant5 + 1
if (gqarr[mypoint-kp3+1,2] < 0.10) numsignificant10 <- numsignificant10 + 1
}
gqarr
}
bitmap(file='test0.png')
plot(x[,1], type='l', main='Actuals and Interpolation', ylab='value of Actuals and Interpolation (dots)', xlab='time or index')
points(x[,1]-mysum$resid)
grid()
dev.off()
bitmap(file='test1.png')
plot(mysum$resid, type='b', pch=19, main='Residuals', ylab='value of Residuals', xlab='time or index')
grid()
dev.off()
bitmap(file='test2.png')
hist(mysum$resid, main='Residual Histogram', xlab='values of Residuals')
grid()
dev.off()
bitmap(file='test3.png')
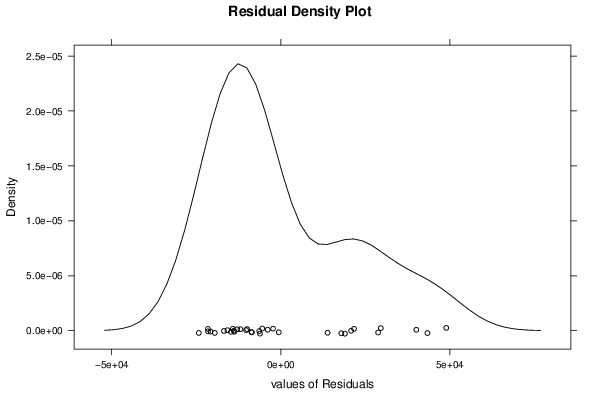
densityplot(~mysum$resid,col='black',main='Residual Density Plot', xlab='values of Residuals')
dev.off()
bitmap(file='test4.png')
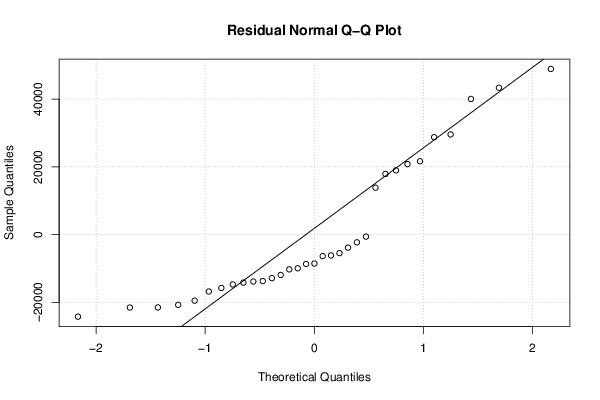
qqnorm(mysum$resid, main='Residual Normal Q-Q Plot')
qqline(mysum$resid)
grid()
dev.off()
(myerror <- as.ts(mysum$resid))
bitmap(file='test5.png')
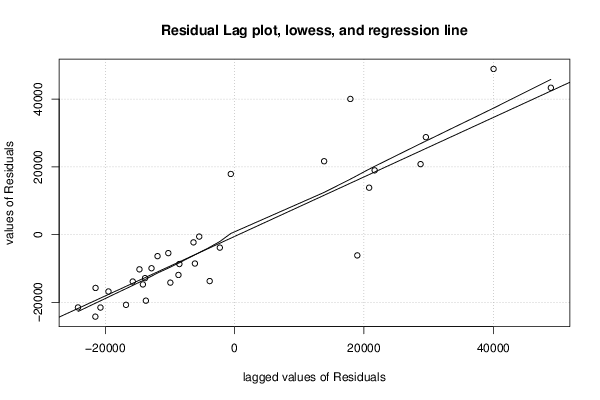
dum <- cbind(lag(myerror,k=1),myerror)
dum
dum1 <- dum[2:length(myerror),]
dum1
z <- as.data.frame(dum1)
z
plot(z,main=paste('Residual Lag plot, lowess, and regression line'), ylab='values of Residuals', xlab='lagged values of Residuals')
lines(lowess(z))
abline(lm(z))
grid()
dev.off()
bitmap(file='test6.png')
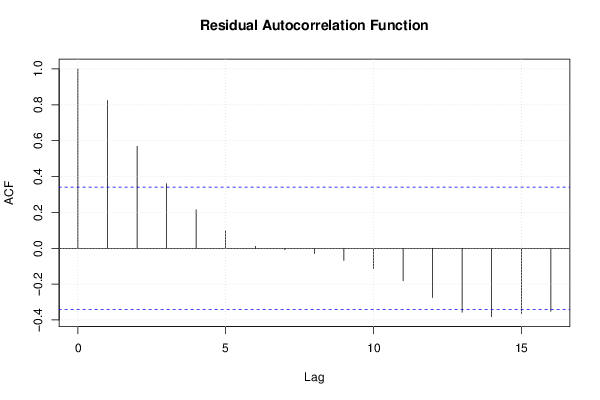
acf(mysum$resid, lag.max=length(mysum$resid)/2, main='Residual Autocorrelation Function')
grid()
dev.off()
bitmap(file='test7.png')
pacf(mysum$resid, lag.max=length(mysum$resid)/2, main='Residual Partial Autocorrelation Function')
grid()
dev.off()
bitmap(file='test8.png')
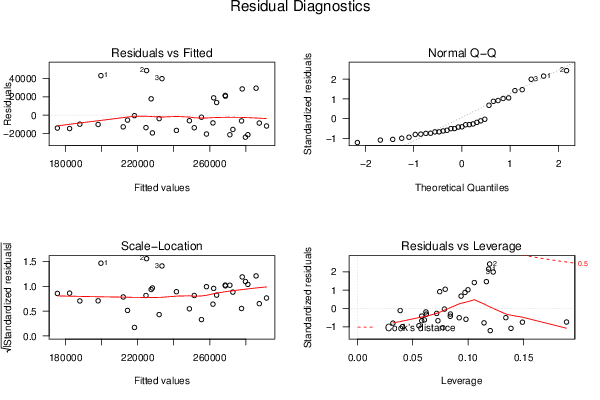
opar <- par(mfrow = c(2,2), oma = c(0, 0, 1.1, 0))
plot(mylm, las = 1, sub='Residual Diagnostics')
par(opar)
dev.off()
if (n > n25) {
bitmap(file='test9.png')
plot(kp3:nmkm3,gqarr[,2], main='Goldfeld-Quandt test',ylab='2-sided p-value',xlab='breakpoint')
grid()
dev.off()
}
load(file='createtable')
a<-table.start()
a<-table.row.start(a)
a<-table.element(a, 'Multiple Linear Regression - Estimated Regression Equation', 1, TRUE)
a<-table.row.end(a)
myeq <- colnames(x)[1]
myeq <- paste(myeq, '[t] = ', sep='')
for (i in 1:k){
if (mysum$coefficients[i,1] > 0) myeq <- paste(myeq, '+', '')
myeq <- paste(myeq, signif(mysum$coefficients[i,1],6), sep=' ')
if (rownames(mysum$coefficients)[i] != '(Intercept)') {
myeq <- paste(myeq, rownames(mysum$coefficients)[i], sep='')
if (rownames(mysum$coefficients)[i] != 't') myeq <- paste(myeq, '[t]', sep='')
}
}
myeq <- paste(myeq, ' + e[t]')
a<-table.row.start(a)
a<-table.element(a, myeq)
a<-table.row.end(a)
a<-table.row.start(a)
a<-table.element(a, mywarning)
a<-table.row.end(a)
a<-table.end(a)
table.save(a,file='mytable1.tab')
a<-table.start()
a<-table.row.start(a)
a<-table.element(a,hyperlink('ols1.htm','Multiple Linear Regression - Ordinary Least Squares',''), 6, TRUE)
a<-table.row.end(a)
a<-table.row.start(a)
a<-table.element(a,'Variable',header=TRUE)
a<-table.element(a,'Parameter',header=TRUE)
a<-table.element(a,'S.D.',header=TRUE)
a<-table.element(a,'T-STAT
H0: parameter = 0',header=TRUE)
a<-table.element(a,'2-tail p-value',header=TRUE)
a<-table.element(a,'1-tail p-value',header=TRUE)
a<-table.row.end(a)
for (i in 1:k){
a<-table.row.start(a)
a<-table.element(a,rownames(mysum$coefficients)[i],header=TRUE)
a<-table.element(a,formatC(signif(mysum$coefficients[i,1],5),format='g',flag='+'))
a<-table.element(a,formatC(signif(mysum$coefficients[i,2],5),format='g',flag=' '))
a<-table.element(a,formatC(signif(mysum$coefficients[i,3],4),format='e',flag='+'))
a<-table.element(a,formatC(signif(mysum$coefficients[i,4],4),format='g',flag=' '))
a<-table.element(a,formatC(signif(mysum$coefficients[i,4]/2,4),format='g',flag=' '))
a<-table.row.end(a)
}
a<-table.end(a)
table.save(a,file='mytable2.tab')
a<-table.start()
a<-table.row.start(a)
a<-table.element(a, 'Multiple Linear Regression - Regression Statistics', 2, TRUE)
a<-table.row.end(a)
a<-table.row.start(a)
a<-table.element(a, 'Multiple R',1,TRUE)
a<-table.element(a,formatC(signif(sqrt(mysum$r.squared),6),format='g',flag=' '))
a<-table.row.end(a)
a<-table.row.start(a)
a<-table.element(a, 'R-squared',1,TRUE)
a<-table.element(a,formatC(signif(mysum$r.squared,6),format='g',flag=' '))
a<-table.row.end(a)
a<-table.row.start(a)
a<-table.element(a, 'Adjusted R-squared',1,TRUE)
a<-table.element(a,formatC(signif(mysum$adj.r.squared,6),format='g',flag=' '))
a<-table.row.end(a)
a<-table.row.start(a)
a<-table.element(a, 'F-TEST (value)',1,TRUE)
a<-table.element(a,formatC(signif(mysum$fstatistic[1],6),format='g',flag=' '))
a<-table.row.end(a)
a<-table.row.start(a)
a<-table.element(a, 'F-TEST (DF numerator)',1,TRUE)
a<-table.element(a, signif(mysum$fstatistic[2],6))
a<-table.row.end(a)
a<-table.row.start(a)
a<-table.element(a, 'F-TEST (DF denominator)',1,TRUE)
a<-table.element(a, signif(mysum$fstatistic[3],6))
a<-table.row.end(a)
a<-table.row.start(a)
a<-table.element(a, 'p-value',1,TRUE)
a<-table.element(a,formatC(signif(1-pf(mysum$fstatistic[1],mysum$fstatistic[2],mysum$fstatistic[3]),6),format='g',flag=' '))
a<-table.row.end(a)
a<-table.row.start(a)
a<-table.element(a, 'Multiple Linear Regression - Residual Statistics', 2, TRUE)
a<-table.row.end(a)
a<-table.row.start(a)
a<-table.element(a, 'Residual Standard Deviation',1,TRUE)
a<-table.element(a,formatC(signif(mysum$sigma,6),format='g',flag=' '))
a<-table.row.end(a)
a<-table.row.start(a)
a<-table.element(a, 'Sum Squared Residuals',1,TRUE)
a<-table.element(a,formatC(signif(sum(myerror*myerror),6),format='g',flag=' '))
a<-table.row.end(a)
a<-table.end(a)
table.save(a,file='mytable3.tab')
if(n < 200) {
a<-table.start()
a<-table.row.start(a)
a<-table.element(a, 'Multiple Linear Regression - Actuals, Interpolation, and Residuals', 4, TRUE)
a<-table.row.end(a)
a<-table.row.start(a)
a<-table.element(a, 'Time or Index', 1, TRUE)
a<-table.element(a, 'Actuals', 1, TRUE)
a<-table.element(a, 'Interpolation
Forecast', 1, TRUE)
a<-table.element(a, 'Residuals
Prediction Error', 1, TRUE)
a<-table.row.end(a)
for (i in 1:n) {
a<-table.row.start(a)
a<-table.element(a,i, 1, TRUE)
a<-table.element(a,formatC(signif(x[i],6),format='g',flag=' '))
a<-table.element(a,formatC(signif(x[i]-mysum$resid[i],6),format='g',flag=' '))
a<-table.element(a,formatC(signif(mysum$resid[i],6),format='g',flag=' '))
a<-table.row.end(a)
}
a<-table.end(a)
table.save(a,file='mytable4.tab')
if (n > n25) {
a<-table.start()
a<-table.row.start(a)
a<-table.element(a,'Goldfeld-Quandt test for Heteroskedasticity',4,TRUE)
a<-table.row.end(a)
a<-table.row.start(a)
a<-table.element(a,'p-values',header=TRUE)
a<-table.element(a,'Alternative Hypothesis',3,header=TRUE)
a<-table.row.end(a)
a<-table.row.start(a)
a<-table.element(a,'breakpoint index',header=TRUE)
a<-table.element(a,'greater',header=TRUE)
a<-table.element(a,'2-sided',header=TRUE)
a<-table.element(a,'less',header=TRUE)
a<-table.row.end(a)
for (mypoint in kp3:nmkm3) {
a<-table.row.start(a)
a<-table.element(a,mypoint,header=TRUE)
a<-table.element(a,formatC(signif(gqarr[mypoint-kp3+1,1],6),format='g',flag=' '))
a<-table.element(a,formatC(signif(gqarr[mypoint-kp3+1,2],6),format='g',flag=' '))
a<-table.element(a,formatC(signif(gqarr[mypoint-kp3+1,3],6),format='g',flag=' '))
a<-table.row.end(a)
}
a<-table.end(a)
table.save(a,file='mytable5.tab')
a<-table.start()
a<-table.row.start(a)
a<-table.element(a,'Meta Analysis of Goldfeld-Quandt test for Heteroskedasticity',4,TRUE)
a<-table.row.end(a)
a<-table.row.start(a)
a<-table.element(a,'Description',header=TRUE)
a<-table.element(a,'# significant tests',header=TRUE)
a<-table.element(a,'% significant tests',header=TRUE)
a<-table.element(a,'OK/NOK',header=TRUE)
a<-table.row.end(a)
a<-table.row.start(a)
a<-table.element(a,'1% type I error level',header=TRUE)
a<-table.element(a,signif(numsignificant1,6))
a<-table.element(a,formatC(signif(numsignificant1/numgqtests,6),format='g',flag=' '))
if (numsignificant1/numgqtests < 0.01) dum <- 'OK' else dum <- 'NOK'
a<-table.element(a,dum)
a<-table.row.end(a)
a<-table.row.start(a)
a<-table.element(a,'5% type I error level',header=TRUE)
a<-table.element(a,signif(numsignificant5,6))
a<-table.element(a,signif(numsignificant5/numgqtests,6))
if (numsignificant5/numgqtests < 0.05) dum <- 'OK' else dum <- 'NOK'
a<-table.element(a,dum)
a<-table.row.end(a)
a<-table.row.start(a)
a<-table.element(a,'10% type I error level',header=TRUE)
a<-table.element(a,signif(numsignificant10,6))
a<-table.element(a,signif(numsignificant10/numgqtests,6))
if (numsignificant10/numgqtests < 0.1) dum <- 'OK' else dum <- 'NOK'
a<-table.element(a,dum)
a<-table.row.end(a)
a<-table.end(a)
table.save(a,file='mytable6.tab')
}
}