Free Statistics

of Irreproducible Research!

Author's title

Author*The author of this computation has been verified*
R Software Modulerwasp_exponentialsmoothing.wasp
Title produced by softwareExponential Smoothing
Date of computationMon, 14 Dec 2015 14:02:30 +0000
Cite this page as followsStatistical Computations at FreeStatistics.org, Office for Research Development and Education, URL https://freestatistics.org/blog/index.php?v=date/2015/Dec/14/t1450102968ojkszultwtxkftp.htm/, Retrieved Thu, 16 May 2024 05:47:19 +0000
Statistical Computations at FreeStatistics.org, Office for Research Development and Education, URL https://freestatistics.org/blog/index.php?pk=286308, Retrieved Thu, 16 May 2024 05:47:19 +0000
QR Codes:

Original text written by user:
IsPrivate?No (this computation is public)
User-defined keywords
Estimated Impact75
Family? (F = Feedback message, R = changed R code, M = changed R Module, P = changed Parameters, D = changed Data)
-       [Exponential Smoothing] [Double exponentia...] [2015-12-14 14:02:30] [ad3728658fedbe7404fc5a2c7dec5413] [Current]
Feedback Forum

Post a new message
Dataseries X:
1384
1470
1683
1679
1748
1604
1437
1592
1581
1854
1898
1815
1991
2112
2010
1442


Summary of computational transaction
Raw Inputview raw input (R code)
Raw Outputview raw output of R engine
Computing time2 seconds
R Server'George Udny Yule' @ yule.wessa.net

\begin{tabular}{lllllllll}
\hline
Summary of computational transaction \tabularnewline
Raw Input & view raw input (R code)  \tabularnewline
Raw Output & view raw output of R engine  \tabularnewline
Computing time & 2 seconds \tabularnewline
R Server & 'George Udny Yule' @ yule.wessa.net \tabularnewline
\hline
\end{tabular}
%Source: https://freestatistics.org/blog/index.php?pk=286308&T=0

[TABLE]
[ROW][C]Summary of computational transaction[/C][/ROW]
[ROW][C]Raw Input[/C][C]view raw input (R code) [/C][/ROW]
[ROW][C]Raw Output[/C][C]view raw output of R engine [/C][/ROW]
[ROW][C]Computing time[/C][C]2 seconds[/C][/ROW]
[ROW][C]R Server[/C][C]'George Udny Yule' @ yule.wessa.net[/C][/ROW]
[/TABLE]
Source: https://freestatistics.org/blog/index.php?pk=286308&T=0

Globally Unique Identifier (entire table): ba.freestatistics.org/blog/index.php?pk=286308&T=0

As an alternative you can also use a QR Code:  

The GUIDs for individual cells are displayed in the table below:

Summary of computational transaction
Raw Inputview raw input (R code)
Raw Outputview raw output of R engine
Computing time2 seconds
R Server'George Udny Yule' @ yule.wessa.net


Estimated Parameters of Exponential Smoothing
ParameterValue
alpha1
beta0.123111161250511
gammaFALSE

\begin{tabular}{lllllllll}
\hline
Estimated Parameters of Exponential Smoothing \tabularnewline
Parameter & Value \tabularnewline
alpha & 1 \tabularnewline
beta & 0.123111161250511 \tabularnewline
gamma & FALSE \tabularnewline
\hline
\end{tabular}
%Source: https://freestatistics.org/blog/index.php?pk=286308&T=1

[TABLE]
[ROW][C]Estimated Parameters of Exponential Smoothing[/C][/ROW]
[ROW][C]Parameter[/C][C]Value[/C][/ROW]
[ROW][C]alpha[/C][C]1[/C][/ROW]
[ROW][C]beta[/C][C]0.123111161250511[/C][/ROW]
[ROW][C]gamma[/C][C]FALSE[/C][/ROW]
[/TABLE]
Source: https://freestatistics.org/blog/index.php?pk=286308&T=1

Globally Unique Identifier (entire table): ba.freestatistics.org/blog/index.php?pk=286308&T=1

As an alternative you can also use a QR Code:  

The GUIDs for individual cells are displayed in the table below:

Estimated Parameters of Exponential Smoothing
ParameterValue
alpha1
beta0.123111161250511
gammaFALSE


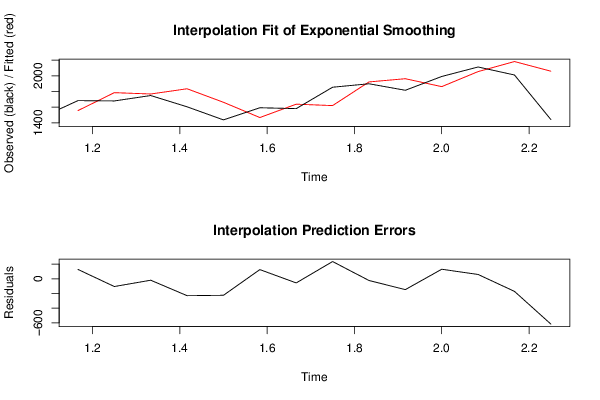
Interpolation Forecasts of Exponential Smoothing
tObservedFittedResiduals
316831556127
416791784.63511747881-105.635117478815
517481767.63025549716-19.6302554971639
616041834.21355194726-230.213551947264
714371661.87169423143-224.871694231431
815921467.18747882223124.81252117777
915811637.55329324303-56.5532932430292
1018541619.59095163934234.409048360661
1118981921.44932179065-23.4493217906474
1218151962.56244855446-147.562448554464
1319911861.39586415595129.604135844045
1421122053.3515798225858.6484201774156
1520102181.57185493613-171.571854936134
1614422058.44944463704-616.449444637042

\begin{tabular}{lllllllll}
\hline
Interpolation Forecasts of Exponential Smoothing \tabularnewline
t & Observed & Fitted & Residuals \tabularnewline
3 & 1683 & 1556 & 127 \tabularnewline
4 & 1679 & 1784.63511747881 & -105.635117478815 \tabularnewline
5 & 1748 & 1767.63025549716 & -19.6302554971639 \tabularnewline
6 & 1604 & 1834.21355194726 & -230.213551947264 \tabularnewline
7 & 1437 & 1661.87169423143 & -224.871694231431 \tabularnewline
8 & 1592 & 1467.18747882223 & 124.81252117777 \tabularnewline
9 & 1581 & 1637.55329324303 & -56.5532932430292 \tabularnewline
10 & 1854 & 1619.59095163934 & 234.409048360661 \tabularnewline
11 & 1898 & 1921.44932179065 & -23.4493217906474 \tabularnewline
12 & 1815 & 1962.56244855446 & -147.562448554464 \tabularnewline
13 & 1991 & 1861.39586415595 & 129.604135844045 \tabularnewline
14 & 2112 & 2053.35157982258 & 58.6484201774156 \tabularnewline
15 & 2010 & 2181.57185493613 & -171.571854936134 \tabularnewline
16 & 1442 & 2058.44944463704 & -616.449444637042 \tabularnewline
\hline
\end{tabular}
%Source: https://freestatistics.org/blog/index.php?pk=286308&T=2

[TABLE]
[ROW][C]Interpolation Forecasts of Exponential Smoothing[/C][/ROW]
[ROW][C]t[/C][C]Observed[/C][C]Fitted[/C][C]Residuals[/C][/ROW]
[ROW][C]3[/C][C]1683[/C][C]1556[/C][C]127[/C][/ROW]
[ROW][C]4[/C][C]1679[/C][C]1784.63511747881[/C][C]-105.635117478815[/C][/ROW]
[ROW][C]5[/C][C]1748[/C][C]1767.63025549716[/C][C]-19.6302554971639[/C][/ROW]
[ROW][C]6[/C][C]1604[/C][C]1834.21355194726[/C][C]-230.213551947264[/C][/ROW]
[ROW][C]7[/C][C]1437[/C][C]1661.87169423143[/C][C]-224.871694231431[/C][/ROW]
[ROW][C]8[/C][C]1592[/C][C]1467.18747882223[/C][C]124.81252117777[/C][/ROW]
[ROW][C]9[/C][C]1581[/C][C]1637.55329324303[/C][C]-56.5532932430292[/C][/ROW]
[ROW][C]10[/C][C]1854[/C][C]1619.59095163934[/C][C]234.409048360661[/C][/ROW]
[ROW][C]11[/C][C]1898[/C][C]1921.44932179065[/C][C]-23.4493217906474[/C][/ROW]
[ROW][C]12[/C][C]1815[/C][C]1962.56244855446[/C][C]-147.562448554464[/C][/ROW]
[ROW][C]13[/C][C]1991[/C][C]1861.39586415595[/C][C]129.604135844045[/C][/ROW]
[ROW][C]14[/C][C]2112[/C][C]2053.35157982258[/C][C]58.6484201774156[/C][/ROW]
[ROW][C]15[/C][C]2010[/C][C]2181.57185493613[/C][C]-171.571854936134[/C][/ROW]
[ROW][C]16[/C][C]1442[/C][C]2058.44944463704[/C][C]-616.449444637042[/C][/ROW]
[/TABLE]
Source: https://freestatistics.org/blog/index.php?pk=286308&T=2

Globally Unique Identifier (entire table): ba.freestatistics.org/blog/index.php?pk=286308&T=2

As an alternative you can also use a QR Code:  

The GUIDs for individual cells are displayed in the table below:

Interpolation Forecasts of Exponential Smoothing
tObservedFittedResiduals
316831556127
416791784.63511747881-105.635117478815
517481767.63025549716-19.6302554971639
616041834.21355194726-230.213551947264
714371661.87169423143-224.871694231431
815921467.18747882223124.81252117777
915811637.55329324303-56.5532932430292
1018541619.59095163934234.409048360661
1118981921.44932179065-23.4493217906474
1218151962.56244855446-147.562448554464
1319911861.39586415595129.604135844045
1421122053.3515798225858.6484201774156
1520102181.57185493613-171.571854936134
1614422058.44944463704-616.449444637042


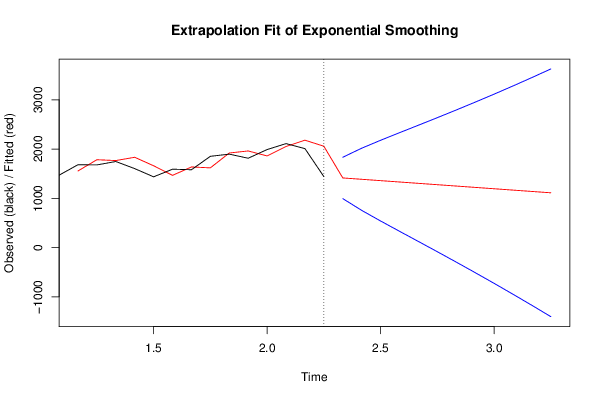
Extrapolation Forecasts of Exponential Smoothing
tForecast95% Lower Bound95% Upper Bound
171414.55763765554994.7825955206391834.33267979045
181387.11527531109755.8625579694552018.36799265272
191359.67291296663539.8264895005842179.51933643268
201332.23055062217330.9528581858812333.50824305847
211304.78818827772123.666684084692485.90969247075
221277.34582593326-84.62427857512762639.31593044165
231249.90346358881-295.2962412090222795.10316838663
241222.46110124435-509.1358872838322954.05808977253
251195.01873889989-726.6113012240843116.64877902387
261167.57637655544-948.0051523871133283.15790549799
271140.13401421098-1173.486341591263453.75437001322
281112.69165186652-1403.151205559243628.53450929228

\begin{tabular}{lllllllll}
\hline
Extrapolation Forecasts of Exponential Smoothing \tabularnewline
t & Forecast & 95% Lower Bound & 95% Upper Bound \tabularnewline
17 & 1414.55763765554 & 994.782595520639 & 1834.33267979045 \tabularnewline
18 & 1387.11527531109 & 755.862557969455 & 2018.36799265272 \tabularnewline
19 & 1359.67291296663 & 539.826489500584 & 2179.51933643268 \tabularnewline
20 & 1332.23055062217 & 330.952858185881 & 2333.50824305847 \tabularnewline
21 & 1304.78818827772 & 123.66668408469 & 2485.90969247075 \tabularnewline
22 & 1277.34582593326 & -84.6242785751276 & 2639.31593044165 \tabularnewline
23 & 1249.90346358881 & -295.296241209022 & 2795.10316838663 \tabularnewline
24 & 1222.46110124435 & -509.135887283832 & 2954.05808977253 \tabularnewline
25 & 1195.01873889989 & -726.611301224084 & 3116.64877902387 \tabularnewline
26 & 1167.57637655544 & -948.005152387113 & 3283.15790549799 \tabularnewline
27 & 1140.13401421098 & -1173.48634159126 & 3453.75437001322 \tabularnewline
28 & 1112.69165186652 & -1403.15120555924 & 3628.53450929228 \tabularnewline
\hline
\end{tabular}
%Source: https://freestatistics.org/blog/index.php?pk=286308&T=3

[TABLE]
[ROW][C]Extrapolation Forecasts of Exponential Smoothing[/C][/ROW]
[ROW][C]t[/C][C]Forecast[/C][C]95% Lower Bound[/C][C]95% Upper Bound[/C][/ROW]
[ROW][C]17[/C][C]1414.55763765554[/C][C]994.782595520639[/C][C]1834.33267979045[/C][/ROW]
[ROW][C]18[/C][C]1387.11527531109[/C][C]755.862557969455[/C][C]2018.36799265272[/C][/ROW]
[ROW][C]19[/C][C]1359.67291296663[/C][C]539.826489500584[/C][C]2179.51933643268[/C][/ROW]
[ROW][C]20[/C][C]1332.23055062217[/C][C]330.952858185881[/C][C]2333.50824305847[/C][/ROW]
[ROW][C]21[/C][C]1304.78818827772[/C][C]123.66668408469[/C][C]2485.90969247075[/C][/ROW]
[ROW][C]22[/C][C]1277.34582593326[/C][C]-84.6242785751276[/C][C]2639.31593044165[/C][/ROW]
[ROW][C]23[/C][C]1249.90346358881[/C][C]-295.296241209022[/C][C]2795.10316838663[/C][/ROW]
[ROW][C]24[/C][C]1222.46110124435[/C][C]-509.135887283832[/C][C]2954.05808977253[/C][/ROW]
[ROW][C]25[/C][C]1195.01873889989[/C][C]-726.611301224084[/C][C]3116.64877902387[/C][/ROW]
[ROW][C]26[/C][C]1167.57637655544[/C][C]-948.005152387113[/C][C]3283.15790549799[/C][/ROW]
[ROW][C]27[/C][C]1140.13401421098[/C][C]-1173.48634159126[/C][C]3453.75437001322[/C][/ROW]
[ROW][C]28[/C][C]1112.69165186652[/C][C]-1403.15120555924[/C][C]3628.53450929228[/C][/ROW]
[/TABLE]
Source: https://freestatistics.org/blog/index.php?pk=286308&T=3

Globally Unique Identifier (entire table): ba.freestatistics.org/blog/index.php?pk=286308&T=3

As an alternative you can also use a QR Code:  

The GUIDs for individual cells are displayed in the table below:

Extrapolation Forecasts of Exponential Smoothing
tForecast95% Lower Bound95% Upper Bound
171414.55763765554994.7825955206391834.33267979045
181387.11527531109755.8625579694552018.36799265272
191359.67291296663539.8264895005842179.51933643268
201332.23055062217330.9528581858812333.50824305847
211304.78818827772123.666684084692485.90969247075
221277.34582593326-84.62427857512762639.31593044165
231249.90346358881-295.2962412090222795.10316838663
241222.46110124435-509.1358872838322954.05808977253
251195.01873889989-726.6113012240843116.64877902387
261167.57637655544-948.0051523871133283.15790549799
271140.13401421098-1173.486341591263453.75437001322
281112.69165186652-1403.151205559243628.53450929228


Parameters (Session):
par1 = 12 ; par2 = Double ; par3 = additive ;
Parameters (R input):
par1 = 12 ; par2 = Double ; par3 = additive ;
R code (references can be found in the software module):
par1 <- as.numeric(par1)
if (par2 == 'Single') K <- 1
if (par2 == 'Double') K <- 2
if (par2 == 'Triple') K <- par1
nx <- length(x)
nxmK <- nx - K
x <- ts(x, frequency = par1)
if (par2 == 'Single') fit <- HoltWinters(x, gamma=F, beta=F)
if (par2 == 'Double') fit <- HoltWinters(x, gamma=F)
if (par2 == 'Triple') fit <- HoltWinters(x, seasonal=par3)
fit
myresid <- x - fit$fitted[,'xhat']
bitmap(file='test1.png')
op <- par(mfrow=c(2,1))
plot(fit,ylab='Observed (black) / Fitted (red)',main='Interpolation Fit of Exponential Smoothing')
plot(myresid,ylab='Residuals',main='Interpolation Prediction Errors')
par(op)
dev.off()
bitmap(file='test2.png')
p <- predict(fit, par1, prediction.interval=TRUE)
np <- length(p[,1])
plot(fit,p,ylab='Observed (black) / Fitted (red)',main='Extrapolation Fit of Exponential Smoothing')
dev.off()
bitmap(file='test3.png')
op <- par(mfrow = c(2,2))
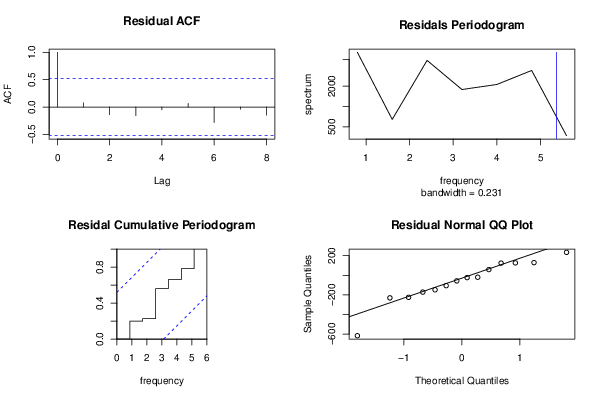
acf(as.numeric(myresid),lag.max = nx/2,main='Residual ACF')
spectrum(myresid,main='Residals Periodogram')
cpgram(myresid,main='Residal Cumulative Periodogram')
qqnorm(myresid,main='Residual Normal QQ Plot')
qqline(myresid)
par(op)
dev.off()
load(file='createtable')
a<-table.start()
a<-table.row.start(a)
a<-table.element(a,'Estimated Parameters of Exponential Smoothing',2,TRUE)
a<-table.row.end(a)
a<-table.row.start(a)
a<-table.element(a,'Parameter',header=TRUE)
a<-table.element(a,'Value',header=TRUE)
a<-table.row.end(a)
a<-table.row.start(a)
a<-table.element(a,'alpha',header=TRUE)
a<-table.element(a,fit$alpha)
a<-table.row.end(a)
a<-table.row.start(a)
a<-table.element(a,'beta',header=TRUE)
a<-table.element(a,fit$beta)
a<-table.row.end(a)
a<-table.row.start(a)
a<-table.element(a,'gamma',header=TRUE)
a<-table.element(a,fit$gamma)
a<-table.row.end(a)
a<-table.end(a)
table.save(a,file='mytable.tab')
a<-table.start()
a<-table.row.start(a)
a<-table.element(a,'Interpolation Forecasts of Exponential Smoothing',4,TRUE)
a<-table.row.end(a)
a<-table.row.start(a)
a<-table.element(a,'t',header=TRUE)
a<-table.element(a,'Observed',header=TRUE)
a<-table.element(a,'Fitted',header=TRUE)
a<-table.element(a,'Residuals',header=TRUE)
a<-table.row.end(a)
for (i in 1:nxmK) {
a<-table.row.start(a)
a<-table.element(a,i+K,header=TRUE)
a<-table.element(a,x[i+K])
a<-table.element(a,fit$fitted[i,'xhat'])
a<-table.element(a,myresid[i])
a<-table.row.end(a)
}
a<-table.end(a)
table.save(a,file='mytable1.tab')
a<-table.start()
a<-table.row.start(a)
a<-table.element(a,'Extrapolation Forecasts of Exponential Smoothing',4,TRUE)
a<-table.row.end(a)
a<-table.row.start(a)
a<-table.element(a,'t',header=TRUE)
a<-table.element(a,'Forecast',header=TRUE)
a<-table.element(a,'95% Lower Bound',header=TRUE)
a<-table.element(a,'95% Upper Bound',header=TRUE)
a<-table.row.end(a)
for (i in 1:np) {
a<-table.row.start(a)
a<-table.element(a,nx+i,header=TRUE)
a<-table.element(a,p[i,'fit'])
a<-table.element(a,p[i,'lwr'])
a<-table.element(a,p[i,'upr'])
a<-table.row.end(a)
}
a<-table.end(a)
table.save(a,file='mytable2.tab')