Free Statistics

of Irreproducible Research!

Author's title

Author*The author of this computation has been verified*
R Software Modulerwasp_exponentialsmoothing.wasp
Title produced by softwareExponential Smoothing
Date of computationMon, 14 Dec 2015 15:05:12 +0000
Cite this page as followsStatistical Computations at FreeStatistics.org, Office for Research Development and Education, URL https://freestatistics.org/blog/index.php?v=date/2015/Dec/14/t1450107645aqnu79hk7zr6ien.htm/, Retrieved Thu, 16 May 2024 14:34:27 +0000
Statistical Computations at FreeStatistics.org, Office for Research Development and Education, URL https://freestatistics.org/blog/index.php?pk=286328, Retrieved Thu, 16 May 2024 14:34:27 +0000
QR Codes:

Original text written by user:
IsPrivate?No (this computation is public)
User-defined keywords
Estimated Impact81
Family? (F = Feedback message, R = changed R code, M = changed R Module, P = changed Parameters, D = changed Data)
-       [Exponential Smoothing] [Double exponentia...] [2015-12-14 15:05:12] [ad3728658fedbe7404fc5a2c7dec5413] [Current]
Feedback Forum

Post a new message
Dataseries X:
1162
1253
1211
1248
1291
1388
1501
1485
1813
1788
1915
2348
2263
2652
2203


Summary of computational transaction
Raw Inputview raw input (R code)
Raw Outputview raw output of R engine
Computing time2 seconds
R Server'George Udny Yule' @ yule.wessa.net

\begin{tabular}{lllllllll}
\hline
Summary of computational transaction \tabularnewline
Raw Input & view raw input (R code)  \tabularnewline
Raw Output & view raw output of R engine  \tabularnewline
Computing time & 2 seconds \tabularnewline
R Server & 'George Udny Yule' @ yule.wessa.net \tabularnewline
\hline
\end{tabular}
%Source: https://freestatistics.org/blog/index.php?pk=286328&T=0

[TABLE]
[ROW][C]Summary of computational transaction[/C][/ROW]
[ROW][C]Raw Input[/C][C]view raw input (R code) [/C][/ROW]
[ROW][C]Raw Output[/C][C]view raw output of R engine [/C][/ROW]
[ROW][C]Computing time[/C][C]2 seconds[/C][/ROW]
[ROW][C]R Server[/C][C]'George Udny Yule' @ yule.wessa.net[/C][/ROW]
[/TABLE]
Source: https://freestatistics.org/blog/index.php?pk=286328&T=0

Globally Unique Identifier (entire table): ba.freestatistics.org/blog/index.php?pk=286328&T=0

As an alternative you can also use a QR Code:  

The GUIDs for individual cells are displayed in the table below:

Summary of computational transaction
Raw Inputview raw input (R code)
Raw Outputview raw output of R engine
Computing time2 seconds
R Server'George Udny Yule' @ yule.wessa.net


Estimated Parameters of Exponential Smoothing
ParameterValue
alpha0.389212108931943
beta0
gammaFALSE

\begin{tabular}{lllllllll}
\hline
Estimated Parameters of Exponential Smoothing \tabularnewline
Parameter & Value \tabularnewline
alpha & 0.389212108931943 \tabularnewline
beta & 0 \tabularnewline
gamma & FALSE \tabularnewline
\hline
\end{tabular}
%Source: https://freestatistics.org/blog/index.php?pk=286328&T=1

[TABLE]
[ROW][C]Estimated Parameters of Exponential Smoothing[/C][/ROW]
[ROW][C]Parameter[/C][C]Value[/C][/ROW]
[ROW][C]alpha[/C][C]0.389212108931943[/C][/ROW]
[ROW][C]beta[/C][C]0[/C][/ROW]
[ROW][C]gamma[/C][C]FALSE[/C][/ROW]
[/TABLE]
Source: https://freestatistics.org/blog/index.php?pk=286328&T=1

Globally Unique Identifier (entire table): ba.freestatistics.org/blog/index.php?pk=286328&T=1

As an alternative you can also use a QR Code:  

The GUIDs for individual cells are displayed in the table below:

Estimated Parameters of Exponential Smoothing
ParameterValue
alpha0.389212108931943
beta0
gammaFALSE


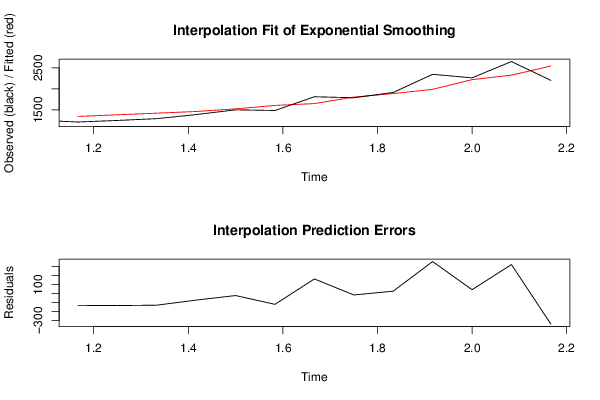
Interpolation Forecasts of Exponential Smoothing
tObservedFittedResiduals
312111344-133
412481383.23478951205-135.234789512052
512911421.5997718851-130.599771885099
613881461.76875924367-73.7687592436687
715011524.05706488515-23.0570648851476
814851606.08297603542-121.082976035419
918131649.95601557692163.043984423083
1017881804.41470860289-16.414708602892
1119151889.0259052500625.9740947499431
1223481990.13533744528357.86466255472
1322632220.4205974704242.5794025295791
1426522327.99301652602324.00698347398
1522032545.10045787261-342.100457872605

\begin{tabular}{lllllllll}
\hline
Interpolation Forecasts of Exponential Smoothing \tabularnewline
t & Observed & Fitted & Residuals \tabularnewline
3 & 1211 & 1344 & -133 \tabularnewline
4 & 1248 & 1383.23478951205 & -135.234789512052 \tabularnewline
5 & 1291 & 1421.5997718851 & -130.599771885099 \tabularnewline
6 & 1388 & 1461.76875924367 & -73.7687592436687 \tabularnewline
7 & 1501 & 1524.05706488515 & -23.0570648851476 \tabularnewline
8 & 1485 & 1606.08297603542 & -121.082976035419 \tabularnewline
9 & 1813 & 1649.95601557692 & 163.043984423083 \tabularnewline
10 & 1788 & 1804.41470860289 & -16.414708602892 \tabularnewline
11 & 1915 & 1889.02590525006 & 25.9740947499431 \tabularnewline
12 & 2348 & 1990.13533744528 & 357.86466255472 \tabularnewline
13 & 2263 & 2220.42059747042 & 42.5794025295791 \tabularnewline
14 & 2652 & 2327.99301652602 & 324.00698347398 \tabularnewline
15 & 2203 & 2545.10045787261 & -342.100457872605 \tabularnewline
\hline
\end{tabular}
%Source: https://freestatistics.org/blog/index.php?pk=286328&T=2

[TABLE]
[ROW][C]Interpolation Forecasts of Exponential Smoothing[/C][/ROW]
[ROW][C]t[/C][C]Observed[/C][C]Fitted[/C][C]Residuals[/C][/ROW]
[ROW][C]3[/C][C]1211[/C][C]1344[/C][C]-133[/C][/ROW]
[ROW][C]4[/C][C]1248[/C][C]1383.23478951205[/C][C]-135.234789512052[/C][/ROW]
[ROW][C]5[/C][C]1291[/C][C]1421.5997718851[/C][C]-130.599771885099[/C][/ROW]
[ROW][C]6[/C][C]1388[/C][C]1461.76875924367[/C][C]-73.7687592436687[/C][/ROW]
[ROW][C]7[/C][C]1501[/C][C]1524.05706488515[/C][C]-23.0570648851476[/C][/ROW]
[ROW][C]8[/C][C]1485[/C][C]1606.08297603542[/C][C]-121.082976035419[/C][/ROW]
[ROW][C]9[/C][C]1813[/C][C]1649.95601557692[/C][C]163.043984423083[/C][/ROW]
[ROW][C]10[/C][C]1788[/C][C]1804.41470860289[/C][C]-16.414708602892[/C][/ROW]
[ROW][C]11[/C][C]1915[/C][C]1889.02590525006[/C][C]25.9740947499431[/C][/ROW]
[ROW][C]12[/C][C]2348[/C][C]1990.13533744528[/C][C]357.86466255472[/C][/ROW]
[ROW][C]13[/C][C]2263[/C][C]2220.42059747042[/C][C]42.5794025295791[/C][/ROW]
[ROW][C]14[/C][C]2652[/C][C]2327.99301652602[/C][C]324.00698347398[/C][/ROW]
[ROW][C]15[/C][C]2203[/C][C]2545.10045787261[/C][C]-342.100457872605[/C][/ROW]
[/TABLE]
Source: https://freestatistics.org/blog/index.php?pk=286328&T=2

Globally Unique Identifier (entire table): ba.freestatistics.org/blog/index.php?pk=286328&T=2

As an alternative you can also use a QR Code:  

The GUIDs for individual cells are displayed in the table below:

Interpolation Forecasts of Exponential Smoothing
tObservedFittedResiduals
312111344-133
412481383.23478951205-135.234789512052
512911421.5997718851-130.599771885099
613881461.76875924367-73.7687592436687
715011524.05706488515-23.0570648851476
814851606.08297603542-121.082976035419
918131649.95601557692163.043984423083
1017881804.41470860289-16.414708602892
1119151889.0259052500625.9740947499431
1223481990.13533744528357.86466255472
1322632220.4205974704242.5794025295791
1426522327.99301652602324.00698347398
1522032545.10045787261-342.100457872605


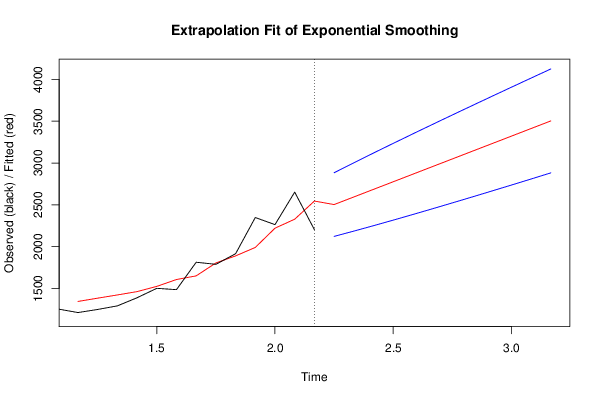
Extrapolation Forecasts of Exponential Smoothing
tForecast95% Lower Bound95% Upper Bound
162502.950817197422122.228374489532883.67325990532
172593.950817197422185.407772046693002.49386234816
182684.950817197422250.364506896923119.53712749793
192775.950817197422316.796047582453235.10558681239
202866.950817197422384.477041931093349.42459246376
212957.950817197422453.234277762353462.6673566325
223048.950817197422522.931210586713574.97042380814
233139.950817197422593.457937190323686.44369720453
243230.950817197422664.724440861923797.17719353293
253321.950817197422736.655891012683907.24574338217
263412.950817197422809.189281508734016.71235288612
273503.950817197422882.270969255784125.63066513907

\begin{tabular}{lllllllll}
\hline
Extrapolation Forecasts of Exponential Smoothing \tabularnewline
t & Forecast & 95% Lower Bound & 95% Upper Bound \tabularnewline
16 & 2502.95081719742 & 2122.22837448953 & 2883.67325990532 \tabularnewline
17 & 2593.95081719742 & 2185.40777204669 & 3002.49386234816 \tabularnewline
18 & 2684.95081719742 & 2250.36450689692 & 3119.53712749793 \tabularnewline
19 & 2775.95081719742 & 2316.79604758245 & 3235.10558681239 \tabularnewline
20 & 2866.95081719742 & 2384.47704193109 & 3349.42459246376 \tabularnewline
21 & 2957.95081719742 & 2453.23427776235 & 3462.6673566325 \tabularnewline
22 & 3048.95081719742 & 2522.93121058671 & 3574.97042380814 \tabularnewline
23 & 3139.95081719742 & 2593.45793719032 & 3686.44369720453 \tabularnewline
24 & 3230.95081719742 & 2664.72444086192 & 3797.17719353293 \tabularnewline
25 & 3321.95081719742 & 2736.65589101268 & 3907.24574338217 \tabularnewline
26 & 3412.95081719742 & 2809.18928150873 & 4016.71235288612 \tabularnewline
27 & 3503.95081719742 & 2882.27096925578 & 4125.63066513907 \tabularnewline
\hline
\end{tabular}
%Source: https://freestatistics.org/blog/index.php?pk=286328&T=3

[TABLE]
[ROW][C]Extrapolation Forecasts of Exponential Smoothing[/C][/ROW]
[ROW][C]t[/C][C]Forecast[/C][C]95% Lower Bound[/C][C]95% Upper Bound[/C][/ROW]
[ROW][C]16[/C][C]2502.95081719742[/C][C]2122.22837448953[/C][C]2883.67325990532[/C][/ROW]
[ROW][C]17[/C][C]2593.95081719742[/C][C]2185.40777204669[/C][C]3002.49386234816[/C][/ROW]
[ROW][C]18[/C][C]2684.95081719742[/C][C]2250.36450689692[/C][C]3119.53712749793[/C][/ROW]
[ROW][C]19[/C][C]2775.95081719742[/C][C]2316.79604758245[/C][C]3235.10558681239[/C][/ROW]
[ROW][C]20[/C][C]2866.95081719742[/C][C]2384.47704193109[/C][C]3349.42459246376[/C][/ROW]
[ROW][C]21[/C][C]2957.95081719742[/C][C]2453.23427776235[/C][C]3462.6673566325[/C][/ROW]
[ROW][C]22[/C][C]3048.95081719742[/C][C]2522.93121058671[/C][C]3574.97042380814[/C][/ROW]
[ROW][C]23[/C][C]3139.95081719742[/C][C]2593.45793719032[/C][C]3686.44369720453[/C][/ROW]
[ROW][C]24[/C][C]3230.95081719742[/C][C]2664.72444086192[/C][C]3797.17719353293[/C][/ROW]
[ROW][C]25[/C][C]3321.95081719742[/C][C]2736.65589101268[/C][C]3907.24574338217[/C][/ROW]
[ROW][C]26[/C][C]3412.95081719742[/C][C]2809.18928150873[/C][C]4016.71235288612[/C][/ROW]
[ROW][C]27[/C][C]3503.95081719742[/C][C]2882.27096925578[/C][C]4125.63066513907[/C][/ROW]
[/TABLE]
Source: https://freestatistics.org/blog/index.php?pk=286328&T=3

Globally Unique Identifier (entire table): ba.freestatistics.org/blog/index.php?pk=286328&T=3

As an alternative you can also use a QR Code:  

The GUIDs for individual cells are displayed in the table below:

Extrapolation Forecasts of Exponential Smoothing
tForecast95% Lower Bound95% Upper Bound
162502.950817197422122.228374489532883.67325990532
172593.950817197422185.407772046693002.49386234816
182684.950817197422250.364506896923119.53712749793
192775.950817197422316.796047582453235.10558681239
202866.950817197422384.477041931093349.42459246376
212957.950817197422453.234277762353462.6673566325
223048.950817197422522.931210586713574.97042380814
233139.950817197422593.457937190323686.44369720453
243230.950817197422664.724440861923797.17719353293
253321.950817197422736.655891012683907.24574338217
263412.950817197422809.189281508734016.71235288612
273503.950817197422882.270969255784125.63066513907


Parameters (Session):
par1 = 12 ; par2 = Double ; par3 = additive ;
Parameters (R input):
par1 = 12 ; par2 = Double ; par3 = additive ;
R code (references can be found in the software module):
par3 <- 'additive'
par2 <- 'Single'
par1 <- '12'
par1 <- as.numeric(par1)
if (par2 == 'Single') K <- 1
if (par2 == 'Double') K <- 2
if (par2 == 'Triple') K <- par1
nx <- length(x)
nxmK <- nx - K
x <- ts(x, frequency = par1)
if (par2 == 'Single') fit <- HoltWinters(x, gamma=F, beta=F)
if (par2 == 'Double') fit <- HoltWinters(x, gamma=F)
if (par2 == 'Triple') fit <- HoltWinters(x, seasonal=par3)
fit
myresid <- x - fit$fitted[,'xhat']
bitmap(file='test1.png')
op <- par(mfrow=c(2,1))
plot(fit,ylab='Observed (black) / Fitted (red)',main='Interpolation Fit of Exponential Smoothing')
plot(myresid,ylab='Residuals',main='Interpolation Prediction Errors')
par(op)
dev.off()
bitmap(file='test2.png')
p <- predict(fit, par1, prediction.interval=TRUE)
np <- length(p[,1])
plot(fit,p,ylab='Observed (black) / Fitted (red)',main='Extrapolation Fit of Exponential Smoothing')
dev.off()
bitmap(file='test3.png')
op <- par(mfrow = c(2,2))
acf(as.numeric(myresid),lag.max = nx/2,main='Residual ACF')
spectrum(myresid,main='Residals Periodogram')
cpgram(myresid,main='Residal Cumulative Periodogram')
qqnorm(myresid,main='Residual Normal QQ Plot')
qqline(myresid)
par(op)
dev.off()
load(file='createtable')
a<-table.start()
a<-table.row.start(a)
a<-table.element(a,'Estimated Parameters of Exponential Smoothing',2,TRUE)
a<-table.row.end(a)
a<-table.row.start(a)
a<-table.element(a,'Parameter',header=TRUE)
a<-table.element(a,'Value',header=TRUE)
a<-table.row.end(a)
a<-table.row.start(a)
a<-table.element(a,'alpha',header=TRUE)
a<-table.element(a,fit$alpha)
a<-table.row.end(a)
a<-table.row.start(a)
a<-table.element(a,'beta',header=TRUE)
a<-table.element(a,fit$beta)
a<-table.row.end(a)
a<-table.row.start(a)
a<-table.element(a,'gamma',header=TRUE)
a<-table.element(a,fit$gamma)
a<-table.row.end(a)
a<-table.end(a)
table.save(a,file='mytable.tab')
a<-table.start()
a<-table.row.start(a)
a<-table.element(a,'Interpolation Forecasts of Exponential Smoothing',4,TRUE)
a<-table.row.end(a)
a<-table.row.start(a)
a<-table.element(a,'t',header=TRUE)
a<-table.element(a,'Observed',header=TRUE)
a<-table.element(a,'Fitted',header=TRUE)
a<-table.element(a,'Residuals',header=TRUE)
a<-table.row.end(a)
for (i in 1:nxmK) {
a<-table.row.start(a)
a<-table.element(a,i+K,header=TRUE)
a<-table.element(a,x[i+K])
a<-table.element(a,fit$fitted[i,'xhat'])
a<-table.element(a,myresid[i])
a<-table.row.end(a)
}
a<-table.end(a)
table.save(a,file='mytable1.tab')
a<-table.start()
a<-table.row.start(a)
a<-table.element(a,'Extrapolation Forecasts of Exponential Smoothing',4,TRUE)
a<-table.row.end(a)
a<-table.row.start(a)
a<-table.element(a,'t',header=TRUE)
a<-table.element(a,'Forecast',header=TRUE)
a<-table.element(a,'95% Lower Bound',header=TRUE)
a<-table.element(a,'95% Upper Bound',header=TRUE)
a<-table.row.end(a)
for (i in 1:np) {
a<-table.row.start(a)
a<-table.element(a,nx+i,header=TRUE)
a<-table.element(a,p[i,'fit'])
a<-table.element(a,p[i,'lwr'])
a<-table.element(a,p[i,'upr'])
a<-table.row.end(a)
}
a<-table.end(a)
table.save(a,file='mytable2.tab')