Free Statistics

of Irreproducible Research!

Author's title

Author*Unverified author*
R Software Modulerwasp_autocorrelation.wasp
Title produced by software(Partial) Autocorrelation Function
Date of computationMon, 14 Dec 2015 16:51:51 +0000
Cite this page as followsStatistical Computations at FreeStatistics.org, Office for Research Development and Education, URL https://freestatistics.org/blog/index.php?v=date/2015/Dec/14/t1450111938v03vi39p5jtixaf.htm/, Retrieved Thu, 16 May 2024 05:38:32 +0000
Statistical Computations at FreeStatistics.org, Office for Research Development and Education, URL https://freestatistics.org/blog/index.php?pk=286345, Retrieved Thu, 16 May 2024 05:38:32 +0000
QR Codes:

Original text written by user:
IsPrivate?No (this computation is public)
User-defined keywords
Estimated Impact59
Family? (F = Feedback message, R = changed R code, M = changed R Module, P = changed Parameters, D = changed Data)
-       [(Partial) Autocorrelation Function] [] [2015-12-14 16:51:51] [237b8e3b7b7bc12136ba0893525d9132] [Current]
Feedback Forum

Post a new message
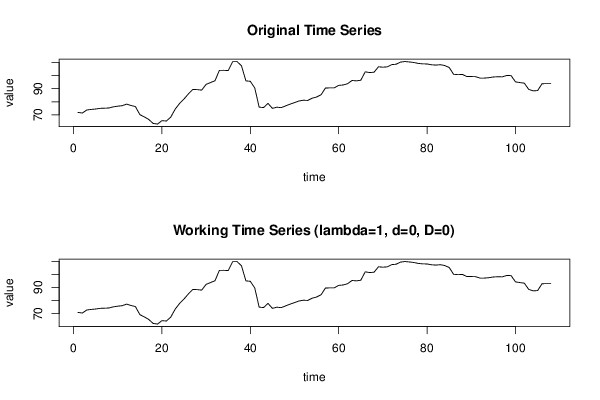
Dataseries X:
71,83
71,39
73,71
74,13
74,45
74,95
75,09
75,23
76,11
76,64
76,97
78,23
77,15
76,33
70,19
68,42
66,49
63,41
62,92
65,53
65,26
68,25
74,39
78,71
82,15
86,05
89,46
89,32
88,94
93,35
94,72
96,11
104,06
104,11
103,9
110,75
110,82
107,59
96,03
95,69
90,63
75,87
75,57
78,78
74,93
75,85
75,49
76,87
78,18
79,37
80,59
81,18
81,02
82,75
83,63
85,35
90,52
90,66
90,69
92,56
92,87
93,82
96,32
96,03
96,53
102,96
102,38
102,66
106,83
106,5
106,78
108,49
108,77
110,43
110,84
110,52
110,11
109,42
109,06
108,98
108,36
108,11
108,44
107,76
106,27
101,07
100,79
100,97
99,33
99,35
99,23
98,14
98,17
98,48
99
99,19
99,1
100,13
100,07
95,26
94,72
94,25
89,46
88,38
88,57
93,82
93,94
93,92


Summary of computational transaction
Raw Inputview raw input (R code)
Raw Outputview raw output of R engine
Computing time1 seconds
R Server'Herman Ole Andreas Wold' @ wold.wessa.net

\begin{tabular}{lllllllll}
\hline
Summary of computational transaction \tabularnewline
Raw Input & view raw input (R code)  \tabularnewline
Raw Output & view raw output of R engine  \tabularnewline
Computing time & 1 seconds \tabularnewline
R Server & 'Herman Ole Andreas Wold' @ wold.wessa.net \tabularnewline
\hline
\end{tabular}
%Source: https://freestatistics.org/blog/index.php?pk=286345&T=0

[TABLE]
[ROW][C]Summary of computational transaction[/C][/ROW]
[ROW][C]Raw Input[/C][C]view raw input (R code) [/C][/ROW]
[ROW][C]Raw Output[/C][C]view raw output of R engine [/C][/ROW]
[ROW][C]Computing time[/C][C]1 seconds[/C][/ROW]
[ROW][C]R Server[/C][C]'Herman Ole Andreas Wold' @ wold.wessa.net[/C][/ROW]
[/TABLE]
Source: https://freestatistics.org/blog/index.php?pk=286345&T=0

Globally Unique Identifier (entire table): ba.freestatistics.org/blog/index.php?pk=286345&T=0

As an alternative you can also use a QR Code:  

The GUIDs for individual cells are displayed in the table below:

Summary of computational transaction
Raw Inputview raw input (R code)
Raw Outputview raw output of R engine
Computing time1 seconds
R Server'Herman Ole Andreas Wold' @ wold.wessa.net


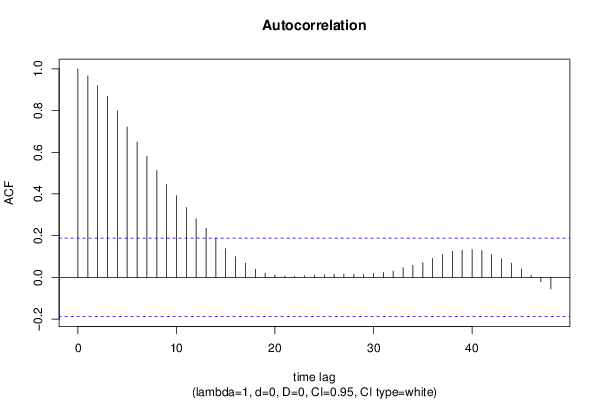
Autocorrelation Function
Time lag kACF(k)T-STATP-value
10.96689610.04830
20.9194869.55560
30.8684199.02490
40.7981088.29420
50.7215877.4990
60.6491096.74570
70.5803836.03150
80.5122845.32380
90.4472284.64775e-06
100.3912874.06644.5e-05
110.3356073.48770.000353
120.2814072.92450.002103
130.2352752.4450.00805
140.1884251.95820.026395
150.1378221.43230.077475
160.0995291.03430.151645
170.067960.70630.240774
180.0391650.4070.342402
190.0202860.21080.416713
200.0112080.11650.453746
210.0057970.06020.476034
220.004020.04180.483376
230.0072030.07490.470232
240.0109110.11340.454966
250.0125880.13080.448081
260.014520.15090.44017
270.0156350.16250.435615
280.0151260.15720.437692
290.0144160.14980.440595
300.0189490.19690.422129
310.0233750.24290.404265
320.0309480.32160.374182
330.045970.47770.316902
340.0573540.5960.276198
350.0701370.72890.233825
360.0908630.94430.173569
370.1096851.13990.128429
380.1253811.3030.097673
390.1301751.35280.08947
400.1329611.38180.084947
410.1287261.33780.091893
420.1086421.1290.130691
430.0879410.91390.1814
440.0682140.70890.239958
450.0396390.41190.3406
460.0101960.1060.457904
47-0.02108-0.21910.413505
48-0.055529-0.57710.282546

\begin{tabular}{lllllllll}
\hline
Autocorrelation Function \tabularnewline
Time lag k & ACF(k) & T-STAT & P-value \tabularnewline
1 & 0.966896 & 10.0483 & 0 \tabularnewline
2 & 0.919486 & 9.5556 & 0 \tabularnewline
3 & 0.868419 & 9.0249 & 0 \tabularnewline
4 & 0.798108 & 8.2942 & 0 \tabularnewline
5 & 0.721587 & 7.499 & 0 \tabularnewline
6 & 0.649109 & 6.7457 & 0 \tabularnewline
7 & 0.580383 & 6.0315 & 0 \tabularnewline
8 & 0.512284 & 5.3238 & 0 \tabularnewline
9 & 0.447228 & 4.6477 & 5e-06 \tabularnewline
10 & 0.391287 & 4.0664 & 4.5e-05 \tabularnewline
11 & 0.335607 & 3.4877 & 0.000353 \tabularnewline
12 & 0.281407 & 2.9245 & 0.002103 \tabularnewline
13 & 0.235275 & 2.445 & 0.00805 \tabularnewline
14 & 0.188425 & 1.9582 & 0.026395 \tabularnewline
15 & 0.137822 & 1.4323 & 0.077475 \tabularnewline
16 & 0.099529 & 1.0343 & 0.151645 \tabularnewline
17 & 0.06796 & 0.7063 & 0.240774 \tabularnewline
18 & 0.039165 & 0.407 & 0.342402 \tabularnewline
19 & 0.020286 & 0.2108 & 0.416713 \tabularnewline
20 & 0.011208 & 0.1165 & 0.453746 \tabularnewline
21 & 0.005797 & 0.0602 & 0.476034 \tabularnewline
22 & 0.00402 & 0.0418 & 0.483376 \tabularnewline
23 & 0.007203 & 0.0749 & 0.470232 \tabularnewline
24 & 0.010911 & 0.1134 & 0.454966 \tabularnewline
25 & 0.012588 & 0.1308 & 0.448081 \tabularnewline
26 & 0.01452 & 0.1509 & 0.44017 \tabularnewline
27 & 0.015635 & 0.1625 & 0.435615 \tabularnewline
28 & 0.015126 & 0.1572 & 0.437692 \tabularnewline
29 & 0.014416 & 0.1498 & 0.440595 \tabularnewline
30 & 0.018949 & 0.1969 & 0.422129 \tabularnewline
31 & 0.023375 & 0.2429 & 0.404265 \tabularnewline
32 & 0.030948 & 0.3216 & 0.374182 \tabularnewline
33 & 0.04597 & 0.4777 & 0.316902 \tabularnewline
34 & 0.057354 & 0.596 & 0.276198 \tabularnewline
35 & 0.070137 & 0.7289 & 0.233825 \tabularnewline
36 & 0.090863 & 0.9443 & 0.173569 \tabularnewline
37 & 0.109685 & 1.1399 & 0.128429 \tabularnewline
38 & 0.125381 & 1.303 & 0.097673 \tabularnewline
39 & 0.130175 & 1.3528 & 0.08947 \tabularnewline
40 & 0.132961 & 1.3818 & 0.084947 \tabularnewline
41 & 0.128726 & 1.3378 & 0.091893 \tabularnewline
42 & 0.108642 & 1.129 & 0.130691 \tabularnewline
43 & 0.087941 & 0.9139 & 0.1814 \tabularnewline
44 & 0.068214 & 0.7089 & 0.239958 \tabularnewline
45 & 0.039639 & 0.4119 & 0.3406 \tabularnewline
46 & 0.010196 & 0.106 & 0.457904 \tabularnewline
47 & -0.02108 & -0.2191 & 0.413505 \tabularnewline
48 & -0.055529 & -0.5771 & 0.282546 \tabularnewline
\hline
\end{tabular}
%Source: https://freestatistics.org/blog/index.php?pk=286345&T=1

[TABLE]
[ROW][C]Autocorrelation Function[/C][/ROW]
[ROW][C]Time lag k[/C][C]ACF(k)[/C][C]T-STAT[/C][C]P-value[/C][/ROW]
[ROW][C]1[/C][C]0.966896[/C][C]10.0483[/C][C]0[/C][/ROW]
[ROW][C]2[/C][C]0.919486[/C][C]9.5556[/C][C]0[/C][/ROW]
[ROW][C]3[/C][C]0.868419[/C][C]9.0249[/C][C]0[/C][/ROW]
[ROW][C]4[/C][C]0.798108[/C][C]8.2942[/C][C]0[/C][/ROW]
[ROW][C]5[/C][C]0.721587[/C][C]7.499[/C][C]0[/C][/ROW]
[ROW][C]6[/C][C]0.649109[/C][C]6.7457[/C][C]0[/C][/ROW]
[ROW][C]7[/C][C]0.580383[/C][C]6.0315[/C][C]0[/C][/ROW]
[ROW][C]8[/C][C]0.512284[/C][C]5.3238[/C][C]0[/C][/ROW]
[ROW][C]9[/C][C]0.447228[/C][C]4.6477[/C][C]5e-06[/C][/ROW]
[ROW][C]10[/C][C]0.391287[/C][C]4.0664[/C][C]4.5e-05[/C][/ROW]
[ROW][C]11[/C][C]0.335607[/C][C]3.4877[/C][C]0.000353[/C][/ROW]
[ROW][C]12[/C][C]0.281407[/C][C]2.9245[/C][C]0.002103[/C][/ROW]
[ROW][C]13[/C][C]0.235275[/C][C]2.445[/C][C]0.00805[/C][/ROW]
[ROW][C]14[/C][C]0.188425[/C][C]1.9582[/C][C]0.026395[/C][/ROW]
[ROW][C]15[/C][C]0.137822[/C][C]1.4323[/C][C]0.077475[/C][/ROW]
[ROW][C]16[/C][C]0.099529[/C][C]1.0343[/C][C]0.151645[/C][/ROW]
[ROW][C]17[/C][C]0.06796[/C][C]0.7063[/C][C]0.240774[/C][/ROW]
[ROW][C]18[/C][C]0.039165[/C][C]0.407[/C][C]0.342402[/C][/ROW]
[ROW][C]19[/C][C]0.020286[/C][C]0.2108[/C][C]0.416713[/C][/ROW]
[ROW][C]20[/C][C]0.011208[/C][C]0.1165[/C][C]0.453746[/C][/ROW]
[ROW][C]21[/C][C]0.005797[/C][C]0.0602[/C][C]0.476034[/C][/ROW]
[ROW][C]22[/C][C]0.00402[/C][C]0.0418[/C][C]0.483376[/C][/ROW]
[ROW][C]23[/C][C]0.007203[/C][C]0.0749[/C][C]0.470232[/C][/ROW]
[ROW][C]24[/C][C]0.010911[/C][C]0.1134[/C][C]0.454966[/C][/ROW]
[ROW][C]25[/C][C]0.012588[/C][C]0.1308[/C][C]0.448081[/C][/ROW]
[ROW][C]26[/C][C]0.01452[/C][C]0.1509[/C][C]0.44017[/C][/ROW]
[ROW][C]27[/C][C]0.015635[/C][C]0.1625[/C][C]0.435615[/C][/ROW]
[ROW][C]28[/C][C]0.015126[/C][C]0.1572[/C][C]0.437692[/C][/ROW]
[ROW][C]29[/C][C]0.014416[/C][C]0.1498[/C][C]0.440595[/C][/ROW]
[ROW][C]30[/C][C]0.018949[/C][C]0.1969[/C][C]0.422129[/C][/ROW]
[ROW][C]31[/C][C]0.023375[/C][C]0.2429[/C][C]0.404265[/C][/ROW]
[ROW][C]32[/C][C]0.030948[/C][C]0.3216[/C][C]0.374182[/C][/ROW]
[ROW][C]33[/C][C]0.04597[/C][C]0.4777[/C][C]0.316902[/C][/ROW]
[ROW][C]34[/C][C]0.057354[/C][C]0.596[/C][C]0.276198[/C][/ROW]
[ROW][C]35[/C][C]0.070137[/C][C]0.7289[/C][C]0.233825[/C][/ROW]
[ROW][C]36[/C][C]0.090863[/C][C]0.9443[/C][C]0.173569[/C][/ROW]
[ROW][C]37[/C][C]0.109685[/C][C]1.1399[/C][C]0.128429[/C][/ROW]
[ROW][C]38[/C][C]0.125381[/C][C]1.303[/C][C]0.097673[/C][/ROW]
[ROW][C]39[/C][C]0.130175[/C][C]1.3528[/C][C]0.08947[/C][/ROW]
[ROW][C]40[/C][C]0.132961[/C][C]1.3818[/C][C]0.084947[/C][/ROW]
[ROW][C]41[/C][C]0.128726[/C][C]1.3378[/C][C]0.091893[/C][/ROW]
[ROW][C]42[/C][C]0.108642[/C][C]1.129[/C][C]0.130691[/C][/ROW]
[ROW][C]43[/C][C]0.087941[/C][C]0.9139[/C][C]0.1814[/C][/ROW]
[ROW][C]44[/C][C]0.068214[/C][C]0.7089[/C][C]0.239958[/C][/ROW]
[ROW][C]45[/C][C]0.039639[/C][C]0.4119[/C][C]0.3406[/C][/ROW]
[ROW][C]46[/C][C]0.010196[/C][C]0.106[/C][C]0.457904[/C][/ROW]
[ROW][C]47[/C][C]-0.02108[/C][C]-0.2191[/C][C]0.413505[/C][/ROW]
[ROW][C]48[/C][C]-0.055529[/C][C]-0.5771[/C][C]0.282546[/C][/ROW]
[/TABLE]
Source: https://freestatistics.org/blog/index.php?pk=286345&T=1

Globally Unique Identifier (entire table): ba.freestatistics.org/blog/index.php?pk=286345&T=1

As an alternative you can also use a QR Code:  

The GUIDs for individual cells are displayed in the table below:

Autocorrelation Function
Time lag kACF(k)T-STATP-value
10.96689610.04830
20.9194869.55560
30.8684199.02490
40.7981088.29420
50.7215877.4990
60.6491096.74570
70.5803836.03150
80.5122845.32380
90.4472284.64775e-06
100.3912874.06644.5e-05
110.3356073.48770.000353
120.2814072.92450.002103
130.2352752.4450.00805
140.1884251.95820.026395
150.1378221.43230.077475
160.0995291.03430.151645
170.067960.70630.240774
180.0391650.4070.342402
190.0202860.21080.416713
200.0112080.11650.453746
210.0057970.06020.476034
220.004020.04180.483376
230.0072030.07490.470232
240.0109110.11340.454966
250.0125880.13080.448081
260.014520.15090.44017
270.0156350.16250.435615
280.0151260.15720.437692
290.0144160.14980.440595
300.0189490.19690.422129
310.0233750.24290.404265
320.0309480.32160.374182
330.045970.47770.316902
340.0573540.5960.276198
350.0701370.72890.233825
360.0908630.94430.173569
370.1096851.13990.128429
380.1253811.3030.097673
390.1301751.35280.08947
400.1329611.38180.084947
410.1287261.33780.091893
420.1086421.1290.130691
430.0879410.91390.1814
440.0682140.70890.239958
450.0396390.41190.3406
460.0101960.1060.457904
47-0.02108-0.21910.413505
48-0.055529-0.57710.282546


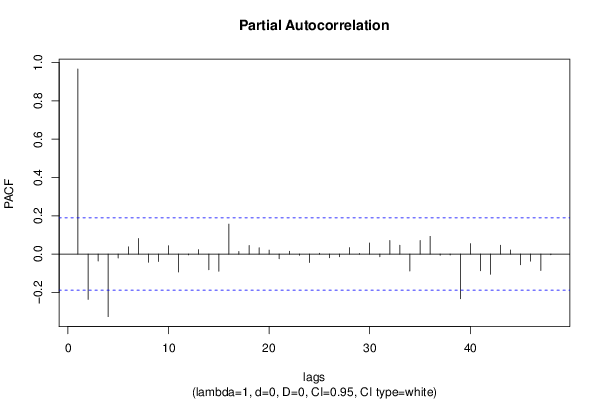
Partial Autocorrelation Function
Time lag kPACF(k)T-STATP-value
10.96689610.04830
2-0.236549-2.45830.007775
3-0.036021-0.37430.35444
4-0.32667-3.39490.000481
5-0.02058-0.21390.415526
60.0379170.3940.347161
70.0816720.84880.198946
8-0.042919-0.4460.328235
9-0.038774-0.40290.343891
100.0434050.45110.32642
11-0.0933-0.96960.167207
12-0.004307-0.04480.48219
130.0233870.2430.404215
14-0.08195-0.85170.198146
15-0.090015-0.93550.175818
160.1567871.62940.053073
170.0135740.14110.444039
180.0448260.46580.321132
190.0333740.34680.364694
200.0208790.2170.414317
21-0.024475-0.25440.399854
220.0153010.1590.436976
23-0.006087-0.06330.474839
24-0.043695-0.45410.325335
250.0041210.04280.482959
26-0.019024-0.19770.421823
27-0.014307-0.14870.441041
280.0340460.35380.362085
290.003080.0320.487264
300.0580730.60350.273716
31-0.014326-0.14890.440963
320.0713170.74110.230106
330.0461810.47990.316125
34-0.088612-0.92090.179583
350.0714930.7430.229556
360.092690.96330.168785
37-0.005768-0.05990.476154
38-0.004588-0.04770.481031
39-0.233655-2.42820.008413
400.054720.56870.285383
41-0.087455-0.90890.182725
42-0.104994-1.09110.138821
430.0464580.48280.315106
440.0211590.21990.413185
45-0.055915-0.58110.281197
46-0.036833-0.38280.351318
47-0.085543-0.8890.187991
48-0.003162-0.03290.486924

\begin{tabular}{lllllllll}
\hline
Partial Autocorrelation Function \tabularnewline
Time lag k & PACF(k) & T-STAT & P-value \tabularnewline
1 & 0.966896 & 10.0483 & 0 \tabularnewline
2 & -0.236549 & -2.4583 & 0.007775 \tabularnewline
3 & -0.036021 & -0.3743 & 0.35444 \tabularnewline
4 & -0.32667 & -3.3949 & 0.000481 \tabularnewline
5 & -0.02058 & -0.2139 & 0.415526 \tabularnewline
6 & 0.037917 & 0.394 & 0.347161 \tabularnewline
7 & 0.081672 & 0.8488 & 0.198946 \tabularnewline
8 & -0.042919 & -0.446 & 0.328235 \tabularnewline
9 & -0.038774 & -0.4029 & 0.343891 \tabularnewline
10 & 0.043405 & 0.4511 & 0.32642 \tabularnewline
11 & -0.0933 & -0.9696 & 0.167207 \tabularnewline
12 & -0.004307 & -0.0448 & 0.48219 \tabularnewline
13 & 0.023387 & 0.243 & 0.404215 \tabularnewline
14 & -0.08195 & -0.8517 & 0.198146 \tabularnewline
15 & -0.090015 & -0.9355 & 0.175818 \tabularnewline
16 & 0.156787 & 1.6294 & 0.053073 \tabularnewline
17 & 0.013574 & 0.1411 & 0.444039 \tabularnewline
18 & 0.044826 & 0.4658 & 0.321132 \tabularnewline
19 & 0.033374 & 0.3468 & 0.364694 \tabularnewline
20 & 0.020879 & 0.217 & 0.414317 \tabularnewline
21 & -0.024475 & -0.2544 & 0.399854 \tabularnewline
22 & 0.015301 & 0.159 & 0.436976 \tabularnewline
23 & -0.006087 & -0.0633 & 0.474839 \tabularnewline
24 & -0.043695 & -0.4541 & 0.325335 \tabularnewline
25 & 0.004121 & 0.0428 & 0.482959 \tabularnewline
26 & -0.019024 & -0.1977 & 0.421823 \tabularnewline
27 & -0.014307 & -0.1487 & 0.441041 \tabularnewline
28 & 0.034046 & 0.3538 & 0.362085 \tabularnewline
29 & 0.00308 & 0.032 & 0.487264 \tabularnewline
30 & 0.058073 & 0.6035 & 0.273716 \tabularnewline
31 & -0.014326 & -0.1489 & 0.440963 \tabularnewline
32 & 0.071317 & 0.7411 & 0.230106 \tabularnewline
33 & 0.046181 & 0.4799 & 0.316125 \tabularnewline
34 & -0.088612 & -0.9209 & 0.179583 \tabularnewline
35 & 0.071493 & 0.743 & 0.229556 \tabularnewline
36 & 0.09269 & 0.9633 & 0.168785 \tabularnewline
37 & -0.005768 & -0.0599 & 0.476154 \tabularnewline
38 & -0.004588 & -0.0477 & 0.481031 \tabularnewline
39 & -0.233655 & -2.4282 & 0.008413 \tabularnewline
40 & 0.05472 & 0.5687 & 0.285383 \tabularnewline
41 & -0.087455 & -0.9089 & 0.182725 \tabularnewline
42 & -0.104994 & -1.0911 & 0.138821 \tabularnewline
43 & 0.046458 & 0.4828 & 0.315106 \tabularnewline
44 & 0.021159 & 0.2199 & 0.413185 \tabularnewline
45 & -0.055915 & -0.5811 & 0.281197 \tabularnewline
46 & -0.036833 & -0.3828 & 0.351318 \tabularnewline
47 & -0.085543 & -0.889 & 0.187991 \tabularnewline
48 & -0.003162 & -0.0329 & 0.486924 \tabularnewline
\hline
\end{tabular}
%Source: https://freestatistics.org/blog/index.php?pk=286345&T=2

[TABLE]
[ROW][C]Partial Autocorrelation Function[/C][/ROW]
[ROW][C]Time lag k[/C][C]PACF(k)[/C][C]T-STAT[/C][C]P-value[/C][/ROW]
[ROW][C]1[/C][C]0.966896[/C][C]10.0483[/C][C]0[/C][/ROW]
[ROW][C]2[/C][C]-0.236549[/C][C]-2.4583[/C][C]0.007775[/C][/ROW]
[ROW][C]3[/C][C]-0.036021[/C][C]-0.3743[/C][C]0.35444[/C][/ROW]
[ROW][C]4[/C][C]-0.32667[/C][C]-3.3949[/C][C]0.000481[/C][/ROW]
[ROW][C]5[/C][C]-0.02058[/C][C]-0.2139[/C][C]0.415526[/C][/ROW]
[ROW][C]6[/C][C]0.037917[/C][C]0.394[/C][C]0.347161[/C][/ROW]
[ROW][C]7[/C][C]0.081672[/C][C]0.8488[/C][C]0.198946[/C][/ROW]
[ROW][C]8[/C][C]-0.042919[/C][C]-0.446[/C][C]0.328235[/C][/ROW]
[ROW][C]9[/C][C]-0.038774[/C][C]-0.4029[/C][C]0.343891[/C][/ROW]
[ROW][C]10[/C][C]0.043405[/C][C]0.4511[/C][C]0.32642[/C][/ROW]
[ROW][C]11[/C][C]-0.0933[/C][C]-0.9696[/C][C]0.167207[/C][/ROW]
[ROW][C]12[/C][C]-0.004307[/C][C]-0.0448[/C][C]0.48219[/C][/ROW]
[ROW][C]13[/C][C]0.023387[/C][C]0.243[/C][C]0.404215[/C][/ROW]
[ROW][C]14[/C][C]-0.08195[/C][C]-0.8517[/C][C]0.198146[/C][/ROW]
[ROW][C]15[/C][C]-0.090015[/C][C]-0.9355[/C][C]0.175818[/C][/ROW]
[ROW][C]16[/C][C]0.156787[/C][C]1.6294[/C][C]0.053073[/C][/ROW]
[ROW][C]17[/C][C]0.013574[/C][C]0.1411[/C][C]0.444039[/C][/ROW]
[ROW][C]18[/C][C]0.044826[/C][C]0.4658[/C][C]0.321132[/C][/ROW]
[ROW][C]19[/C][C]0.033374[/C][C]0.3468[/C][C]0.364694[/C][/ROW]
[ROW][C]20[/C][C]0.020879[/C][C]0.217[/C][C]0.414317[/C][/ROW]
[ROW][C]21[/C][C]-0.024475[/C][C]-0.2544[/C][C]0.399854[/C][/ROW]
[ROW][C]22[/C][C]0.015301[/C][C]0.159[/C][C]0.436976[/C][/ROW]
[ROW][C]23[/C][C]-0.006087[/C][C]-0.0633[/C][C]0.474839[/C][/ROW]
[ROW][C]24[/C][C]-0.043695[/C][C]-0.4541[/C][C]0.325335[/C][/ROW]
[ROW][C]25[/C][C]0.004121[/C][C]0.0428[/C][C]0.482959[/C][/ROW]
[ROW][C]26[/C][C]-0.019024[/C][C]-0.1977[/C][C]0.421823[/C][/ROW]
[ROW][C]27[/C][C]-0.014307[/C][C]-0.1487[/C][C]0.441041[/C][/ROW]
[ROW][C]28[/C][C]0.034046[/C][C]0.3538[/C][C]0.362085[/C][/ROW]
[ROW][C]29[/C][C]0.00308[/C][C]0.032[/C][C]0.487264[/C][/ROW]
[ROW][C]30[/C][C]0.058073[/C][C]0.6035[/C][C]0.273716[/C][/ROW]
[ROW][C]31[/C][C]-0.014326[/C][C]-0.1489[/C][C]0.440963[/C][/ROW]
[ROW][C]32[/C][C]0.071317[/C][C]0.7411[/C][C]0.230106[/C][/ROW]
[ROW][C]33[/C][C]0.046181[/C][C]0.4799[/C][C]0.316125[/C][/ROW]
[ROW][C]34[/C][C]-0.088612[/C][C]-0.9209[/C][C]0.179583[/C][/ROW]
[ROW][C]35[/C][C]0.071493[/C][C]0.743[/C][C]0.229556[/C][/ROW]
[ROW][C]36[/C][C]0.09269[/C][C]0.9633[/C][C]0.168785[/C][/ROW]
[ROW][C]37[/C][C]-0.005768[/C][C]-0.0599[/C][C]0.476154[/C][/ROW]
[ROW][C]38[/C][C]-0.004588[/C][C]-0.0477[/C][C]0.481031[/C][/ROW]
[ROW][C]39[/C][C]-0.233655[/C][C]-2.4282[/C][C]0.008413[/C][/ROW]
[ROW][C]40[/C][C]0.05472[/C][C]0.5687[/C][C]0.285383[/C][/ROW]
[ROW][C]41[/C][C]-0.087455[/C][C]-0.9089[/C][C]0.182725[/C][/ROW]
[ROW][C]42[/C][C]-0.104994[/C][C]-1.0911[/C][C]0.138821[/C][/ROW]
[ROW][C]43[/C][C]0.046458[/C][C]0.4828[/C][C]0.315106[/C][/ROW]
[ROW][C]44[/C][C]0.021159[/C][C]0.2199[/C][C]0.413185[/C][/ROW]
[ROW][C]45[/C][C]-0.055915[/C][C]-0.5811[/C][C]0.281197[/C][/ROW]
[ROW][C]46[/C][C]-0.036833[/C][C]-0.3828[/C][C]0.351318[/C][/ROW]
[ROW][C]47[/C][C]-0.085543[/C][C]-0.889[/C][C]0.187991[/C][/ROW]
[ROW][C]48[/C][C]-0.003162[/C][C]-0.0329[/C][C]0.486924[/C][/ROW]
[/TABLE]
Source: https://freestatistics.org/blog/index.php?pk=286345&T=2

Globally Unique Identifier (entire table): ba.freestatistics.org/blog/index.php?pk=286345&T=2

As an alternative you can also use a QR Code:  

The GUIDs for individual cells are displayed in the table below:

Partial Autocorrelation Function
Time lag kPACF(k)T-STATP-value
10.96689610.04830
2-0.236549-2.45830.007775
3-0.036021-0.37430.35444
4-0.32667-3.39490.000481
5-0.02058-0.21390.415526
60.0379170.3940.347161
70.0816720.84880.198946
8-0.042919-0.4460.328235
9-0.038774-0.40290.343891
100.0434050.45110.32642
11-0.0933-0.96960.167207
12-0.004307-0.04480.48219
130.0233870.2430.404215
14-0.08195-0.85170.198146
15-0.090015-0.93550.175818
160.1567871.62940.053073
170.0135740.14110.444039
180.0448260.46580.321132
190.0333740.34680.364694
200.0208790.2170.414317
21-0.024475-0.25440.399854
220.0153010.1590.436976
23-0.006087-0.06330.474839
24-0.043695-0.45410.325335
250.0041210.04280.482959
26-0.019024-0.19770.421823
27-0.014307-0.14870.441041
280.0340460.35380.362085
290.003080.0320.487264
300.0580730.60350.273716
31-0.014326-0.14890.440963
320.0713170.74110.230106
330.0461810.47990.316125
34-0.088612-0.92090.179583
350.0714930.7430.229556
360.092690.96330.168785
37-0.005768-0.05990.476154
38-0.004588-0.04770.481031
39-0.233655-2.42820.008413
400.054720.56870.285383
41-0.087455-0.90890.182725
42-0.104994-1.09110.138821
430.0464580.48280.315106
440.0211590.21990.413185
45-0.055915-0.58110.281197
46-0.036833-0.38280.351318
47-0.085543-0.8890.187991
48-0.003162-0.03290.486924


Parameters (Session):
par1 = 48 ; par2 = 1 ; par3 = 0 ; par4 = 0 ; par5 = 12 ; par6 = White Noise ; par7 = 0.95 ;
Parameters (R input):
par1 = 48 ; par2 = 1 ; par3 = 0 ; par4 = 0 ; par5 = 12 ; par6 = White Noise ; par7 = 0.95 ; par8 = ;
R code (references can be found in the software module):
if (par1 == 'Default') {
par1 = 10*log10(length(x))
} else {
par1 <- as.numeric(par1)
}
par2 <- as.numeric(par2)
par3 <- as.numeric(par3)
par4 <- as.numeric(par4)
par5 <- as.numeric(par5)
if (par6 == 'White Noise') par6 <- 'white' else par6 <- 'ma'
par7 <- as.numeric(par7)
if (par8 != '') par8 <- as.numeric(par8)
x <- na.omit(x)
ox <- x
if (par8 == '') {
if (par2 == 0) {
x <- log(x)
} else {
x <- (x ^ par2 - 1) / par2
}
} else {
x <- log(x,base=par8)
}
if (par3 > 0) x <- diff(x,lag=1,difference=par3)
if (par4 > 0) x <- diff(x,lag=par5,difference=par4)
bitmap(file='picts.png')
op <- par(mfrow=c(2,1))
plot(ox,type='l',main='Original Time Series',xlab='time',ylab='value')
if (par8=='') {
mytitle <- paste('Working Time Series (lambda=',par2,', d=',par3,', D=',par4,')',sep='')
mysub <- paste('(lambda=',par2,', d=',par3,', D=',par4,', CI=', par7, ', CI type=',par6,')',sep='')
} else {
mytitle <- paste('Working Time Series (base=',par8,', d=',par3,', D=',par4,')',sep='')
mysub <- paste('(base=',par8,', d=',par3,', D=',par4,', CI=', par7, ', CI type=',par6,')',sep='')
}
plot(x,type='l', main=mytitle,xlab='time',ylab='value')
par(op)
dev.off()
bitmap(file='pic1.png')
racf <- acf(x, par1, main='Autocorrelation', xlab='time lag', ylab='ACF', ci.type=par6, ci=par7, sub=mysub)
dev.off()
bitmap(file='pic2.png')
rpacf <- pacf(x,par1,main='Partial Autocorrelation',xlab='lags',ylab='PACF',sub=mysub)
dev.off()
(myacf <- c(racf$acf))
(mypacf <- c(rpacf$acf))
lengthx <- length(x)
sqrtn <- sqrt(lengthx)
load(file='createtable')
a<-table.start()
a<-table.row.start(a)
a<-table.element(a,'Autocorrelation Function',4,TRUE)
a<-table.row.end(a)
a<-table.row.start(a)
a<-table.element(a,'Time lag k',header=TRUE)
a<-table.element(a,hyperlink('basics.htm','ACF(k)','click here for more information about the Autocorrelation Function'),header=TRUE)
a<-table.element(a,'T-STAT',header=TRUE)
a<-table.element(a,'P-value',header=TRUE)
a<-table.row.end(a)
for (i in 2:(par1+1)) {
a<-table.row.start(a)
a<-table.element(a,i-1,header=TRUE)
a<-table.element(a,round(myacf[i],6))
mytstat <- myacf[i]*sqrtn
a<-table.element(a,round(mytstat,4))
a<-table.element(a,round(1-pt(abs(mytstat),lengthx),6))
a<-table.row.end(a)
}
a<-table.end(a)
table.save(a,file='mytable.tab')
a<-table.start()
a<-table.row.start(a)
a<-table.element(a,'Partial Autocorrelation Function',4,TRUE)
a<-table.row.end(a)
a<-table.row.start(a)
a<-table.element(a,'Time lag k',header=TRUE)
a<-table.element(a,hyperlink('basics.htm','PACF(k)','click here for more information about the Partial Autocorrelation Function'),header=TRUE)
a<-table.element(a,'T-STAT',header=TRUE)
a<-table.element(a,'P-value',header=TRUE)
a<-table.row.end(a)
for (i in 1:par1) {
a<-table.row.start(a)
a<-table.element(a,i,header=TRUE)
a<-table.element(a,round(mypacf[i],6))
mytstat <- mypacf[i]*sqrtn
a<-table.element(a,round(mytstat,4))
a<-table.element(a,round(1-pt(abs(mytstat),lengthx),6))
a<-table.row.end(a)
}
a<-table.end(a)
table.save(a,file='mytable1.tab')