Free Statistics

of Irreproducible Research!

Author's title

Author*The author of this computation has been verified*
R Software Modulerwasp_autocorrelation.wasp
Title produced by software(Partial) Autocorrelation Function
Date of computationMon, 14 Dec 2015 18:18:02 +0000
Cite this page as followsStatistical Computations at FreeStatistics.org, Office for Research Development and Education, URL https://freestatistics.org/blog/index.php?v=date/2015/Dec/14/t145011709933ce4nrpl51oppd.htm/, Retrieved Thu, 16 May 2024 16:26:34 +0000
Statistical Computations at FreeStatistics.org, Office for Research Development and Education, URL https://freestatistics.org/blog/index.php?pk=286367, Retrieved Thu, 16 May 2024 16:26:34 +0000
QR Codes:

Original text written by user:
IsPrivate?No (this computation is public)
User-defined keywords
Estimated Impact71
Family? (F = Feedback message, R = changed R code, M = changed R Module, P = changed Parameters, D = changed Data)
-       [(Partial) Autocorrelation Function] [Autocorrelation S...] [2015-12-14 18:18:02] [07325d4e03e5d5deea478d79524d9715] [Current]
Feedback Forum

Post a new message
Dataseries X:
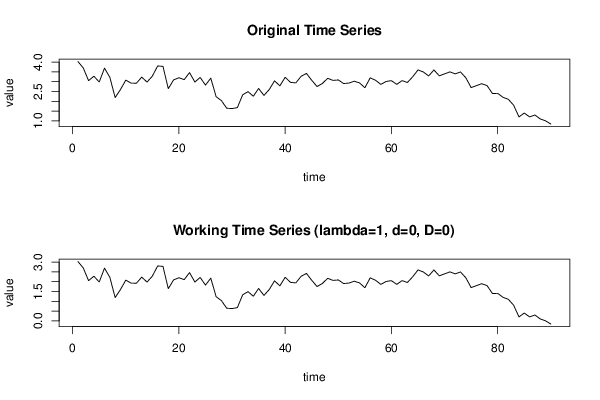
4.031636
3.702076
3.056176
3.280707
2.984728
3.693712
3.226317
2.190349
2.599515
3.080288
2.929672
2.922548
3.234943
2.983081
3.284389
3.806511
3.784579
2.645654
3.092081
3.204859
3.107225
3.466909
2.984404
3.218072
2.82731
3.182049
2.236319
2.033218
1.644804
1.627971
1.677559
2.330828
2.493615
2.257172
2.655517
2.298655
2.600402
3.04523
2.790583
3.227052
2.967479
2.938817
3.277961
3.423985
3.072646
2.754253
2.910431
3.174369
3.068387
3.089543
2.906654
2.931161
3.02566
2.939551
2.691019
3.19812
3.07639
2.863873
3.013802
3.053364
2.864753
3.057062
2.959365
3.252258
3.602988
3.497704
3.296867
3.602417
3.3001
3.40193
3.502591
3.402348
3.498551
3.199823
2.700064
2.801034
2.898628
2.800854
2.399942
2.402724
2.202331
2.102594
1.798293
1.202484
1.400201
1.200832
1.298083
1.099742
1.001377
0.8361743


Summary of computational transaction
Raw Inputview raw input (R code)
Raw Outputview raw output of R engine
Computing time1 seconds
R Server'Gwilym Jenkins' @ jenkins.wessa.net

\begin{tabular}{lllllllll}
\hline
Summary of computational transaction \tabularnewline
Raw Input & view raw input (R code)  \tabularnewline
Raw Output & view raw output of R engine  \tabularnewline
Computing time & 1 seconds \tabularnewline
R Server & 'Gwilym Jenkins' @ jenkins.wessa.net \tabularnewline
\hline
\end{tabular}
%Source: https://freestatistics.org/blog/index.php?pk=286367&T=0

[TABLE]
[ROW][C]Summary of computational transaction[/C][/ROW]
[ROW][C]Raw Input[/C][C]view raw input (R code) [/C][/ROW]
[ROW][C]Raw Output[/C][C]view raw output of R engine [/C][/ROW]
[ROW][C]Computing time[/C][C]1 seconds[/C][/ROW]
[ROW][C]R Server[/C][C]'Gwilym Jenkins' @ jenkins.wessa.net[/C][/ROW]
[/TABLE]
Source: https://freestatistics.org/blog/index.php?pk=286367&T=0

Globally Unique Identifier (entire table): ba.freestatistics.org/blog/index.php?pk=286367&T=0

As an alternative you can also use a QR Code:  

The GUIDs for individual cells are displayed in the table below:

Summary of computational transaction
Raw Inputview raw input (R code)
Raw Outputview raw output of R engine
Computing time1 seconds
R Server'Gwilym Jenkins' @ jenkins.wessa.net


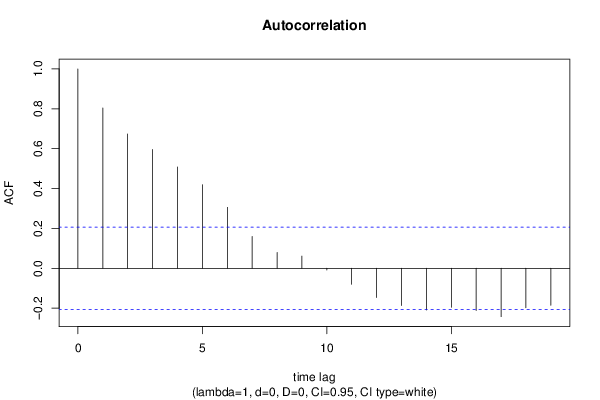
Autocorrelation Function
Time lag kACF(k)T-STATP-value
10.8039417.62690
20.6739836.3940
30.5960625.65470
40.5078164.81763e-06
50.4191023.9767.1e-05
60.3055892.89910.002351
70.1595521.51360.06681
80.0793120.75240.22688
90.0611040.57970.281787
10-0.009155-0.08680.465492
11-0.080281-0.76160.224141
12-0.146893-1.39360.083442
13-0.187019-1.77420.039705
14-0.209324-1.98580.025048
15-0.195477-1.85450.033474
16-0.211873-2.010.023713
17-0.242827-2.30370.011772
18-0.198215-1.88040.031641
19-0.185892-1.76350.040603

\begin{tabular}{lllllllll}
\hline
Autocorrelation Function \tabularnewline
Time lag k & ACF(k) & T-STAT & P-value \tabularnewline
1 & 0.803941 & 7.6269 & 0 \tabularnewline
2 & 0.673983 & 6.394 & 0 \tabularnewline
3 & 0.596062 & 5.6547 & 0 \tabularnewline
4 & 0.507816 & 4.8176 & 3e-06 \tabularnewline
5 & 0.419102 & 3.976 & 7.1e-05 \tabularnewline
6 & 0.305589 & 2.8991 & 0.002351 \tabularnewline
7 & 0.159552 & 1.5136 & 0.06681 \tabularnewline
8 & 0.079312 & 0.7524 & 0.22688 \tabularnewline
9 & 0.061104 & 0.5797 & 0.281787 \tabularnewline
10 & -0.009155 & -0.0868 & 0.465492 \tabularnewline
11 & -0.080281 & -0.7616 & 0.224141 \tabularnewline
12 & -0.146893 & -1.3936 & 0.083442 \tabularnewline
13 & -0.187019 & -1.7742 & 0.039705 \tabularnewline
14 & -0.209324 & -1.9858 & 0.025048 \tabularnewline
15 & -0.195477 & -1.8545 & 0.033474 \tabularnewline
16 & -0.211873 & -2.01 & 0.023713 \tabularnewline
17 & -0.242827 & -2.3037 & 0.011772 \tabularnewline
18 & -0.198215 & -1.8804 & 0.031641 \tabularnewline
19 & -0.185892 & -1.7635 & 0.040603 \tabularnewline
\hline
\end{tabular}
%Source: https://freestatistics.org/blog/index.php?pk=286367&T=1

[TABLE]
[ROW][C]Autocorrelation Function[/C][/ROW]
[ROW][C]Time lag k[/C][C]ACF(k)[/C][C]T-STAT[/C][C]P-value[/C][/ROW]
[ROW][C]1[/C][C]0.803941[/C][C]7.6269[/C][C]0[/C][/ROW]
[ROW][C]2[/C][C]0.673983[/C][C]6.394[/C][C]0[/C][/ROW]
[ROW][C]3[/C][C]0.596062[/C][C]5.6547[/C][C]0[/C][/ROW]
[ROW][C]4[/C][C]0.507816[/C][C]4.8176[/C][C]3e-06[/C][/ROW]
[ROW][C]5[/C][C]0.419102[/C][C]3.976[/C][C]7.1e-05[/C][/ROW]
[ROW][C]6[/C][C]0.305589[/C][C]2.8991[/C][C]0.002351[/C][/ROW]
[ROW][C]7[/C][C]0.159552[/C][C]1.5136[/C][C]0.06681[/C][/ROW]
[ROW][C]8[/C][C]0.079312[/C][C]0.7524[/C][C]0.22688[/C][/ROW]
[ROW][C]9[/C][C]0.061104[/C][C]0.5797[/C][C]0.281787[/C][/ROW]
[ROW][C]10[/C][C]-0.009155[/C][C]-0.0868[/C][C]0.465492[/C][/ROW]
[ROW][C]11[/C][C]-0.080281[/C][C]-0.7616[/C][C]0.224141[/C][/ROW]
[ROW][C]12[/C][C]-0.146893[/C][C]-1.3936[/C][C]0.083442[/C][/ROW]
[ROW][C]13[/C][C]-0.187019[/C][C]-1.7742[/C][C]0.039705[/C][/ROW]
[ROW][C]14[/C][C]-0.209324[/C][C]-1.9858[/C][C]0.025048[/C][/ROW]
[ROW][C]15[/C][C]-0.195477[/C][C]-1.8545[/C][C]0.033474[/C][/ROW]
[ROW][C]16[/C][C]-0.211873[/C][C]-2.01[/C][C]0.023713[/C][/ROW]
[ROW][C]17[/C][C]-0.242827[/C][C]-2.3037[/C][C]0.011772[/C][/ROW]
[ROW][C]18[/C][C]-0.198215[/C][C]-1.8804[/C][C]0.031641[/C][/ROW]
[ROW][C]19[/C][C]-0.185892[/C][C]-1.7635[/C][C]0.040603[/C][/ROW]
[/TABLE]
Source: https://freestatistics.org/blog/index.php?pk=286367&T=1

Globally Unique Identifier (entire table): ba.freestatistics.org/blog/index.php?pk=286367&T=1

As an alternative you can also use a QR Code:  

The GUIDs for individual cells are displayed in the table below:

Autocorrelation Function
Time lag kACF(k)T-STATP-value
10.8039417.62690
20.6739836.3940
30.5960625.65470
40.5078164.81763e-06
50.4191023.9767.1e-05
60.3055892.89910.002351
70.1595521.51360.06681
80.0793120.75240.22688
90.0611040.57970.281787
10-0.009155-0.08680.465492
11-0.080281-0.76160.224141
12-0.146893-1.39360.083442
13-0.187019-1.77420.039705
14-0.209324-1.98580.025048
15-0.195477-1.85450.033474
16-0.211873-2.010.023713
17-0.242827-2.30370.011772
18-0.198215-1.88040.031641
19-0.185892-1.76350.040603


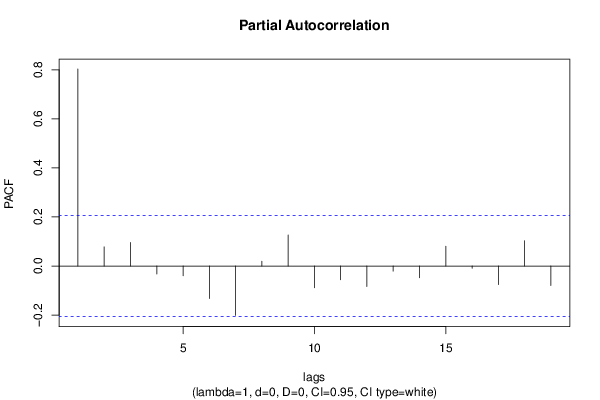
Partial Autocorrelation Function
Time lag kPACF(k)T-STATP-value
10.8039417.62690
20.0782120.7420.230015
30.0959260.910.182619
4-0.032596-0.30920.378931
5-0.040089-0.38030.352303
6-0.132718-1.25910.105631
7-0.201543-1.9120.029528
80.0198040.18790.425699
90.1267131.20210.116238
10-0.088991-0.84420.200387
11-0.056046-0.53170.298121
12-0.083936-0.79630.21398
13-0.020984-0.19910.421327
14-0.048119-0.45650.324568
150.0809780.76820.222183
16-0.009021-0.08560.465994
17-0.075853-0.71960.236817
180.1029960.97710.165569
19-0.079762-0.75670.225605

\begin{tabular}{lllllllll}
\hline
Partial Autocorrelation Function \tabularnewline
Time lag k & PACF(k) & T-STAT & P-value \tabularnewline
1 & 0.803941 & 7.6269 & 0 \tabularnewline
2 & 0.078212 & 0.742 & 0.230015 \tabularnewline
3 & 0.095926 & 0.91 & 0.182619 \tabularnewline
4 & -0.032596 & -0.3092 & 0.378931 \tabularnewline
5 & -0.040089 & -0.3803 & 0.352303 \tabularnewline
6 & -0.132718 & -1.2591 & 0.105631 \tabularnewline
7 & -0.201543 & -1.912 & 0.029528 \tabularnewline
8 & 0.019804 & 0.1879 & 0.425699 \tabularnewline
9 & 0.126713 & 1.2021 & 0.116238 \tabularnewline
10 & -0.088991 & -0.8442 & 0.200387 \tabularnewline
11 & -0.056046 & -0.5317 & 0.298121 \tabularnewline
12 & -0.083936 & -0.7963 & 0.21398 \tabularnewline
13 & -0.020984 & -0.1991 & 0.421327 \tabularnewline
14 & -0.048119 & -0.4565 & 0.324568 \tabularnewline
15 & 0.080978 & 0.7682 & 0.222183 \tabularnewline
16 & -0.009021 & -0.0856 & 0.465994 \tabularnewline
17 & -0.075853 & -0.7196 & 0.236817 \tabularnewline
18 & 0.102996 & 0.9771 & 0.165569 \tabularnewline
19 & -0.079762 & -0.7567 & 0.225605 \tabularnewline
\hline
\end{tabular}
%Source: https://freestatistics.org/blog/index.php?pk=286367&T=2

[TABLE]
[ROW][C]Partial Autocorrelation Function[/C][/ROW]
[ROW][C]Time lag k[/C][C]PACF(k)[/C][C]T-STAT[/C][C]P-value[/C][/ROW]
[ROW][C]1[/C][C]0.803941[/C][C]7.6269[/C][C]0[/C][/ROW]
[ROW][C]2[/C][C]0.078212[/C][C]0.742[/C][C]0.230015[/C][/ROW]
[ROW][C]3[/C][C]0.095926[/C][C]0.91[/C][C]0.182619[/C][/ROW]
[ROW][C]4[/C][C]-0.032596[/C][C]-0.3092[/C][C]0.378931[/C][/ROW]
[ROW][C]5[/C][C]-0.040089[/C][C]-0.3803[/C][C]0.352303[/C][/ROW]
[ROW][C]6[/C][C]-0.132718[/C][C]-1.2591[/C][C]0.105631[/C][/ROW]
[ROW][C]7[/C][C]-0.201543[/C][C]-1.912[/C][C]0.029528[/C][/ROW]
[ROW][C]8[/C][C]0.019804[/C][C]0.1879[/C][C]0.425699[/C][/ROW]
[ROW][C]9[/C][C]0.126713[/C][C]1.2021[/C][C]0.116238[/C][/ROW]
[ROW][C]10[/C][C]-0.088991[/C][C]-0.8442[/C][C]0.200387[/C][/ROW]
[ROW][C]11[/C][C]-0.056046[/C][C]-0.5317[/C][C]0.298121[/C][/ROW]
[ROW][C]12[/C][C]-0.083936[/C][C]-0.7963[/C][C]0.21398[/C][/ROW]
[ROW][C]13[/C][C]-0.020984[/C][C]-0.1991[/C][C]0.421327[/C][/ROW]
[ROW][C]14[/C][C]-0.048119[/C][C]-0.4565[/C][C]0.324568[/C][/ROW]
[ROW][C]15[/C][C]0.080978[/C][C]0.7682[/C][C]0.222183[/C][/ROW]
[ROW][C]16[/C][C]-0.009021[/C][C]-0.0856[/C][C]0.465994[/C][/ROW]
[ROW][C]17[/C][C]-0.075853[/C][C]-0.7196[/C][C]0.236817[/C][/ROW]
[ROW][C]18[/C][C]0.102996[/C][C]0.9771[/C][C]0.165569[/C][/ROW]
[ROW][C]19[/C][C]-0.079762[/C][C]-0.7567[/C][C]0.225605[/C][/ROW]
[/TABLE]
Source: https://freestatistics.org/blog/index.php?pk=286367&T=2

Globally Unique Identifier (entire table): ba.freestatistics.org/blog/index.php?pk=286367&T=2

As an alternative you can also use a QR Code:  

The GUIDs for individual cells are displayed in the table below:

Partial Autocorrelation Function
Time lag kPACF(k)T-STATP-value
10.8039417.62690
20.0782120.7420.230015
30.0959260.910.182619
4-0.032596-0.30920.378931
5-0.040089-0.38030.352303
6-0.132718-1.25910.105631
7-0.201543-1.9120.029528
80.0198040.18790.425699
90.1267131.20210.116238
10-0.088991-0.84420.200387
11-0.056046-0.53170.298121
12-0.083936-0.79630.21398
13-0.020984-0.19910.421327
14-0.048119-0.45650.324568
150.0809780.76820.222183
16-0.009021-0.08560.465994
17-0.075853-0.71960.236817
180.1029960.97710.165569
19-0.079762-0.75670.225605


Parameters (Session):
par1 = Default ; par2 = 1 ; par3 = 0 ; par4 = 0 ; par5 = 12 ; par6 = White Noise ; par7 = 0.95 ;
Parameters (R input):
par1 = Default ; par2 = 1 ; par3 = 0 ; par4 = 0 ; par5 = 12 ; par6 = White Noise ; par7 = 0.95 ; par8 = ;
R code (references can be found in the software module):
if (par1 == 'Default') {
par1 = 10*log10(length(x))
} else {
par1 <- as.numeric(par1)
}
par2 <- as.numeric(par2)
par3 <- as.numeric(par3)
par4 <- as.numeric(par4)
par5 <- as.numeric(par5)
if (par6 == 'White Noise') par6 <- 'white' else par6 <- 'ma'
par7 <- as.numeric(par7)
if (par8 != '') par8 <- as.numeric(par8)
x <- na.omit(x)
ox <- x
if (par8 == '') {
if (par2 == 0) {
x <- log(x)
} else {
x <- (x ^ par2 - 1) / par2
}
} else {
x <- log(x,base=par8)
}
if (par3 > 0) x <- diff(x,lag=1,difference=par3)
if (par4 > 0) x <- diff(x,lag=par5,difference=par4)
bitmap(file='picts.png')
op <- par(mfrow=c(2,1))
plot(ox,type='l',main='Original Time Series',xlab='time',ylab='value')
if (par8=='') {
mytitle <- paste('Working Time Series (lambda=',par2,', d=',par3,', D=',par4,')',sep='')
mysub <- paste('(lambda=',par2,', d=',par3,', D=',par4,', CI=', par7, ', CI type=',par6,')',sep='')
} else {
mytitle <- paste('Working Time Series (base=',par8,', d=',par3,', D=',par4,')',sep='')
mysub <- paste('(base=',par8,', d=',par3,', D=',par4,', CI=', par7, ', CI type=',par6,')',sep='')
}
plot(x,type='l', main=mytitle,xlab='time',ylab='value')
par(op)
dev.off()
bitmap(file='pic1.png')
racf <- acf(x, par1, main='Autocorrelation', xlab='time lag', ylab='ACF', ci.type=par6, ci=par7, sub=mysub)
dev.off()
bitmap(file='pic2.png')
rpacf <- pacf(x,par1,main='Partial Autocorrelation',xlab='lags',ylab='PACF',sub=mysub)
dev.off()
(myacf <- c(racf$acf))
(mypacf <- c(rpacf$acf))
lengthx <- length(x)
sqrtn <- sqrt(lengthx)
load(file='createtable')
a<-table.start()
a<-table.row.start(a)
a<-table.element(a,'Autocorrelation Function',4,TRUE)
a<-table.row.end(a)
a<-table.row.start(a)
a<-table.element(a,'Time lag k',header=TRUE)
a<-table.element(a,hyperlink('basics.htm','ACF(k)','click here for more information about the Autocorrelation Function'),header=TRUE)
a<-table.element(a,'T-STAT',header=TRUE)
a<-table.element(a,'P-value',header=TRUE)
a<-table.row.end(a)
for (i in 2:(par1+1)) {
a<-table.row.start(a)
a<-table.element(a,i-1,header=TRUE)
a<-table.element(a,round(myacf[i],6))
mytstat <- myacf[i]*sqrtn
a<-table.element(a,round(mytstat,4))
a<-table.element(a,round(1-pt(abs(mytstat),lengthx),6))
a<-table.row.end(a)
}
a<-table.end(a)
table.save(a,file='mytable.tab')
a<-table.start()
a<-table.row.start(a)
a<-table.element(a,'Partial Autocorrelation Function',4,TRUE)
a<-table.row.end(a)
a<-table.row.start(a)
a<-table.element(a,'Time lag k',header=TRUE)
a<-table.element(a,hyperlink('basics.htm','PACF(k)','click here for more information about the Partial Autocorrelation Function'),header=TRUE)
a<-table.element(a,'T-STAT',header=TRUE)
a<-table.element(a,'P-value',header=TRUE)
a<-table.row.end(a)
for (i in 1:par1) {
a<-table.row.start(a)
a<-table.element(a,i,header=TRUE)
a<-table.element(a,round(mypacf[i],6))
mytstat <- mypacf[i]*sqrtn
a<-table.element(a,round(mytstat,4))
a<-table.element(a,round(1-pt(abs(mytstat),lengthx),6))
a<-table.row.end(a)
}
a<-table.end(a)
table.save(a,file='mytable1.tab')