Free Statistics

of Irreproducible Research!

Author's title

Author*The author of this computation has been verified*
R Software Modulerwasp_edauni.wasp
Title produced by softwareUnivariate Explorative Data Analysis
Date of computationMon, 14 Dec 2015 18:39:28 +0000
Cite this page as followsStatistical Computations at FreeStatistics.org, Office for Research Development and Education, URL https://freestatistics.org/blog/index.php?v=date/2015/Dec/14/t1450118410zrhxjwftlundx6s.htm/, Retrieved Thu, 16 May 2024 14:46:02 +0000
Statistical Computations at FreeStatistics.org, Office for Research Development and Education, URL https://freestatistics.org/blog/index.php?pk=286374, Retrieved Thu, 16 May 2024 14:46:02 +0000
QR Codes:

Original text written by user:
IsPrivate?No (this computation is public)
User-defined keywords
Estimated Impact64
Family? (F = Feedback message, R = changed R code, M = changed R Module, P = changed Parameters, D = changed Data)
-       [Univariate Explorative Data Analysis] [] [2015-12-14 18:39:28] [8ba356a4616aa2ff32c82bd617b07931] [Current]
Feedback Forum

Post a new message
Dataseries X:
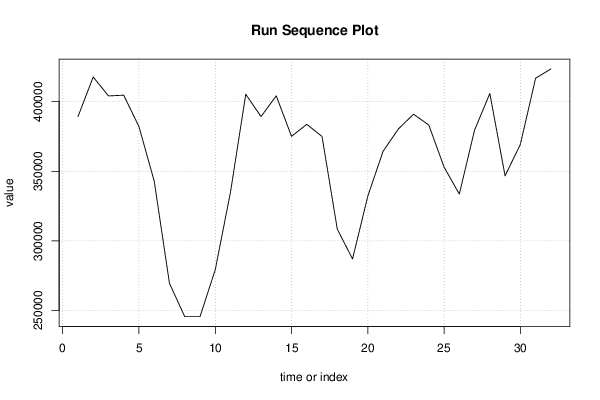
389209
417715.1
404111.1
404640.2
382046.5
342862.4
269440.2
245567.7
245555.8
279248
335025.5
405310.9
389292.3
404187.1
375080.4
383723.7
374991.33152081
308449.53374478
287001.09152751
332070.6175
364306.6432903
380321.15202656
390992.25716633
383199.53159502
353004.90968947
333659.78078553
379586.79498549
405881.34656505
346697.73349159
369273.09717268
416809.32619049
423493.39006554


Summary of computational transaction
Raw Inputview raw input (R code)
Raw Outputview raw output of R engine
Computing time2 seconds
R Server'George Udny Yule' @ yule.wessa.net

\begin{tabular}{lllllllll}
\hline
Summary of computational transaction \tabularnewline
Raw Input & view raw input (R code)  \tabularnewline
Raw Output & view raw output of R engine  \tabularnewline
Computing time & 2 seconds \tabularnewline
R Server & 'George Udny Yule' @ yule.wessa.net \tabularnewline
\hline
\end{tabular}
%Source: https://freestatistics.org/blog/index.php?pk=286374&T=0

[TABLE]
[ROW][C]Summary of computational transaction[/C][/ROW]
[ROW][C]Raw Input[/C][C]view raw input (R code) [/C][/ROW]
[ROW][C]Raw Output[/C][C]view raw output of R engine [/C][/ROW]
[ROW][C]Computing time[/C][C]2 seconds[/C][/ROW]
[ROW][C]R Server[/C][C]'George Udny Yule' @ yule.wessa.net[/C][/ROW]
[/TABLE]
Source: https://freestatistics.org/blog/index.php?pk=286374&T=0

Globally Unique Identifier (entire table): ba.freestatistics.org/blog/index.php?pk=286374&T=0

As an alternative you can also use a QR Code:  

The GUIDs for individual cells are displayed in the table below:

Summary of computational transaction
Raw Inputview raw input (R code)
Raw Outputview raw output of R engine
Computing time2 seconds
R Server'George Udny Yule' @ yule.wessa.net


Descriptive Statistics
# observations32
minimum245555.8
Q1334684.070196382
median377333.597492745
mean360086.076166161
Q3394271.967874747
maximum423493.39006554

\begin{tabular}{lllllllll}
\hline
Descriptive Statistics \tabularnewline
# observations & 32 \tabularnewline
minimum & 245555.8 \tabularnewline
Q1 & 334684.070196382 \tabularnewline
median & 377333.597492745 \tabularnewline
mean & 360086.076166161 \tabularnewline
Q3 & 394271.967874747 \tabularnewline
maximum & 423493.39006554 \tabularnewline
\hline
\end{tabular}
%Source: https://freestatistics.org/blog/index.php?pk=286374&T=1

[TABLE]
[ROW][C]Descriptive Statistics[/C][/ROW]
[ROW][C]# observations[/C][C]32[/C][/ROW]
[ROW][C]minimum[/C][C]245555.8[/C][/ROW]
[ROW][C]Q1[/C][C]334684.070196382[/C][/ROW]
[ROW][C]median[/C][C]377333.597492745[/C][/ROW]
[ROW][C]mean[/C][C]360086.076166161[/C][/ROW]
[ROW][C]Q3[/C][C]394271.967874747[/C][/ROW]
[ROW][C]maximum[/C][C]423493.39006554[/C][/ROW]
[/TABLE]
Source: https://freestatistics.org/blog/index.php?pk=286374&T=1

Globally Unique Identifier (entire table): ba.freestatistics.org/blog/index.php?pk=286374&T=1

As an alternative you can also use a QR Code:  

The GUIDs for individual cells are displayed in the table below:

Descriptive Statistics
# observations32
minimum245555.8
Q1334684.070196382
median377333.597492745
mean360086.076166161
Q3394271.967874747
maximum423493.39006554


Parameters (Session):
par1 = 0 ; par2 = 0 ;
Parameters (R input):
par1 = 0 ; par2 = 0 ;
R code (references can be found in the software module):
par1 <- as.numeric(par1)
par2 <- as.numeric(par2)
x <- as.ts(x)
library(lattice)
bitmap(file='pic1.png')
plot(x,type='l',main='Run Sequence Plot',xlab='time or index',ylab='value')
grid()
dev.off()
bitmap(file='pic2.png')
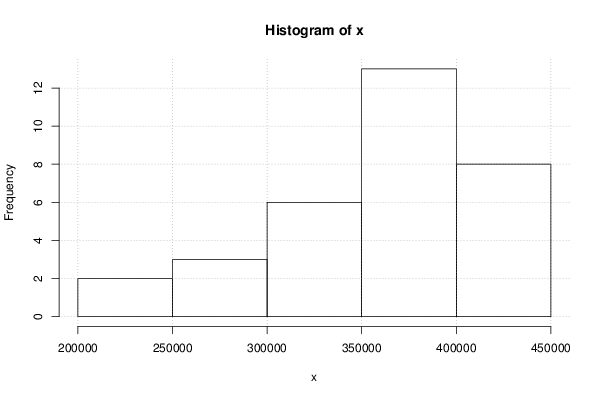
hist(x)
grid()
dev.off()
bitmap(file='pic3.png')
if (par1 > 0)
{
densityplot(~x,col='black',main=paste('Density Plot bw = ',par1),bw=par1)
} else {
densityplot(~x,col='black',main='Density Plot')
}
dev.off()
bitmap(file='pic4.png')
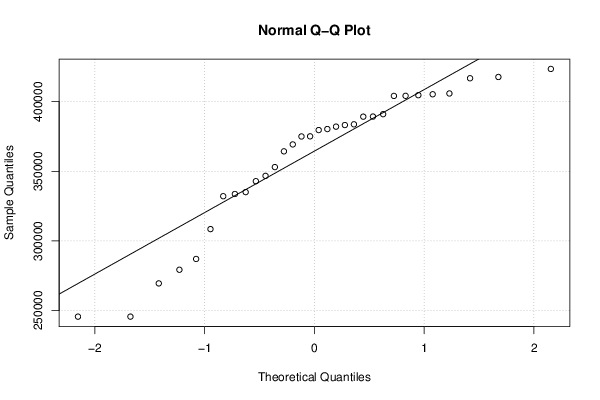
qqnorm(x)
qqline(x)
grid()
dev.off()
if (par2 > 0)
{
bitmap(file='lagplot1.png')
dum <- cbind(lag(x,k=1),x)
dum
dum1 <- dum[2:length(x),]
dum1
z <- as.data.frame(dum1)
z
plot(z,main='Lag plot (k=1), lowess, and regression line')
lines(lowess(z))
abline(lm(z))
dev.off()
if (par2 > 1) {
bitmap(file='lagplotpar2.png')
dum <- cbind(lag(x,k=par2),x)
dum
dum1 <- dum[(par2+1):length(x),]
dum1
z <- as.data.frame(dum1)
z
mylagtitle <- 'Lag plot (k='
mylagtitle <- paste(mylagtitle,par2,sep='')
mylagtitle <- paste(mylagtitle,'), and lowess',sep='')
plot(z,main=mylagtitle)
lines(lowess(z))
dev.off()
}
bitmap(file='pic5.png')
acf(x,lag.max=par2,main='Autocorrelation Function')
grid()
dev.off()
}
summary(x)
load(file='createtable')
a<-table.start()
a<-table.row.start(a)
a<-table.element(a,'Descriptive Statistics',2,TRUE)
a<-table.row.end(a)
a<-table.row.start(a)
a<-table.element(a,'# observations',header=TRUE)
a<-table.element(a,length(x))
a<-table.row.end(a)
a<-table.row.start(a)
a<-table.element(a,'minimum',header=TRUE)
a<-table.element(a,min(x))
a<-table.row.end(a)
a<-table.row.start(a)
a<-table.element(a,'Q1',header=TRUE)
a<-table.element(a,quantile(x,0.25))
a<-table.row.end(a)
a<-table.row.start(a)
a<-table.element(a,'median',header=TRUE)
a<-table.element(a,median(x))
a<-table.row.end(a)
a<-table.row.start(a)
a<-table.element(a,'mean',header=TRUE)
a<-table.element(a,mean(x))
a<-table.row.end(a)
a<-table.row.start(a)
a<-table.element(a,'Q3',header=TRUE)
a<-table.element(a,quantile(x,0.75))
a<-table.row.end(a)
a<-table.row.start(a)
a<-table.element(a,'maximum',header=TRUE)
a<-table.element(a,max(x))
a<-table.row.end(a)
a<-table.end(a)
table.save(a,file='mytable.tab')