Free Statistics

of Irreproducible Research!

Author's title

Author*The author of this computation has been verified*
R Software Modulerwasp_correlation.wasp
Title produced by softwarePearson Correlation
Date of computationMon, 14 Dec 2015 20:32:26 +0000
Cite this page as followsStatistical Computations at FreeStatistics.org, Office for Research Development and Education, URL https://freestatistics.org/blog/index.php?v=date/2015/Dec/14/t1450125559raj6dk8xwuz09qh.htm/, Retrieved Thu, 16 May 2024 12:18:32 +0000
Statistical Computations at FreeStatistics.org, Office for Research Development and Education, URL https://freestatistics.org/blog/index.php?pk=286400, Retrieved Thu, 16 May 2024 12:18:32 +0000
QR Codes:

Original text written by user:
IsPrivate?No (this computation is public)
User-defined keywords
Estimated Impact67
Family? (F = Feedback message, R = changed R code, M = changed R Module, P = changed Parameters, D = changed Data)
-       [Pearson Correlation] [paper16] [2015-12-14 20:32:26] [1e67203134127d491eaf7d256835640d] [Current]
Feedback Forum

Post a new message
Dataseries X:
242961
273849
273528
245372
217615
208888
187797
167503
161264
177969
199128
237538
257043
259605
255538
249583
237399
224687
208658
210871
228047
253089
271250
279551
278778
253214
242542
281133
290200
277630
289492
306752
315256
Dataseries Y:
292068
315646
321514
312051
299146
291957
271628
251801
241526
251527
273778
312201
331634
337268
332714
320463
303648
282945
265768
258868
263434
285052
305363
316846
309483
279245
262323
273396
276992
268843
270875
277550
282518


Summary of computational transaction
Raw Inputview raw input (R code)
Raw Outputview raw output of R engine
Computing time3 seconds
R Server'Sir Maurice George Kendall' @ kendall.wessa.net

\begin{tabular}{lllllllll}
\hline
Summary of computational transaction \tabularnewline
Raw Input & view raw input (R code)  \tabularnewline
Raw Output & view raw output of R engine  \tabularnewline
Computing time & 3 seconds \tabularnewline
R Server & 'Sir Maurice George Kendall' @ kendall.wessa.net \tabularnewline
\hline
\end{tabular}
%Source: https://freestatistics.org/blog/index.php?pk=286400&T=0

[TABLE]
[ROW][C]Summary of computational transaction[/C][/ROW]
[ROW][C]Raw Input[/C][C]view raw input (R code) [/C][/ROW]
[ROW][C]Raw Output[/C][C]view raw output of R engine [/C][/ROW]
[ROW][C]Computing time[/C][C]3 seconds[/C][/ROW]
[ROW][C]R Server[/C][C]'Sir Maurice George Kendall' @ kendall.wessa.net[/C][/ROW]
[/TABLE]
Source: https://freestatistics.org/blog/index.php?pk=286400&T=0

Globally Unique Identifier (entire table): ba.freestatistics.org/blog/index.php?pk=286400&T=0

As an alternative you can also use a QR Code:  

The GUIDs for individual cells are displayed in the table below:

Summary of computational transaction
Raw Inputview raw input (R code)
Raw Outputview raw output of R engine
Computing time3 seconds
R Server'Sir Maurice George Kendall' @ kendall.wessa.net


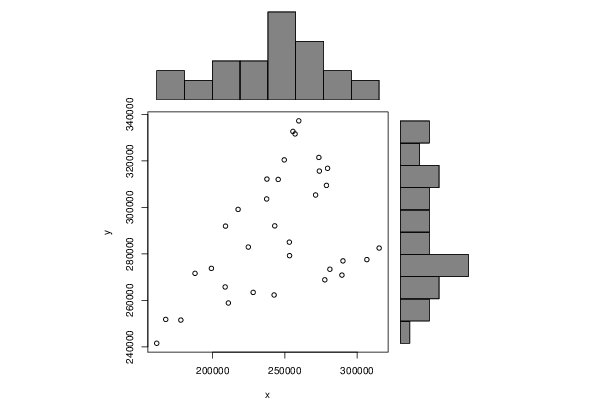
Pearson Product Moment Correlation - Ungrouped Data
StatisticVariable XVariable Y
Mean244355.454545455289093.060606061
Biased Variance1474910006.97521651951893.208448
Biased Standard Deviation38404.557112082525533.3486485507
Covariance457799609.346591
Correlation0.452710867115501
Determination0.204947129204469
T-Test2.82685649102875
p-value (2 sided)0.00815916589908827
p-value (1 sided)0.00407958294954414
95% CI of Correlation[0.129534008393334, 0.688944333237892]
Degrees of Freedom31
Number of Observations33

\begin{tabular}{lllllllll}
\hline
Pearson Product Moment Correlation - Ungrouped Data \tabularnewline
Statistic & Variable X & Variable Y \tabularnewline
Mean & 244355.454545455 & 289093.060606061 \tabularnewline
Biased Variance & 1474910006.97521 & 651951893.208448 \tabularnewline
Biased Standard Deviation & 38404.5571120825 & 25533.3486485507 \tabularnewline
Covariance & 457799609.346591 \tabularnewline
Correlation & 0.452710867115501 \tabularnewline
Determination & 0.204947129204469 \tabularnewline
T-Test & 2.82685649102875 \tabularnewline
p-value (2 sided) & 0.00815916589908827 \tabularnewline
p-value (1 sided) & 0.00407958294954414 \tabularnewline
95% CI of Correlation & [0.129534008393334, 0.688944333237892] \tabularnewline
Degrees of Freedom & 31 \tabularnewline
Number of Observations & 33 \tabularnewline
\hline
\end{tabular}
%Source: https://freestatistics.org/blog/index.php?pk=286400&T=1

[TABLE]
[ROW][C]Pearson Product Moment Correlation - Ungrouped Data[/C][/ROW]
[ROW][C]Statistic[/C][C]Variable X[/C][C]Variable Y[/C][/ROW]
[ROW][C]Mean[/C][C]244355.454545455[/C][C]289093.060606061[/C][/ROW]
[ROW][C]Biased Variance[/C][C]1474910006.97521[/C][C]651951893.208448[/C][/ROW]
[ROW][C]Biased Standard Deviation[/C][C]38404.5571120825[/C][C]25533.3486485507[/C][/ROW]
[ROW][C]Covariance[/C][C]457799609.346591[/C][/ROW]
[ROW][C]Correlation[/C][C]0.452710867115501[/C][/ROW]
[ROW][C]Determination[/C][C]0.204947129204469[/C][/ROW]
[ROW][C]T-Test[/C][C]2.82685649102875[/C][/ROW]
[ROW][C]p-value (2 sided)[/C][C]0.00815916589908827[/C][/ROW]
[ROW][C]p-value (1 sided)[/C][C]0.00407958294954414[/C][/ROW]
[ROW][C]95% CI of Correlation[/C][C][0.129534008393334, 0.688944333237892][/C][/ROW]
[ROW][C]Degrees of Freedom[/C][C]31[/C][/ROW]
[ROW][C]Number of Observations[/C][C]33[/C][/ROW]
[/TABLE]
Source: https://freestatistics.org/blog/index.php?pk=286400&T=1

Globally Unique Identifier (entire table): ba.freestatistics.org/blog/index.php?pk=286400&T=1

As an alternative you can also use a QR Code:  

The GUIDs for individual cells are displayed in the table below:

Pearson Product Moment Correlation - Ungrouped Data
StatisticVariable XVariable Y
Mean244355.454545455289093.060606061
Biased Variance1474910006.97521651951893.208448
Biased Standard Deviation38404.557112082525533.3486485507
Covariance457799609.346591
Correlation0.452710867115501
Determination0.204947129204469
T-Test2.82685649102875
p-value (2 sided)0.00815916589908827
p-value (1 sided)0.00407958294954414
95% CI of Correlation[0.129534008393334, 0.688944333237892]
Degrees of Freedom31
Number of Observations33


Normality Tests
> jarque.x
	Jarque-Bera Normality Test
data:  x
JB = 1.1656, p-value = 0.5583
alternative hypothesis: greater
> jarque.y
	Jarque-Bera Normality Test
data:  y
JB = 1.5643, p-value = 0.4574
alternative hypothesis: greater
> ad.x
	Anderson-Darling normality test
data:  x
A = 0.30854, p-value = 0.541
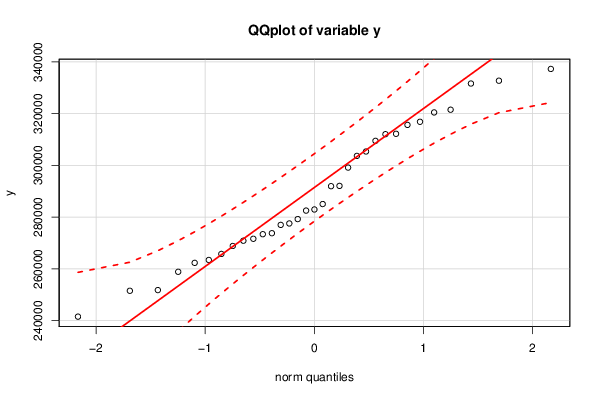
> ad.y
	Anderson-Darling normality test
data:  y
A = 0.43006, p-value = 0.2905

\begin{tabular}{lllllllll}
\hline
Normality Tests \tabularnewline
> jarque.x
	Jarque-Bera Normality Test
data:  x
JB = 1.1656, p-value = 0.5583
alternative hypothesis: greater
\tabularnewline
> jarque.y
	Jarque-Bera Normality Test
data:  y
JB = 1.5643, p-value = 0.4574
alternative hypothesis: greater
\tabularnewline
> ad.x
	Anderson-Darling normality test
data:  x
A = 0.30854, p-value = 0.541
\tabularnewline
> ad.y
	Anderson-Darling normality test
data:  y
A = 0.43006, p-value = 0.2905
\tabularnewline \hline \end{tabular} %Source: https://freestatistics.org/blog/index.php?pk=286400&T=2

[TABLE]
[ROW][C]Normality Tests[/C][/ROW]
[ROW][C]
> jarque.x
	Jarque-Bera Normality Test
data:  x
JB = 1.1656, p-value = 0.5583
alternative hypothesis: greater
[/C][/ROW] [ROW][C]
> jarque.y
	Jarque-Bera Normality Test
data:  y
JB = 1.5643, p-value = 0.4574
alternative hypothesis: greater
[/C][/ROW] [ROW][C]
> ad.x
	Anderson-Darling normality test
data:  x
A = 0.30854, p-value = 0.541
[/C][/ROW] [ROW][C]
> ad.y
	Anderson-Darling normality test
data:  y
A = 0.43006, p-value = 0.2905
[/C][/ROW] [/TABLE] Source: https://freestatistics.org/blog/index.php?pk=286400&T=2

Globally Unique Identifier (entire table): ba.freestatistics.org/blog/index.php?pk=286400&T=2

As an alternative you can also use a QR Code:  

The GUIDs for individual cells are displayed in the table below:

Normality Tests
> jarque.x
	Jarque-Bera Normality Test
data:  x
JB = 1.1656, p-value = 0.5583
alternative hypothesis: greater
> jarque.y
	Jarque-Bera Normality Test
data:  y
JB = 1.5643, p-value = 0.4574
alternative hypothesis: greater
> ad.x
	Anderson-Darling normality test
data:  x
A = 0.30854, p-value = 0.541
> ad.y
	Anderson-Darling normality test
data:  y
A = 0.43006, p-value = 0.2905


Parameters (Session):
Parameters (R input):
R code (references can be found in the software module):
library(psychometric)
x <- x[!is.na(y)]
y <- y[!is.na(y)]
y <- y[!is.na(x)]
x <- x[!is.na(x)]
bitmap(file='test1.png')
histx <- hist(x, plot=FALSE)
histy <- hist(y, plot=FALSE)
maxcounts <- max(c(histx$counts, histx$counts))
xrange <- c(min(x),max(x))
yrange <- c(min(y),max(y))
nf <- layout(matrix(c(2,0,1,3),2,2,byrow=TRUE), c(3,1), c(1,3), TRUE)
par(mar=c(4,4,1,1))
plot(x, y, xlim=xrange, ylim=yrange, xlab=xlab, ylab=ylab, sub=main)
par(mar=c(0,4,1,1))
barplot(histx$counts, axes=FALSE, ylim=c(0, maxcounts), space=0)
par(mar=c(4,0,1,1))
barplot(histy$counts, axes=FALSE, xlim=c(0, maxcounts), space=0, horiz=TRUE)
dev.off()
lx = length(x)
makebiased = (lx-1)/lx
varx = var(x)*makebiased
vary = var(y)*makebiased
corxy <- cor.test(x,y,method='pearson', na.rm = T)
cxy <- as.matrix(corxy$estimate)[1,1]
load(file='createtable')
a<-table.start()
a<-table.row.start(a)
a<-table.element(a,'Pearson Product Moment Correlation - Ungrouped Data',3,TRUE)
a<-table.row.end(a)
a<-table.row.start(a)
a<-table.element(a,'Statistic',1,TRUE)
a<-table.element(a,'Variable X',1,TRUE)
a<-table.element(a,'Variable Y',1,TRUE)
a<-table.row.end(a)
a<-table.row.start(a)
a<-table.element(a,hyperlink('arithmetic_mean.htm','Mean',''),header=TRUE)
a<-table.element(a,mean(x))
a<-table.element(a,mean(y))
a<-table.row.end(a)
a<-table.row.start(a)
a<-table.element(a,hyperlink('biased.htm','Biased Variance',''),header=TRUE)
a<-table.element(a,varx)
a<-table.element(a,vary)
a<-table.row.end(a)
a<-table.row.start(a)
a<-table.element(a,hyperlink('biased1.htm','Biased Standard Deviation',''),header=TRUE)
a<-table.element(a,sqrt(varx))
a<-table.element(a,sqrt(vary))
a<-table.row.end(a)
a<-table.row.start(a)
a<-table.element(a,hyperlink('covariance.htm','Covariance',''),header=TRUE)
a<-table.element(a,cov(x,y),2)
a<-table.row.end(a)
a<-table.row.start(a)
a<-table.element(a,hyperlink('pearson_correlation.htm','Correlation',''),header=TRUE)
a<-table.element(a,cxy,2)
a<-table.row.end(a)
a<-table.row.start(a)
a<-table.element(a,hyperlink('coeff_of_determination.htm','Determination',''),header=TRUE)
a<-table.element(a,cxy*cxy,2)
a<-table.row.end(a)
a<-table.row.start(a)
a<-table.element(a,hyperlink('ttest_statistic.htm','T-Test',''),header=TRUE)
a<-table.element(a,as.matrix(corxy$statistic)[1,1],2)
a<-table.row.end(a)
a<-table.row.start(a)
a<-table.element(a,'p-value (2 sided)',header=TRUE)
a<-table.element(a,(p2 <- as.matrix(corxy$p.value)[1,1]),2)
a<-table.row.end(a)
a<-table.row.start(a)
a<-table.element(a,'p-value (1 sided)',header=TRUE)
a<-table.element(a,p2/2,2)
a<-table.row.end(a)
a<-table.row.start(a)
a<-table.element(a,'95% CI of Correlation',header=TRUE)
a<-table.element(a,paste('[',CIr(r=cxy, n = lx, level = .95)[1],', ', CIr(r=cxy, n = lx, level = .95)[2],']',sep=''),2)
a<-table.row.end(a)
a<-table.row.start(a)
a<-table.element(a,'Degrees of Freedom',header=TRUE)
a<-table.element(a,lx-2,2)
a<-table.row.end(a)
a<-table.row.start(a)
a<-table.element(a,'Number of Observations',header=TRUE)
a<-table.element(a,lx,2)
a<-table.row.end(a)
a<-table.end(a)
table.save(a,file='mytable.tab')
library(moments)
library(nortest)
jarque.x <- jarque.test(x)
jarque.y <- jarque.test(y)
if(lx>7) {
ad.x <- ad.test(x)
ad.y <- ad.test(y)
}
a<-table.start()
a<-table.row.start(a)
a<-table.element(a,'Normality Tests',1,TRUE)
a<-table.row.end(a)
a<-table.row.start(a)
a<-table.element(a,paste('
',RC.texteval('jarque.x'),'
',sep=''))
a<-table.row.end(a)
a<-table.row.start(a)
a<-table.element(a,paste('
',RC.texteval('jarque.y'),'
',sep=''))
a<-table.row.end(a)
if(lx>7) {
a<-table.row.start(a)
a<-table.element(a,paste('
',RC.texteval('ad.x'),'
',sep=''))
a<-table.row.end(a)
a<-table.row.start(a)
a<-table.element(a,paste('
',RC.texteval('ad.y'),'
',sep=''))
a<-table.row.end(a)
}
a<-table.end(a)
table.save(a,file='mytable1.tab')
library(car)
bitmap(file='test2.png')
qq.plot(x,main='QQplot of variable x')
dev.off()
bitmap(file='test3.png')
qq.plot(y,main='QQplot of variable y')
dev.off()