Free Statistics
of Irreproducible Research!
Description of Statistical Computation | |||||||||||||||||||||
|---|---|---|---|---|---|---|---|---|---|---|---|---|---|---|---|---|---|---|---|---|---|
| Author's title | |||||||||||||||||||||
| Author | *The author of this computation has been verified* | ||||||||||||||||||||
| R Software Module | rwasp_skewness_kurtosis_plot.wasp | ||||||||||||||||||||
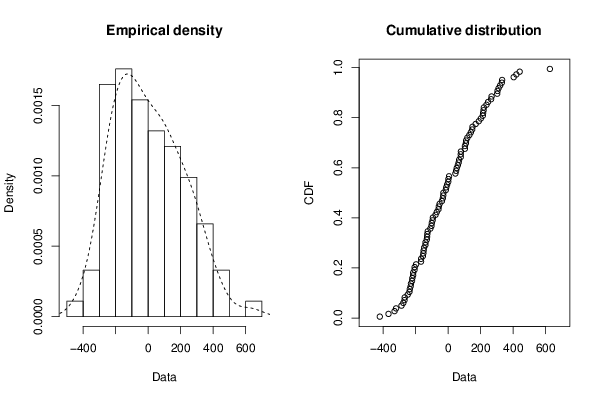
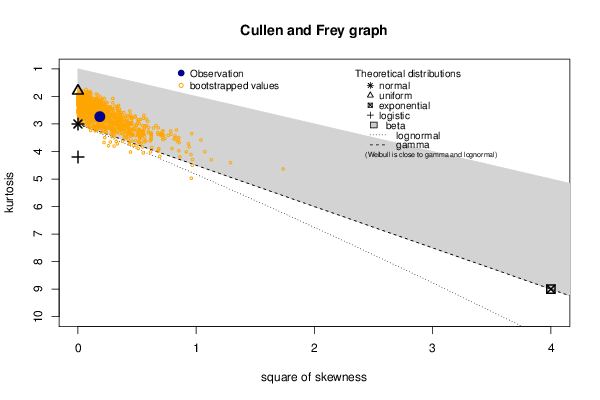
| Title produced by software | Skewness-Kurtosis Plot | ||||||||||||||||||||
| Date of computation | Thu, 17 Dec 2015 11:49:22 +0000 | ||||||||||||||||||||
| Cite this page as follows | Statistical Computations at FreeStatistics.org, Office for Research Development and Education, URL https://freestatistics.org/blog/index.php?v=date/2015/Dec/17/t1450353033x1igasko08tbnyv.htm/, Retrieved Thu, 16 May 2024 09:42:29 +0000 | ||||||||||||||||||||
| Statistical Computations at FreeStatistics.org, Office for Research Development and Education, URL https://freestatistics.org/blog/index.php?pk=286761, Retrieved Thu, 16 May 2024 09:42:29 +0000 | |||||||||||||||||||||
| QR Codes: | |||||||||||||||||||||
|
| |||||||||||||||||||||
| Original text written by user: | |||||||||||||||||||||
| IsPrivate? | No (this computation is public) | ||||||||||||||||||||
| User-defined keywords | |||||||||||||||||||||
| Estimated Impact | 98 | ||||||||||||||||||||
Tree of Dependent Computations | |||||||||||||||||||||
| Family? (F = Feedback message, R = changed R code, M = changed R Module, P = changed Parameters, D = changed Data) | |||||||||||||||||||||
| - [Testing Mean with unknown Variance - Critical Value] [] [2015-10-24 09:52:55] [32b17a345b130fdf5cc88718ed94a974] - R P [Testing Mean with unknown Variance - Critical Value] [] [2015-11-07 09:00:23] [32b17a345b130fdf5cc88718ed94a974] - RMPD [Skewness-Kurtosis Plot] [] [2015-12-17 11:49:22] [5fd2fca6b664199b2dd86155c5786748] [Current] | |||||||||||||||||||||
| Feedback Forum | |||||||||||||||||||||
Post a new message | |||||||||||||||||||||
Dataset | |||||||||||||||||||||
| Dataseries X: | |||||||||||||||||||||
-420,3 102,7 264,1 -206 -52,29 -155,3 -206,7 77,53 625,8 403,3 235,8 331,9 -228,5 -6,156 -38,23 103,2 147,9 44,31 -266,9 330 188,3 -148,2 -29,15 78,47 200,9 -131,3 -220,4 267,1 -109,4 52,99 -320,3 77,6 -95,51 139,9 -14,38 48,93 -215,3 169,4 -329,6 5,414 110,6 -139,2 245,4 -32,79 -140 -222 130,4 -238,2 419,6 -248,5 440 -287 -125,5 1,584 319,8 -100,5 -77,48 149,7 -152,6 -129,5 -275,8 -235,9 -11,72 301,8 310,2 -93,95 -230,6 -215,1 -30,17 215,1 -69,67 59,69 -59,59 219,5 213,1 -197,1 -366,8 -102,4 -57,51 109,2 64,85 -150,6 0,6003 217,8 -166,6 -268,3 118,1 -166,3 67,5 303,5 -128,1 | |||||||||||||||||||||
Tables (Output of Computation) | |||||||||||||||||||||
| |||||||||||||||||||||
Figures (Output of Computation) | |||||||||||||||||||||
Input Parameters & R Code | |||||||||||||||||||||
| Parameters (Session): | |||||||||||||||||||||
| Parameters (R input): | |||||||||||||||||||||
| R code (references can be found in the software module): | |||||||||||||||||||||
library(fitdistrplus) | |||||||||||||||||||||