Free Statistics

of Irreproducible Research!

Author's title

Author*The author of this computation has been verified*
R Software Modulerwasp_multipleregression.wasp
Title produced by softwareMultiple Regression
Date of computationThu, 17 Dec 2015 12:41:27 +0000
Cite this page as followsStatistical Computations at FreeStatistics.org, Office for Research Development and Education, URL https://freestatistics.org/blog/index.php?v=date/2015/Dec/17/t1450356098z4f02h6i9ha88a4.htm/, Retrieved Thu, 16 May 2024 17:04:25 +0000
Statistical Computations at FreeStatistics.org, Office for Research Development and Education, URL https://freestatistics.org/blog/index.php?pk=286774, Retrieved Thu, 16 May 2024 17:04:25 +0000
QR Codes:

Original text written by user:
IsPrivate?No (this computation is public)
User-defined keywords
Estimated Impact80
Family? (F = Feedback message, R = changed R code, M = changed R Module, P = changed Parameters, D = changed Data)
-       [Multiple Regression] [] [2015-12-17 12:41:27] [5fd2fca6b664199b2dd86155c5786748] [Current]
Feedback Forum

Post a new message
Dataseries X:
1775	2132
2197	1964
2920	2209
4240	1965
5415	2631
6136	2583
6719	2714
6234	2248
7152	2364
3646	3042
2165	2316
2803	2735
1615	2493
2350	2136
3350	2467
3536	2414
5834	2556
6767	2768
5993	2998
7276	2573
5641	3005
3477	3469
2247	2540
2466	3187
1567	2689
2237	2154
2598	3065
3729	2397
5715	2787
5776	3579
5852	2915
6878	3025
5488	3245
3583	3328
2054	2840
2282	3342
1552	2261
2261	2590
2446	2624
3519	1860
5161	2577
5085	2646
5711	2639
6057	2807
5224	2350
3363	3053
1899	2203
2115	2471
1491	1967
2061	2473
2419	2397
3430	1904
4778	2732
4862	2297
6176	2734
5664	2719
5529	2296
3418	3243
1941	2166
2402	2261
1579	2408
2146	2536
2462	2324
3695	2178
4831	2803
5134	2604
6250	2782
5760	2656
6249	2801
2917	3122
1741	2393
2359	2233
1511	2451
2059	2596
2635	2467
2867	2210
4403	2948
5720	2507
4502	3019
5749	2401
5627	2818
2846	3305
1762	2101
2429	2582
1169	2407
2154	2416
2249	2463
2687	2228
4359	2616
5382	2934
4459	2668
6398	2808
4596	2664
3024	3112
1887	2321
2070	2718
1351	2297
2218	2534
2461	2647
3028	2064
4784	2642
4975	2702
4607	2348
6249	2734
4809	2709
3157	3206
1910	2214
2228	2531
1594	2119
2467	2369
2222	2682
3607	1840
4685	2622
4962	2570
5770	2447
5480	2871
5000	2485
3228	2957
1993	2102
2288	2250
1588	2051
2105	2260
2191	2327
3591	1781
4668	2631
4885	2180
5822	2150
5599	2837
5340	1976
3082	2836
2010	2203
2301	1770


Summary of computational transaction
Raw Inputview raw input (R code)
Raw Outputview raw output of R engine
Computing time5 seconds
R Server'Herman Ole Andreas Wold' @ wold.wessa.net

\begin{tabular}{lllllllll}
\hline
Summary of computational transaction \tabularnewline
Raw Input & view raw input (R code)  \tabularnewline
Raw Output & view raw output of R engine  \tabularnewline
Computing time & 5 seconds \tabularnewline
R Server & 'Herman Ole Andreas Wold' @ wold.wessa.net \tabularnewline
\hline
\end{tabular}
%Source: https://freestatistics.org/blog/index.php?pk=286774&T=0

[TABLE]
[ROW][C]Summary of computational transaction[/C][/ROW]
[ROW][C]Raw Input[/C][C]view raw input (R code) [/C][/ROW]
[ROW][C]Raw Output[/C][C]view raw output of R engine [/C][/ROW]
[ROW][C]Computing time[/C][C]5 seconds[/C][/ROW]
[ROW][C]R Server[/C][C]'Herman Ole Andreas Wold' @ wold.wessa.net[/C][/ROW]
[/TABLE]
Source: https://freestatistics.org/blog/index.php?pk=286774&T=0

Globally Unique Identifier (entire table): ba.freestatistics.org/blog/index.php?pk=286774&T=0

As an alternative you can also use a QR Code:  

The GUIDs for individual cells are displayed in the table below:

Summary of computational transaction
Raw Inputview raw input (R code)
Raw Outputview raw output of R engine
Computing time5 seconds
R Server'Herman Ole Andreas Wold' @ wold.wessa.net


Multiple Linear Regression - Estimated Regression Equation
(1-B12)(1-B)Scheidingen[t] = -1.29684 + 0.0433647`(1-B12)(1-B)Huwelijken`[t] + 0.169126`(1-B12)(1-B)Huwelijken(t-1s)`[t] + 0.162641`(1-B12)(1-B)Huwelijken(t-2s)`[t] + e[t]

\begin{tabular}{lllllllll}
\hline
Multiple Linear Regression - Estimated Regression Equation \tabularnewline
(1-B12)(1-B)Scheidingen[t] =  -1.29684 +  0.0433647`(1-B12)(1-B)Huwelijken`[t] +  0.169126`(1-B12)(1-B)Huwelijken(t-1s)`[t] +  0.162641`(1-B12)(1-B)Huwelijken(t-2s)`[t]  + e[t] \tabularnewline
 \tabularnewline
\hline
\end{tabular}
%Source: https://freestatistics.org/blog/index.php?pk=286774&T=1

[TABLE]
[ROW][C]Multiple Linear Regression - Estimated Regression Equation[/C][/ROW]
[ROW][C](1-B12)(1-B)Scheidingen[t] =  -1.29684 +  0.0433647`(1-B12)(1-B)Huwelijken`[t] +  0.169126`(1-B12)(1-B)Huwelijken(t-1s)`[t] +  0.162641`(1-B12)(1-B)Huwelijken(t-2s)`[t]  + e[t][/C][/ROW]
[ROW][C][/C][/ROW]
[/TABLE]
Source: https://freestatistics.org/blog/index.php?pk=286774&T=1

Globally Unique Identifier (entire table): ba.freestatistics.org/blog/index.php?pk=286774&T=1

As an alternative you can also use a QR Code:  

The GUIDs for individual cells are displayed in the table below:

Multiple Linear Regression - Estimated Regression Equation
(1-B12)(1-B)Scheidingen[t] = -1.29684 + 0.0433647`(1-B12)(1-B)Huwelijken`[t] + 0.169126`(1-B12)(1-B)Huwelijken(t-1s)`[t] + 0.162641`(1-B12)(1-B)Huwelijken(t-2s)`[t] + e[t]


Multiple Linear Regression - Ordinary Least Squares
VariableParameterS.D.T-STATH0: parameter = 02-tail p-value1-tail p-value
(Intercept)-1.297 34.29-3.7820e-02 0.9699 0.485
`(1-B12)(1-B)Huwelijken`+0.04337 0.0643+6.7450e-01 0.5017 0.2509
`(1-B12)(1-B)Huwelijken(t-1s)`+0.1691 0.05739+2.9470e+00 0.004074 0.002037
`(1-B12)(1-B)Huwelijken(t-2s)`+0.1626 0.05461+2.9780e+00 0.003715 0.001857

\begin{tabular}{lllllllll}
\hline
Multiple Linear Regression - Ordinary Least Squares \tabularnewline
Variable & Parameter & S.D. & T-STATH0: parameter = 0 & 2-tail p-value & 1-tail p-value \tabularnewline
(Intercept) & -1.297 &  34.29 & -3.7820e-02 &  0.9699 &  0.485 \tabularnewline
`(1-B12)(1-B)Huwelijken` & +0.04337 &  0.0643 & +6.7450e-01 &  0.5017 &  0.2509 \tabularnewline
`(1-B12)(1-B)Huwelijken(t-1s)` & +0.1691 &  0.05739 & +2.9470e+00 &  0.004074 &  0.002037 \tabularnewline
`(1-B12)(1-B)Huwelijken(t-2s)` & +0.1626 &  0.05461 & +2.9780e+00 &  0.003715 &  0.001857 \tabularnewline
\hline
\end{tabular}
%Source: https://freestatistics.org/blog/index.php?pk=286774&T=2

[TABLE]
[ROW][C]Multiple Linear Regression - Ordinary Least Squares[/C][/ROW]
[ROW][C]Variable[/C][C]Parameter[/C][C]S.D.[/C][C]T-STATH0: parameter = 0[/C][C]2-tail p-value[/C][C]1-tail p-value[/C][/ROW]
[ROW][C](Intercept)[/C][C]-1.297[/C][C] 34.29[/C][C]-3.7820e-02[/C][C] 0.9699[/C][C] 0.485[/C][/ROW]
[ROW][C]`(1-B12)(1-B)Huwelijken`[/C][C]+0.04337[/C][C] 0.0643[/C][C]+6.7450e-01[/C][C] 0.5017[/C][C] 0.2509[/C][/ROW]
[ROW][C]`(1-B12)(1-B)Huwelijken(t-1s)`[/C][C]+0.1691[/C][C] 0.05739[/C][C]+2.9470e+00[/C][C] 0.004074[/C][C] 0.002037[/C][/ROW]
[ROW][C]`(1-B12)(1-B)Huwelijken(t-2s)`[/C][C]+0.1626[/C][C] 0.05461[/C][C]+2.9780e+00[/C][C] 0.003715[/C][C] 0.001857[/C][/ROW]
[/TABLE]
Source: https://freestatistics.org/blog/index.php?pk=286774&T=2

Globally Unique Identifier (entire table): ba.freestatistics.org/blog/index.php?pk=286774&T=2

As an alternative you can also use a QR Code:  

The GUIDs for individual cells are displayed in the table below:

Multiple Linear Regression - Ordinary Least Squares
VariableParameterS.D.T-STATH0: parameter = 02-tail p-value1-tail p-value
(Intercept)-1.297 34.29-3.7820e-02 0.9699 0.485
`(1-B12)(1-B)Huwelijken`+0.04337 0.0643+6.7450e-01 0.5017 0.2509
`(1-B12)(1-B)Huwelijken(t-1s)`+0.1691 0.05739+2.9470e+00 0.004074 0.002037
`(1-B12)(1-B)Huwelijken(t-2s)`+0.1626 0.05461+2.9780e+00 0.003715 0.001857


Multiple Linear Regression - Regression Statistics
Multiple R 0.4181
R-squared 0.1748
Adjusted R-squared 0.1476
F-TEST (value) 6.425
F-TEST (DF numerator)3
F-TEST (DF denominator)91
p-value 0.0005376
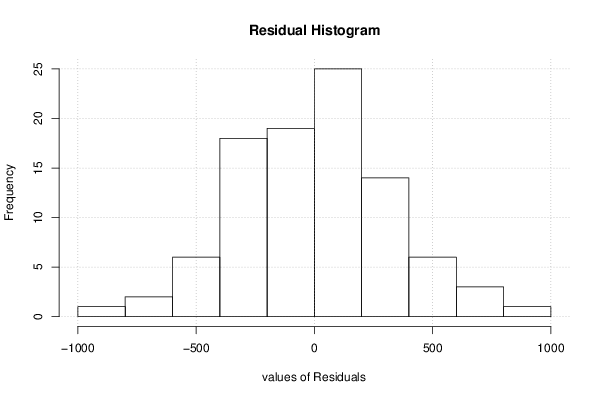
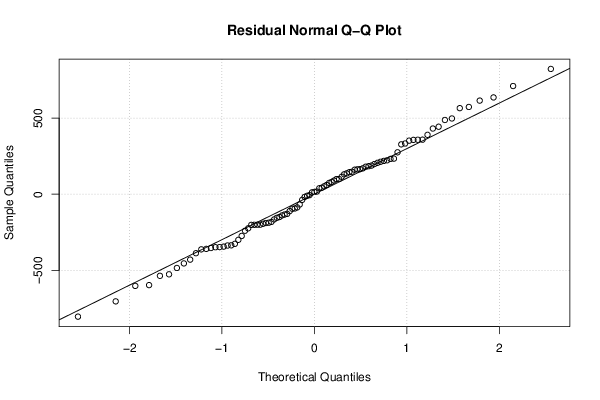
Multiple Linear Regression - Residual Statistics
Residual Standard Deviation 334.3
Sum Squared Residuals 1.017e+07

\begin{tabular}{lllllllll}
\hline
Multiple Linear Regression - Regression Statistics \tabularnewline
Multiple R &  0.4181 \tabularnewline
R-squared &  0.1748 \tabularnewline
Adjusted R-squared &  0.1476 \tabularnewline
F-TEST (value) &  6.425 \tabularnewline
F-TEST (DF numerator) & 3 \tabularnewline
F-TEST (DF denominator) & 91 \tabularnewline
p-value &  0.0005376 \tabularnewline
Multiple Linear Regression - Residual Statistics \tabularnewline
Residual Standard Deviation &  334.3 \tabularnewline
Sum Squared Residuals &  1.017e+07 \tabularnewline
\hline
\end{tabular}
%Source: https://freestatistics.org/blog/index.php?pk=286774&T=3

[TABLE]
[ROW][C]Multiple Linear Regression - Regression Statistics[/C][/ROW]
[ROW][C]Multiple R[/C][C] 0.4181[/C][/ROW]
[ROW][C]R-squared[/C][C] 0.1748[/C][/ROW]
[ROW][C]Adjusted R-squared[/C][C] 0.1476[/C][/ROW]
[ROW][C]F-TEST (value)[/C][C] 6.425[/C][/ROW]
[ROW][C]F-TEST (DF numerator)[/C][C]3[/C][/ROW]
[ROW][C]F-TEST (DF denominator)[/C][C]91[/C][/ROW]
[ROW][C]p-value[/C][C] 0.0005376[/C][/ROW]
[ROW][C]Multiple Linear Regression - Residual Statistics[/C][/ROW]
[ROW][C]Residual Standard Deviation[/C][C] 334.3[/C][/ROW]
[ROW][C]Sum Squared Residuals[/C][C] 1.017e+07[/C][/ROW]
[/TABLE]
Source: https://freestatistics.org/blog/index.php?pk=286774&T=3

Globally Unique Identifier (entire table): ba.freestatistics.org/blog/index.php?pk=286774&T=3

As an alternative you can also use a QR Code:  

The GUIDs for individual cells are displayed in the table below:

Multiple Linear Regression - Regression Statistics
Multiple R 0.4181
R-squared 0.1748
Adjusted R-squared 0.1476
F-TEST (value) 6.425
F-TEST (DF numerator)3
F-TEST (DF denominator)91
p-value 0.0005376
Multiple Linear Regression - Residual Statistics
Residual Standard Deviation 334.3
Sum Squared Residuals 1.017e+07


Multiple Linear Regression - Actuals, Interpolation, and Residuals
Time or IndexActualsInterpolationForecastResidualsPrediction Error
1 864 40.31 823.7
2-877-71.95-805.1
3-96-28.42-67.58
4 327 113.7 213.3
5-723-120.2-602.8
6 657-54.39 711.4
7 58 213.3-155.3
8-677-350.9-326.1
9 620 262.7 357.3
10-362-8.224-353.8
11-234-68.44-165.6
12 577 78.89 498.1
13 177-11.3 188.3
14-110-127.5 17.49
15 271 139.9 131.1
16 111-123 234
17-504-159.4-344.6
18 444 259.8 184.2
19-183-195.3 12.31
20 34 163-129
21 244 37.43 206.6
22-227-39.5-187.5
23-173 8.762-181.8
24 651 35.49 615.5
25-378-18.59-359.4
26-136-2.484-133.5
27 347-11.59 358.6
28-203-116.2-86.84
29 236 12.98 223
30-259 195.9-454.9
31-111-256 145
32 568 234.4 333.6
33-626-89.37-536.6
34 348 20.13 327.9
35-255 45-300
36 71-18.8 89.8
37 17-25.24 42.24
38 83 31.01 51.99
39-111-17.24-93.76
40 113-67.62 180.6
41-242 105.7-347.7
42 334-24.1 358.1
43-492-61.8-430.2
44 272 191.3 80.74
45 166-224.6 390.6
46-475 51.49-526.5
47 641 67.23 573.8
48-393-55.76-337.2
49-136 13.95-150
50 176 14.99 161
51 22-125.6 147.6
52-350 37.77-387.8
53 759 193.1 565.9
54-778-415.4-362.6
55 758 326.1 431.9
56-561-76-485
57-39-54.27 15.27
58 413 60.92 352.1
59-84 11.54-95.54
60-246-51.58-194.4
61 228 64.4 163.6
62 66-33.94 99.94
63-348-123.7-224.3
64 190 90.4 99.6
65-258 77.82-335.8
66-88-306.9 218.9
67 246 385.4-139.4
68 119-369.1 488.1
69 49 289.3-240.3
70-201-0.06766-200.9
71-80-69.33-10.67
72 9 26.88-17.88
73 13 50.08-37.08
74 200-75.66 275.7
75-259 89.5-348.5
76 204 5.628 198.4
77-112-186.1 74.1
78 231 191.5 39.46
79 38-22.76 60.76
80-361-171.7-189.3
81-25 176.6-201.6
82 137-28 165
83-169-58.18-110.8
84 213 98.21 114.8
85-41-34.91-6.088
86-246-45.41-200.6
87 296 158.7 137.3
88 68-102.3 170.3
89-399-124.7-274.3
90 93 293.5-200.5
91 263-373.4 636.4
92-475 229.5-704.5
93 388-55.68 443.7
94 222-10.09 232.1
95-581 16.6-597.6

\begin{tabular}{lllllllll}
\hline
Multiple Linear Regression - Actuals, Interpolation, and Residuals \tabularnewline
Time or Index & Actuals & InterpolationForecast & ResidualsPrediction Error \tabularnewline
1 &  864 &  40.31 &  823.7 \tabularnewline
2 & -877 & -71.95 & -805.1 \tabularnewline
3 & -96 & -28.42 & -67.58 \tabularnewline
4 &  327 &  113.7 &  213.3 \tabularnewline
5 & -723 & -120.2 & -602.8 \tabularnewline
6 &  657 & -54.39 &  711.4 \tabularnewline
7 &  58 &  213.3 & -155.3 \tabularnewline
8 & -677 & -350.9 & -326.1 \tabularnewline
9 &  620 &  262.7 &  357.3 \tabularnewline
10 & -362 & -8.224 & -353.8 \tabularnewline
11 & -234 & -68.44 & -165.6 \tabularnewline
12 &  577 &  78.89 &  498.1 \tabularnewline
13 &  177 & -11.3 &  188.3 \tabularnewline
14 & -110 & -127.5 &  17.49 \tabularnewline
15 &  271 &  139.9 &  131.1 \tabularnewline
16 &  111 & -123 &  234 \tabularnewline
17 & -504 & -159.4 & -344.6 \tabularnewline
18 &  444 &  259.8 &  184.2 \tabularnewline
19 & -183 & -195.3 &  12.31 \tabularnewline
20 &  34 &  163 & -129 \tabularnewline
21 &  244 &  37.43 &  206.6 \tabularnewline
22 & -227 & -39.5 & -187.5 \tabularnewline
23 & -173 &  8.762 & -181.8 \tabularnewline
24 &  651 &  35.49 &  615.5 \tabularnewline
25 & -378 & -18.59 & -359.4 \tabularnewline
26 & -136 & -2.484 & -133.5 \tabularnewline
27 &  347 & -11.59 &  358.6 \tabularnewline
28 & -203 & -116.2 & -86.84 \tabularnewline
29 &  236 &  12.98 &  223 \tabularnewline
30 & -259 &  195.9 & -454.9 \tabularnewline
31 & -111 & -256 &  145 \tabularnewline
32 &  568 &  234.4 &  333.6 \tabularnewline
33 & -626 & -89.37 & -536.6 \tabularnewline
34 &  348 &  20.13 &  327.9 \tabularnewline
35 & -255 &  45 & -300 \tabularnewline
36 &  71 & -18.8 &  89.8 \tabularnewline
37 &  17 & -25.24 &  42.24 \tabularnewline
38 &  83 &  31.01 &  51.99 \tabularnewline
39 & -111 & -17.24 & -93.76 \tabularnewline
40 &  113 & -67.62 &  180.6 \tabularnewline
41 & -242 &  105.7 & -347.7 \tabularnewline
42 &  334 & -24.1 &  358.1 \tabularnewline
43 & -492 & -61.8 & -430.2 \tabularnewline
44 &  272 &  191.3 &  80.74 \tabularnewline
45 &  166 & -224.6 &  390.6 \tabularnewline
46 & -475 &  51.49 & -526.5 \tabularnewline
47 &  641 &  67.23 &  573.8 \tabularnewline
48 & -393 & -55.76 & -337.2 \tabularnewline
49 & -136 &  13.95 & -150 \tabularnewline
50 &  176 &  14.99 &  161 \tabularnewline
51 &  22 & -125.6 &  147.6 \tabularnewline
52 & -350 &  37.77 & -387.8 \tabularnewline
53 &  759 &  193.1 &  565.9 \tabularnewline
54 & -778 & -415.4 & -362.6 \tabularnewline
55 &  758 &  326.1 &  431.9 \tabularnewline
56 & -561 & -76 & -485 \tabularnewline
57 & -39 & -54.27 &  15.27 \tabularnewline
58 &  413 &  60.92 &  352.1 \tabularnewline
59 & -84 &  11.54 & -95.54 \tabularnewline
60 & -246 & -51.58 & -194.4 \tabularnewline
61 &  228 &  64.4 &  163.6 \tabularnewline
62 &  66 & -33.94 &  99.94 \tabularnewline
63 & -348 & -123.7 & -224.3 \tabularnewline
64 &  190 &  90.4 &  99.6 \tabularnewline
65 & -258 &  77.82 & -335.8 \tabularnewline
66 & -88 & -306.9 &  218.9 \tabularnewline
67 &  246 &  385.4 & -139.4 \tabularnewline
68 &  119 & -369.1 &  488.1 \tabularnewline
69 &  49 &  289.3 & -240.3 \tabularnewline
70 & -201 & -0.06766 & -200.9 \tabularnewline
71 & -80 & -69.33 & -10.67 \tabularnewline
72 &  9 &  26.88 & -17.88 \tabularnewline
73 &  13 &  50.08 & -37.08 \tabularnewline
74 &  200 & -75.66 &  275.7 \tabularnewline
75 & -259 &  89.5 & -348.5 \tabularnewline
76 &  204 &  5.628 &  198.4 \tabularnewline
77 & -112 & -186.1 &  74.1 \tabularnewline
78 &  231 &  191.5 &  39.46 \tabularnewline
79 &  38 & -22.76 &  60.76 \tabularnewline
80 & -361 & -171.7 & -189.3 \tabularnewline
81 & -25 &  176.6 & -201.6 \tabularnewline
82 &  137 & -28 &  165 \tabularnewline
83 & -169 & -58.18 & -110.8 \tabularnewline
84 &  213 &  98.21 &  114.8 \tabularnewline
85 & -41 & -34.91 & -6.088 \tabularnewline
86 & -246 & -45.41 & -200.6 \tabularnewline
87 &  296 &  158.7 &  137.3 \tabularnewline
88 &  68 & -102.3 &  170.3 \tabularnewline
89 & -399 & -124.7 & -274.3 \tabularnewline
90 &  93 &  293.5 & -200.5 \tabularnewline
91 &  263 & -373.4 &  636.4 \tabularnewline
92 & -475 &  229.5 & -704.5 \tabularnewline
93 &  388 & -55.68 &  443.7 \tabularnewline
94 &  222 & -10.09 &  232.1 \tabularnewline
95 & -581 &  16.6 & -597.6 \tabularnewline
\hline
\end{tabular}
%Source: https://freestatistics.org/blog/index.php?pk=286774&T=4

[TABLE]
[ROW][C]Multiple Linear Regression - Actuals, Interpolation, and Residuals[/C][/ROW]
[ROW][C]Time or Index[/C][C]Actuals[/C][C]InterpolationForecast[/C][C]ResidualsPrediction Error[/C][/ROW]
[ROW][C]1[/C][C] 864[/C][C] 40.31[/C][C] 823.7[/C][/ROW]
[ROW][C]2[/C][C]-877[/C][C]-71.95[/C][C]-805.1[/C][/ROW]
[ROW][C]3[/C][C]-96[/C][C]-28.42[/C][C]-67.58[/C][/ROW]
[ROW][C]4[/C][C] 327[/C][C] 113.7[/C][C] 213.3[/C][/ROW]
[ROW][C]5[/C][C]-723[/C][C]-120.2[/C][C]-602.8[/C][/ROW]
[ROW][C]6[/C][C] 657[/C][C]-54.39[/C][C] 711.4[/C][/ROW]
[ROW][C]7[/C][C] 58[/C][C] 213.3[/C][C]-155.3[/C][/ROW]
[ROW][C]8[/C][C]-677[/C][C]-350.9[/C][C]-326.1[/C][/ROW]
[ROW][C]9[/C][C] 620[/C][C] 262.7[/C][C] 357.3[/C][/ROW]
[ROW][C]10[/C][C]-362[/C][C]-8.224[/C][C]-353.8[/C][/ROW]
[ROW][C]11[/C][C]-234[/C][C]-68.44[/C][C]-165.6[/C][/ROW]
[ROW][C]12[/C][C] 577[/C][C] 78.89[/C][C] 498.1[/C][/ROW]
[ROW][C]13[/C][C] 177[/C][C]-11.3[/C][C] 188.3[/C][/ROW]
[ROW][C]14[/C][C]-110[/C][C]-127.5[/C][C] 17.49[/C][/ROW]
[ROW][C]15[/C][C] 271[/C][C] 139.9[/C][C] 131.1[/C][/ROW]
[ROW][C]16[/C][C] 111[/C][C]-123[/C][C] 234[/C][/ROW]
[ROW][C]17[/C][C]-504[/C][C]-159.4[/C][C]-344.6[/C][/ROW]
[ROW][C]18[/C][C] 444[/C][C] 259.8[/C][C] 184.2[/C][/ROW]
[ROW][C]19[/C][C]-183[/C][C]-195.3[/C][C] 12.31[/C][/ROW]
[ROW][C]20[/C][C] 34[/C][C] 163[/C][C]-129[/C][/ROW]
[ROW][C]21[/C][C] 244[/C][C] 37.43[/C][C] 206.6[/C][/ROW]
[ROW][C]22[/C][C]-227[/C][C]-39.5[/C][C]-187.5[/C][/ROW]
[ROW][C]23[/C][C]-173[/C][C] 8.762[/C][C]-181.8[/C][/ROW]
[ROW][C]24[/C][C] 651[/C][C] 35.49[/C][C] 615.5[/C][/ROW]
[ROW][C]25[/C][C]-378[/C][C]-18.59[/C][C]-359.4[/C][/ROW]
[ROW][C]26[/C][C]-136[/C][C]-2.484[/C][C]-133.5[/C][/ROW]
[ROW][C]27[/C][C] 347[/C][C]-11.59[/C][C] 358.6[/C][/ROW]
[ROW][C]28[/C][C]-203[/C][C]-116.2[/C][C]-86.84[/C][/ROW]
[ROW][C]29[/C][C] 236[/C][C] 12.98[/C][C] 223[/C][/ROW]
[ROW][C]30[/C][C]-259[/C][C] 195.9[/C][C]-454.9[/C][/ROW]
[ROW][C]31[/C][C]-111[/C][C]-256[/C][C] 145[/C][/ROW]
[ROW][C]32[/C][C] 568[/C][C] 234.4[/C][C] 333.6[/C][/ROW]
[ROW][C]33[/C][C]-626[/C][C]-89.37[/C][C]-536.6[/C][/ROW]
[ROW][C]34[/C][C] 348[/C][C] 20.13[/C][C] 327.9[/C][/ROW]
[ROW][C]35[/C][C]-255[/C][C] 45[/C][C]-300[/C][/ROW]
[ROW][C]36[/C][C] 71[/C][C]-18.8[/C][C] 89.8[/C][/ROW]
[ROW][C]37[/C][C] 17[/C][C]-25.24[/C][C] 42.24[/C][/ROW]
[ROW][C]38[/C][C] 83[/C][C] 31.01[/C][C] 51.99[/C][/ROW]
[ROW][C]39[/C][C]-111[/C][C]-17.24[/C][C]-93.76[/C][/ROW]
[ROW][C]40[/C][C] 113[/C][C]-67.62[/C][C] 180.6[/C][/ROW]
[ROW][C]41[/C][C]-242[/C][C] 105.7[/C][C]-347.7[/C][/ROW]
[ROW][C]42[/C][C] 334[/C][C]-24.1[/C][C] 358.1[/C][/ROW]
[ROW][C]43[/C][C]-492[/C][C]-61.8[/C][C]-430.2[/C][/ROW]
[ROW][C]44[/C][C] 272[/C][C] 191.3[/C][C] 80.74[/C][/ROW]
[ROW][C]45[/C][C] 166[/C][C]-224.6[/C][C] 390.6[/C][/ROW]
[ROW][C]46[/C][C]-475[/C][C] 51.49[/C][C]-526.5[/C][/ROW]
[ROW][C]47[/C][C] 641[/C][C] 67.23[/C][C] 573.8[/C][/ROW]
[ROW][C]48[/C][C]-393[/C][C]-55.76[/C][C]-337.2[/C][/ROW]
[ROW][C]49[/C][C]-136[/C][C] 13.95[/C][C]-150[/C][/ROW]
[ROW][C]50[/C][C] 176[/C][C] 14.99[/C][C] 161[/C][/ROW]
[ROW][C]51[/C][C] 22[/C][C]-125.6[/C][C] 147.6[/C][/ROW]
[ROW][C]52[/C][C]-350[/C][C] 37.77[/C][C]-387.8[/C][/ROW]
[ROW][C]53[/C][C] 759[/C][C] 193.1[/C][C] 565.9[/C][/ROW]
[ROW][C]54[/C][C]-778[/C][C]-415.4[/C][C]-362.6[/C][/ROW]
[ROW][C]55[/C][C] 758[/C][C] 326.1[/C][C] 431.9[/C][/ROW]
[ROW][C]56[/C][C]-561[/C][C]-76[/C][C]-485[/C][/ROW]
[ROW][C]57[/C][C]-39[/C][C]-54.27[/C][C] 15.27[/C][/ROW]
[ROW][C]58[/C][C] 413[/C][C] 60.92[/C][C] 352.1[/C][/ROW]
[ROW][C]59[/C][C]-84[/C][C] 11.54[/C][C]-95.54[/C][/ROW]
[ROW][C]60[/C][C]-246[/C][C]-51.58[/C][C]-194.4[/C][/ROW]
[ROW][C]61[/C][C] 228[/C][C] 64.4[/C][C] 163.6[/C][/ROW]
[ROW][C]62[/C][C] 66[/C][C]-33.94[/C][C] 99.94[/C][/ROW]
[ROW][C]63[/C][C]-348[/C][C]-123.7[/C][C]-224.3[/C][/ROW]
[ROW][C]64[/C][C] 190[/C][C] 90.4[/C][C] 99.6[/C][/ROW]
[ROW][C]65[/C][C]-258[/C][C] 77.82[/C][C]-335.8[/C][/ROW]
[ROW][C]66[/C][C]-88[/C][C]-306.9[/C][C] 218.9[/C][/ROW]
[ROW][C]67[/C][C] 246[/C][C] 385.4[/C][C]-139.4[/C][/ROW]
[ROW][C]68[/C][C] 119[/C][C]-369.1[/C][C] 488.1[/C][/ROW]
[ROW][C]69[/C][C] 49[/C][C] 289.3[/C][C]-240.3[/C][/ROW]
[ROW][C]70[/C][C]-201[/C][C]-0.06766[/C][C]-200.9[/C][/ROW]
[ROW][C]71[/C][C]-80[/C][C]-69.33[/C][C]-10.67[/C][/ROW]
[ROW][C]72[/C][C] 9[/C][C] 26.88[/C][C]-17.88[/C][/ROW]
[ROW][C]73[/C][C] 13[/C][C] 50.08[/C][C]-37.08[/C][/ROW]
[ROW][C]74[/C][C] 200[/C][C]-75.66[/C][C] 275.7[/C][/ROW]
[ROW][C]75[/C][C]-259[/C][C] 89.5[/C][C]-348.5[/C][/ROW]
[ROW][C]76[/C][C] 204[/C][C] 5.628[/C][C] 198.4[/C][/ROW]
[ROW][C]77[/C][C]-112[/C][C]-186.1[/C][C] 74.1[/C][/ROW]
[ROW][C]78[/C][C] 231[/C][C] 191.5[/C][C] 39.46[/C][/ROW]
[ROW][C]79[/C][C] 38[/C][C]-22.76[/C][C] 60.76[/C][/ROW]
[ROW][C]80[/C][C]-361[/C][C]-171.7[/C][C]-189.3[/C][/ROW]
[ROW][C]81[/C][C]-25[/C][C] 176.6[/C][C]-201.6[/C][/ROW]
[ROW][C]82[/C][C] 137[/C][C]-28[/C][C] 165[/C][/ROW]
[ROW][C]83[/C][C]-169[/C][C]-58.18[/C][C]-110.8[/C][/ROW]
[ROW][C]84[/C][C] 213[/C][C] 98.21[/C][C] 114.8[/C][/ROW]
[ROW][C]85[/C][C]-41[/C][C]-34.91[/C][C]-6.088[/C][/ROW]
[ROW][C]86[/C][C]-246[/C][C]-45.41[/C][C]-200.6[/C][/ROW]
[ROW][C]87[/C][C] 296[/C][C] 158.7[/C][C] 137.3[/C][/ROW]
[ROW][C]88[/C][C] 68[/C][C]-102.3[/C][C] 170.3[/C][/ROW]
[ROW][C]89[/C][C]-399[/C][C]-124.7[/C][C]-274.3[/C][/ROW]
[ROW][C]90[/C][C] 93[/C][C] 293.5[/C][C]-200.5[/C][/ROW]
[ROW][C]91[/C][C] 263[/C][C]-373.4[/C][C] 636.4[/C][/ROW]
[ROW][C]92[/C][C]-475[/C][C] 229.5[/C][C]-704.5[/C][/ROW]
[ROW][C]93[/C][C] 388[/C][C]-55.68[/C][C] 443.7[/C][/ROW]
[ROW][C]94[/C][C] 222[/C][C]-10.09[/C][C] 232.1[/C][/ROW]
[ROW][C]95[/C][C]-581[/C][C] 16.6[/C][C]-597.6[/C][/ROW]
[/TABLE]
Source: https://freestatistics.org/blog/index.php?pk=286774&T=4

Globally Unique Identifier (entire table): ba.freestatistics.org/blog/index.php?pk=286774&T=4

As an alternative you can also use a QR Code:  

The GUIDs for individual cells are displayed in the table below:

Multiple Linear Regression - Actuals, Interpolation, and Residuals
Time or IndexActualsInterpolationForecastResidualsPrediction Error
1 864 40.31 823.7
2-877-71.95-805.1
3-96-28.42-67.58
4 327 113.7 213.3
5-723-120.2-602.8
6 657-54.39 711.4
7 58 213.3-155.3
8-677-350.9-326.1
9 620 262.7 357.3
10-362-8.224-353.8
11-234-68.44-165.6
12 577 78.89 498.1
13 177-11.3 188.3
14-110-127.5 17.49
15 271 139.9 131.1
16 111-123 234
17-504-159.4-344.6
18 444 259.8 184.2
19-183-195.3 12.31
20 34 163-129
21 244 37.43 206.6
22-227-39.5-187.5
23-173 8.762-181.8
24 651 35.49 615.5
25-378-18.59-359.4
26-136-2.484-133.5
27 347-11.59 358.6
28-203-116.2-86.84
29 236 12.98 223
30-259 195.9-454.9
31-111-256 145
32 568 234.4 333.6
33-626-89.37-536.6
34 348 20.13 327.9
35-255 45-300
36 71-18.8 89.8
37 17-25.24 42.24
38 83 31.01 51.99
39-111-17.24-93.76
40 113-67.62 180.6
41-242 105.7-347.7
42 334-24.1 358.1
43-492-61.8-430.2
44 272 191.3 80.74
45 166-224.6 390.6
46-475 51.49-526.5
47 641 67.23 573.8
48-393-55.76-337.2
49-136 13.95-150
50 176 14.99 161
51 22-125.6 147.6
52-350 37.77-387.8
53 759 193.1 565.9
54-778-415.4-362.6
55 758 326.1 431.9
56-561-76-485
57-39-54.27 15.27
58 413 60.92 352.1
59-84 11.54-95.54
60-246-51.58-194.4
61 228 64.4 163.6
62 66-33.94 99.94
63-348-123.7-224.3
64 190 90.4 99.6
65-258 77.82-335.8
66-88-306.9 218.9
67 246 385.4-139.4
68 119-369.1 488.1
69 49 289.3-240.3
70-201-0.06766-200.9
71-80-69.33-10.67
72 9 26.88-17.88
73 13 50.08-37.08
74 200-75.66 275.7
75-259 89.5-348.5
76 204 5.628 198.4
77-112-186.1 74.1
78 231 191.5 39.46
79 38-22.76 60.76
80-361-171.7-189.3
81-25 176.6-201.6
82 137-28 165
83-169-58.18-110.8
84 213 98.21 114.8
85-41-34.91-6.088
86-246-45.41-200.6
87 296 158.7 137.3
88 68-102.3 170.3
89-399-124.7-274.3
90 93 293.5-200.5
91 263-373.4 636.4
92-475 229.5-704.5
93 388-55.68 443.7
94 222-10.09 232.1
95-581 16.6-597.6


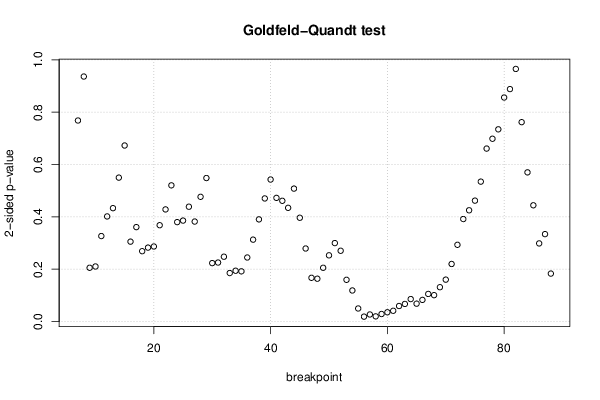
Goldfeld-Quandt test for Heteroskedasticity
p-valuesAlternative Hypothesis
breakpoint indexgreater2-sidedless
7 0.6158 0.7684 0.3842
8 0.5318 0.9365 0.4682
9 0.8973 0.2055 0.1027
10 0.8948 0.2104 0.1052
11 0.8367 0.3267 0.1633
12 0.7992 0.4017 0.2008
13 0.7833 0.4334 0.2167
14 0.725 0.5501 0.275
15 0.6636 0.6728 0.3364
16 0.8474 0.3053 0.1526
17 0.8196 0.3608 0.1804
18 0.8656 0.2689 0.1344
19 0.8587 0.2825 0.1413
20 0.8566 0.2868 0.1434
21 0.8159 0.3681 0.1841
22 0.7857 0.4285 0.2142
23 0.7397 0.5205 0.2603
24 0.81 0.38 0.19
25 0.8071 0.3859 0.1929
26 0.7806 0.4388 0.2194
27 0.8089 0.3821 0.1911
28 0.7616 0.4767 0.2384
29 0.7258 0.5485 0.2742
30 0.8884 0.2233 0.1116
31 0.8873 0.2255 0.1127
32 0.8761 0.2478 0.1239
33 0.9073 0.1854 0.09268
34 0.9029 0.1941 0.09705
35 0.9041 0.1919 0.09593
36 0.8776 0.2448 0.1224
37 0.8435 0.313 0.1565
38 0.8048 0.3905 0.1952
39 0.7647 0.4705 0.2353
40 0.7286 0.5428 0.2714
41 0.7637 0.4727 0.2363
42 0.7692 0.4615 0.2308
43 0.7827 0.4347 0.2173
44 0.746 0.5081 0.254
45 0.8017 0.3966 0.1983
46 0.8604 0.2791 0.1396
47 0.9164 0.1672 0.08358
48 0.9182 0.1637 0.08184
49 0.8973 0.2054 0.1027
50 0.8734 0.2531 0.1266
51 0.8501 0.2999 0.1499
52 0.8648 0.2705 0.1352
53 0.9203 0.1595 0.07973
54 0.9406 0.1187 0.05935
55 0.9751 0.04988 0.02494
56 0.9907 0.01863 0.009314
57 0.9865 0.02696 0.01348
58 0.9901 0.01974 0.00987
59 0.9856 0.02874 0.01437
60 0.9823 0.03543 0.01771
61 0.9795 0.0411 0.02055
62 0.9703 0.05932 0.02966
63 0.9664 0.0672 0.0336
64 0.9571 0.08585 0.04292
65 0.9659 0.06823 0.03411
66 0.9586 0.0827 0.04135
67 0.9473 0.1054 0.0527
68 0.9496 0.1008 0.05041
69 0.9344 0.1312 0.0656
70 0.92 0.1601 0.08004
71 0.89 0.2199 0.11
72 0.8534 0.2933 0.1466
73 0.8041 0.3918 0.1959
74 0.7874 0.4252 0.2126
75 0.769 0.4621 0.231
76 0.7326 0.5347 0.2674
77 0.6694 0.6611 0.3306
78 0.6507 0.6987 0.3493
79 0.6327 0.7347 0.3673
80 0.5719 0.8563 0.4281
81 0.5557 0.8885 0.4443
82 0.4827 0.9655 0.5173
83 0.381 0.7621 0.619
84 0.2851 0.5702 0.7149
85 0.2222 0.4443 0.7778
86 0.1493 0.2986 0.8507
87 0.1671 0.3342 0.8329
88 0.09164 0.1833 0.9084

\begin{tabular}{lllllllll}
\hline
Goldfeld-Quandt test for Heteroskedasticity \tabularnewline
p-values & Alternative Hypothesis \tabularnewline
breakpoint index & greater & 2-sided & less \tabularnewline
7 &  0.6158 &  0.7684 &  0.3842 \tabularnewline
8 &  0.5318 &  0.9365 &  0.4682 \tabularnewline
9 &  0.8973 &  0.2055 &  0.1027 \tabularnewline
10 &  0.8948 &  0.2104 &  0.1052 \tabularnewline
11 &  0.8367 &  0.3267 &  0.1633 \tabularnewline
12 &  0.7992 &  0.4017 &  0.2008 \tabularnewline
13 &  0.7833 &  0.4334 &  0.2167 \tabularnewline
14 &  0.725 &  0.5501 &  0.275 \tabularnewline
15 &  0.6636 &  0.6728 &  0.3364 \tabularnewline
16 &  0.8474 &  0.3053 &  0.1526 \tabularnewline
17 &  0.8196 &  0.3608 &  0.1804 \tabularnewline
18 &  0.8656 &  0.2689 &  0.1344 \tabularnewline
19 &  0.8587 &  0.2825 &  0.1413 \tabularnewline
20 &  0.8566 &  0.2868 &  0.1434 \tabularnewline
21 &  0.8159 &  0.3681 &  0.1841 \tabularnewline
22 &  0.7857 &  0.4285 &  0.2142 \tabularnewline
23 &  0.7397 &  0.5205 &  0.2603 \tabularnewline
24 &  0.81 &  0.38 &  0.19 \tabularnewline
25 &  0.8071 &  0.3859 &  0.1929 \tabularnewline
26 &  0.7806 &  0.4388 &  0.2194 \tabularnewline
27 &  0.8089 &  0.3821 &  0.1911 \tabularnewline
28 &  0.7616 &  0.4767 &  0.2384 \tabularnewline
29 &  0.7258 &  0.5485 &  0.2742 \tabularnewline
30 &  0.8884 &  0.2233 &  0.1116 \tabularnewline
31 &  0.8873 &  0.2255 &  0.1127 \tabularnewline
32 &  0.8761 &  0.2478 &  0.1239 \tabularnewline
33 &  0.9073 &  0.1854 &  0.09268 \tabularnewline
34 &  0.9029 &  0.1941 &  0.09705 \tabularnewline
35 &  0.9041 &  0.1919 &  0.09593 \tabularnewline
36 &  0.8776 &  0.2448 &  0.1224 \tabularnewline
37 &  0.8435 &  0.313 &  0.1565 \tabularnewline
38 &  0.8048 &  0.3905 &  0.1952 \tabularnewline
39 &  0.7647 &  0.4705 &  0.2353 \tabularnewline
40 &  0.7286 &  0.5428 &  0.2714 \tabularnewline
41 &  0.7637 &  0.4727 &  0.2363 \tabularnewline
42 &  0.7692 &  0.4615 &  0.2308 \tabularnewline
43 &  0.7827 &  0.4347 &  0.2173 \tabularnewline
44 &  0.746 &  0.5081 &  0.254 \tabularnewline
45 &  0.8017 &  0.3966 &  0.1983 \tabularnewline
46 &  0.8604 &  0.2791 &  0.1396 \tabularnewline
47 &  0.9164 &  0.1672 &  0.08358 \tabularnewline
48 &  0.9182 &  0.1637 &  0.08184 \tabularnewline
49 &  0.8973 &  0.2054 &  0.1027 \tabularnewline
50 &  0.8734 &  0.2531 &  0.1266 \tabularnewline
51 &  0.8501 &  0.2999 &  0.1499 \tabularnewline
52 &  0.8648 &  0.2705 &  0.1352 \tabularnewline
53 &  0.9203 &  0.1595 &  0.07973 \tabularnewline
54 &  0.9406 &  0.1187 &  0.05935 \tabularnewline
55 &  0.9751 &  0.04988 &  0.02494 \tabularnewline
56 &  0.9907 &  0.01863 &  0.009314 \tabularnewline
57 &  0.9865 &  0.02696 &  0.01348 \tabularnewline
58 &  0.9901 &  0.01974 &  0.00987 \tabularnewline
59 &  0.9856 &  0.02874 &  0.01437 \tabularnewline
60 &  0.9823 &  0.03543 &  0.01771 \tabularnewline
61 &  0.9795 &  0.0411 &  0.02055 \tabularnewline
62 &  0.9703 &  0.05932 &  0.02966 \tabularnewline
63 &  0.9664 &  0.0672 &  0.0336 \tabularnewline
64 &  0.9571 &  0.08585 &  0.04292 \tabularnewline
65 &  0.9659 &  0.06823 &  0.03411 \tabularnewline
66 &  0.9586 &  0.0827 &  0.04135 \tabularnewline
67 &  0.9473 &  0.1054 &  0.0527 \tabularnewline
68 &  0.9496 &  0.1008 &  0.05041 \tabularnewline
69 &  0.9344 &  0.1312 &  0.0656 \tabularnewline
70 &  0.92 &  0.1601 &  0.08004 \tabularnewline
71 &  0.89 &  0.2199 &  0.11 \tabularnewline
72 &  0.8534 &  0.2933 &  0.1466 \tabularnewline
73 &  0.8041 &  0.3918 &  0.1959 \tabularnewline
74 &  0.7874 &  0.4252 &  0.2126 \tabularnewline
75 &  0.769 &  0.4621 &  0.231 \tabularnewline
76 &  0.7326 &  0.5347 &  0.2674 \tabularnewline
77 &  0.6694 &  0.6611 &  0.3306 \tabularnewline
78 &  0.6507 &  0.6987 &  0.3493 \tabularnewline
79 &  0.6327 &  0.7347 &  0.3673 \tabularnewline
80 &  0.5719 &  0.8563 &  0.4281 \tabularnewline
81 &  0.5557 &  0.8885 &  0.4443 \tabularnewline
82 &  0.4827 &  0.9655 &  0.5173 \tabularnewline
83 &  0.381 &  0.7621 &  0.619 \tabularnewline
84 &  0.2851 &  0.5702 &  0.7149 \tabularnewline
85 &  0.2222 &  0.4443 &  0.7778 \tabularnewline
86 &  0.1493 &  0.2986 &  0.8507 \tabularnewline
87 &  0.1671 &  0.3342 &  0.8329 \tabularnewline
88 &  0.09164 &  0.1833 &  0.9084 \tabularnewline
\hline
\end{tabular}
%Source: https://freestatistics.org/blog/index.php?pk=286774&T=5

[TABLE]
[ROW][C]Goldfeld-Quandt test for Heteroskedasticity[/C][/ROW]
[ROW][C]p-values[/C][C]Alternative Hypothesis[/C][/ROW]
[ROW][C]breakpoint index[/C][C]greater[/C][C]2-sided[/C][C]less[/C][/ROW]
[ROW][C]7[/C][C] 0.6158[/C][C] 0.7684[/C][C] 0.3842[/C][/ROW]
[ROW][C]8[/C][C] 0.5318[/C][C] 0.9365[/C][C] 0.4682[/C][/ROW]
[ROW][C]9[/C][C] 0.8973[/C][C] 0.2055[/C][C] 0.1027[/C][/ROW]
[ROW][C]10[/C][C] 0.8948[/C][C] 0.2104[/C][C] 0.1052[/C][/ROW]
[ROW][C]11[/C][C] 0.8367[/C][C] 0.3267[/C][C] 0.1633[/C][/ROW]
[ROW][C]12[/C][C] 0.7992[/C][C] 0.4017[/C][C] 0.2008[/C][/ROW]
[ROW][C]13[/C][C] 0.7833[/C][C] 0.4334[/C][C] 0.2167[/C][/ROW]
[ROW][C]14[/C][C] 0.725[/C][C] 0.5501[/C][C] 0.275[/C][/ROW]
[ROW][C]15[/C][C] 0.6636[/C][C] 0.6728[/C][C] 0.3364[/C][/ROW]
[ROW][C]16[/C][C] 0.8474[/C][C] 0.3053[/C][C] 0.1526[/C][/ROW]
[ROW][C]17[/C][C] 0.8196[/C][C] 0.3608[/C][C] 0.1804[/C][/ROW]
[ROW][C]18[/C][C] 0.8656[/C][C] 0.2689[/C][C] 0.1344[/C][/ROW]
[ROW][C]19[/C][C] 0.8587[/C][C] 0.2825[/C][C] 0.1413[/C][/ROW]
[ROW][C]20[/C][C] 0.8566[/C][C] 0.2868[/C][C] 0.1434[/C][/ROW]
[ROW][C]21[/C][C] 0.8159[/C][C] 0.3681[/C][C] 0.1841[/C][/ROW]
[ROW][C]22[/C][C] 0.7857[/C][C] 0.4285[/C][C] 0.2142[/C][/ROW]
[ROW][C]23[/C][C] 0.7397[/C][C] 0.5205[/C][C] 0.2603[/C][/ROW]
[ROW][C]24[/C][C] 0.81[/C][C] 0.38[/C][C] 0.19[/C][/ROW]
[ROW][C]25[/C][C] 0.8071[/C][C] 0.3859[/C][C] 0.1929[/C][/ROW]
[ROW][C]26[/C][C] 0.7806[/C][C] 0.4388[/C][C] 0.2194[/C][/ROW]
[ROW][C]27[/C][C] 0.8089[/C][C] 0.3821[/C][C] 0.1911[/C][/ROW]
[ROW][C]28[/C][C] 0.7616[/C][C] 0.4767[/C][C] 0.2384[/C][/ROW]
[ROW][C]29[/C][C] 0.7258[/C][C] 0.5485[/C][C] 0.2742[/C][/ROW]
[ROW][C]30[/C][C] 0.8884[/C][C] 0.2233[/C][C] 0.1116[/C][/ROW]
[ROW][C]31[/C][C] 0.8873[/C][C] 0.2255[/C][C] 0.1127[/C][/ROW]
[ROW][C]32[/C][C] 0.8761[/C][C] 0.2478[/C][C] 0.1239[/C][/ROW]
[ROW][C]33[/C][C] 0.9073[/C][C] 0.1854[/C][C] 0.09268[/C][/ROW]
[ROW][C]34[/C][C] 0.9029[/C][C] 0.1941[/C][C] 0.09705[/C][/ROW]
[ROW][C]35[/C][C] 0.9041[/C][C] 0.1919[/C][C] 0.09593[/C][/ROW]
[ROW][C]36[/C][C] 0.8776[/C][C] 0.2448[/C][C] 0.1224[/C][/ROW]
[ROW][C]37[/C][C] 0.8435[/C][C] 0.313[/C][C] 0.1565[/C][/ROW]
[ROW][C]38[/C][C] 0.8048[/C][C] 0.3905[/C][C] 0.1952[/C][/ROW]
[ROW][C]39[/C][C] 0.7647[/C][C] 0.4705[/C][C] 0.2353[/C][/ROW]
[ROW][C]40[/C][C] 0.7286[/C][C] 0.5428[/C][C] 0.2714[/C][/ROW]
[ROW][C]41[/C][C] 0.7637[/C][C] 0.4727[/C][C] 0.2363[/C][/ROW]
[ROW][C]42[/C][C] 0.7692[/C][C] 0.4615[/C][C] 0.2308[/C][/ROW]
[ROW][C]43[/C][C] 0.7827[/C][C] 0.4347[/C][C] 0.2173[/C][/ROW]
[ROW][C]44[/C][C] 0.746[/C][C] 0.5081[/C][C] 0.254[/C][/ROW]
[ROW][C]45[/C][C] 0.8017[/C][C] 0.3966[/C][C] 0.1983[/C][/ROW]
[ROW][C]46[/C][C] 0.8604[/C][C] 0.2791[/C][C] 0.1396[/C][/ROW]
[ROW][C]47[/C][C] 0.9164[/C][C] 0.1672[/C][C] 0.08358[/C][/ROW]
[ROW][C]48[/C][C] 0.9182[/C][C] 0.1637[/C][C] 0.08184[/C][/ROW]
[ROW][C]49[/C][C] 0.8973[/C][C] 0.2054[/C][C] 0.1027[/C][/ROW]
[ROW][C]50[/C][C] 0.8734[/C][C] 0.2531[/C][C] 0.1266[/C][/ROW]
[ROW][C]51[/C][C] 0.8501[/C][C] 0.2999[/C][C] 0.1499[/C][/ROW]
[ROW][C]52[/C][C] 0.8648[/C][C] 0.2705[/C][C] 0.1352[/C][/ROW]
[ROW][C]53[/C][C] 0.9203[/C][C] 0.1595[/C][C] 0.07973[/C][/ROW]
[ROW][C]54[/C][C] 0.9406[/C][C] 0.1187[/C][C] 0.05935[/C][/ROW]
[ROW][C]55[/C][C] 0.9751[/C][C] 0.04988[/C][C] 0.02494[/C][/ROW]
[ROW][C]56[/C][C] 0.9907[/C][C] 0.01863[/C][C] 0.009314[/C][/ROW]
[ROW][C]57[/C][C] 0.9865[/C][C] 0.02696[/C][C] 0.01348[/C][/ROW]
[ROW][C]58[/C][C] 0.9901[/C][C] 0.01974[/C][C] 0.00987[/C][/ROW]
[ROW][C]59[/C][C] 0.9856[/C][C] 0.02874[/C][C] 0.01437[/C][/ROW]
[ROW][C]60[/C][C] 0.9823[/C][C] 0.03543[/C][C] 0.01771[/C][/ROW]
[ROW][C]61[/C][C] 0.9795[/C][C] 0.0411[/C][C] 0.02055[/C][/ROW]
[ROW][C]62[/C][C] 0.9703[/C][C] 0.05932[/C][C] 0.02966[/C][/ROW]
[ROW][C]63[/C][C] 0.9664[/C][C] 0.0672[/C][C] 0.0336[/C][/ROW]
[ROW][C]64[/C][C] 0.9571[/C][C] 0.08585[/C][C] 0.04292[/C][/ROW]
[ROW][C]65[/C][C] 0.9659[/C][C] 0.06823[/C][C] 0.03411[/C][/ROW]
[ROW][C]66[/C][C] 0.9586[/C][C] 0.0827[/C][C] 0.04135[/C][/ROW]
[ROW][C]67[/C][C] 0.9473[/C][C] 0.1054[/C][C] 0.0527[/C][/ROW]
[ROW][C]68[/C][C] 0.9496[/C][C] 0.1008[/C][C] 0.05041[/C][/ROW]
[ROW][C]69[/C][C] 0.9344[/C][C] 0.1312[/C][C] 0.0656[/C][/ROW]
[ROW][C]70[/C][C] 0.92[/C][C] 0.1601[/C][C] 0.08004[/C][/ROW]
[ROW][C]71[/C][C] 0.89[/C][C] 0.2199[/C][C] 0.11[/C][/ROW]
[ROW][C]72[/C][C] 0.8534[/C][C] 0.2933[/C][C] 0.1466[/C][/ROW]
[ROW][C]73[/C][C] 0.8041[/C][C] 0.3918[/C][C] 0.1959[/C][/ROW]
[ROW][C]74[/C][C] 0.7874[/C][C] 0.4252[/C][C] 0.2126[/C][/ROW]
[ROW][C]75[/C][C] 0.769[/C][C] 0.4621[/C][C] 0.231[/C][/ROW]
[ROW][C]76[/C][C] 0.7326[/C][C] 0.5347[/C][C] 0.2674[/C][/ROW]
[ROW][C]77[/C][C] 0.6694[/C][C] 0.6611[/C][C] 0.3306[/C][/ROW]
[ROW][C]78[/C][C] 0.6507[/C][C] 0.6987[/C][C] 0.3493[/C][/ROW]
[ROW][C]79[/C][C] 0.6327[/C][C] 0.7347[/C][C] 0.3673[/C][/ROW]
[ROW][C]80[/C][C] 0.5719[/C][C] 0.8563[/C][C] 0.4281[/C][/ROW]
[ROW][C]81[/C][C] 0.5557[/C][C] 0.8885[/C][C] 0.4443[/C][/ROW]
[ROW][C]82[/C][C] 0.4827[/C][C] 0.9655[/C][C] 0.5173[/C][/ROW]
[ROW][C]83[/C][C] 0.381[/C][C] 0.7621[/C][C] 0.619[/C][/ROW]
[ROW][C]84[/C][C] 0.2851[/C][C] 0.5702[/C][C] 0.7149[/C][/ROW]
[ROW][C]85[/C][C] 0.2222[/C][C] 0.4443[/C][C] 0.7778[/C][/ROW]
[ROW][C]86[/C][C] 0.1493[/C][C] 0.2986[/C][C] 0.8507[/C][/ROW]
[ROW][C]87[/C][C] 0.1671[/C][C] 0.3342[/C][C] 0.8329[/C][/ROW]
[ROW][C]88[/C][C] 0.09164[/C][C] 0.1833[/C][C] 0.9084[/C][/ROW]
[/TABLE]
Source: https://freestatistics.org/blog/index.php?pk=286774&T=5

Globally Unique Identifier (entire table): ba.freestatistics.org/blog/index.php?pk=286774&T=5

As an alternative you can also use a QR Code:  

The GUIDs for individual cells are displayed in the table below:

Goldfeld-Quandt test for Heteroskedasticity
p-valuesAlternative Hypothesis
breakpoint indexgreater2-sidedless
7 0.6158 0.7684 0.3842
8 0.5318 0.9365 0.4682
9 0.8973 0.2055 0.1027
10 0.8948 0.2104 0.1052
11 0.8367 0.3267 0.1633
12 0.7992 0.4017 0.2008
13 0.7833 0.4334 0.2167
14 0.725 0.5501 0.275
15 0.6636 0.6728 0.3364
16 0.8474 0.3053 0.1526
17 0.8196 0.3608 0.1804
18 0.8656 0.2689 0.1344
19 0.8587 0.2825 0.1413
20 0.8566 0.2868 0.1434
21 0.8159 0.3681 0.1841
22 0.7857 0.4285 0.2142
23 0.7397 0.5205 0.2603
24 0.81 0.38 0.19
25 0.8071 0.3859 0.1929
26 0.7806 0.4388 0.2194
27 0.8089 0.3821 0.1911
28 0.7616 0.4767 0.2384
29 0.7258 0.5485 0.2742
30 0.8884 0.2233 0.1116
31 0.8873 0.2255 0.1127
32 0.8761 0.2478 0.1239
33 0.9073 0.1854 0.09268
34 0.9029 0.1941 0.09705
35 0.9041 0.1919 0.09593
36 0.8776 0.2448 0.1224
37 0.8435 0.313 0.1565
38 0.8048 0.3905 0.1952
39 0.7647 0.4705 0.2353
40 0.7286 0.5428 0.2714
41 0.7637 0.4727 0.2363
42 0.7692 0.4615 0.2308
43 0.7827 0.4347 0.2173
44 0.746 0.5081 0.254
45 0.8017 0.3966 0.1983
46 0.8604 0.2791 0.1396
47 0.9164 0.1672 0.08358
48 0.9182 0.1637 0.08184
49 0.8973 0.2054 0.1027
50 0.8734 0.2531 0.1266
51 0.8501 0.2999 0.1499
52 0.8648 0.2705 0.1352
53 0.9203 0.1595 0.07973
54 0.9406 0.1187 0.05935
55 0.9751 0.04988 0.02494
56 0.9907 0.01863 0.009314
57 0.9865 0.02696 0.01348
58 0.9901 0.01974 0.00987
59 0.9856 0.02874 0.01437
60 0.9823 0.03543 0.01771
61 0.9795 0.0411 0.02055
62 0.9703 0.05932 0.02966
63 0.9664 0.0672 0.0336
64 0.9571 0.08585 0.04292
65 0.9659 0.06823 0.03411
66 0.9586 0.0827 0.04135
67 0.9473 0.1054 0.0527
68 0.9496 0.1008 0.05041
69 0.9344 0.1312 0.0656
70 0.92 0.1601 0.08004
71 0.89 0.2199 0.11
72 0.8534 0.2933 0.1466
73 0.8041 0.3918 0.1959
74 0.7874 0.4252 0.2126
75 0.769 0.4621 0.231
76 0.7326 0.5347 0.2674
77 0.6694 0.6611 0.3306
78 0.6507 0.6987 0.3493
79 0.6327 0.7347 0.3673
80 0.5719 0.8563 0.4281
81 0.5557 0.8885 0.4443
82 0.4827 0.9655 0.5173
83 0.381 0.7621 0.619
84 0.2851 0.5702 0.7149
85 0.2222 0.4443 0.7778
86 0.1493 0.2986 0.8507
87 0.1671 0.3342 0.8329
88 0.09164 0.1833 0.9084


Meta Analysis of Goldfeld-Quandt test for Heteroskedasticity
Description# significant tests% significant testsOK/NOK
1% type I error level0 0OK
5% type I error level70.0853659NOK
10% type I error level120.146341NOK

\begin{tabular}{lllllllll}
\hline
Meta Analysis of Goldfeld-Quandt test for Heteroskedasticity \tabularnewline
Description & # significant tests & % significant tests & OK/NOK \tabularnewline
1% type I error level & 0 &  0 & OK \tabularnewline
5% type I error level & 7 & 0.0853659 & NOK \tabularnewline
10% type I error level & 12 & 0.146341 & NOK \tabularnewline
\hline
\end{tabular}
%Source: https://freestatistics.org/blog/index.php?pk=286774&T=6

[TABLE]
[ROW][C]Meta Analysis of Goldfeld-Quandt test for Heteroskedasticity[/C][/ROW]
[ROW][C]Description[/C][C]# significant tests[/C][C]% significant tests[/C][C]OK/NOK[/C][/ROW]
[ROW][C]1% type I error level[/C][C]0[/C][C] 0[/C][C]OK[/C][/ROW]
[ROW][C]5% type I error level[/C][C]7[/C][C]0.0853659[/C][C]NOK[/C][/ROW]
[ROW][C]10% type I error level[/C][C]12[/C][C]0.146341[/C][C]NOK[/C][/ROW]
[/TABLE]
Source: https://freestatistics.org/blog/index.php?pk=286774&T=6

Globally Unique Identifier (entire table): ba.freestatistics.org/blog/index.php?pk=286774&T=6

As an alternative you can also use a QR Code:  

The GUIDs for individual cells are displayed in the table below:

Meta Analysis of Goldfeld-Quandt test for Heteroskedasticity
Description# significant tests% significant testsOK/NOK
1% type I error level0 0OK
5% type I error level70.0853659NOK
10% type I error level120.146341NOK


Parameters (Session):
par1 = 2 ; par2 = Do not include Seasonal Dummies ; par3 = First and Seasonal Differences (s=12) ; par5 = 2 ;
Parameters (R input):
par1 = 2 ; par2 = Do not include Seasonal Dummies ; par3 = First and Seasonal Differences (s=12) ; par4 = ; par5 = 2 ;
R code (references can be found in the software module):
library(lattice)
library(lmtest)
n25 <- 25 #minimum number of obs. for Goldfeld-Quandt test
mywarning <- ''
par1 <- as.numeric(par1)
if(is.na(par1)) {
par1 <- 1
mywarning = 'Warning: you did not specify the column number of the endogenous series! The first column was selected by default.'
}
if (par4=='') par4 <- 0
par4 <- as.numeric(par4)
if (par5=='') par5 <- 0
par5 <- as.numeric(par5)
x <- na.omit(t(y))
k <- length(x[1,])
n <- length(x[,1])
x1 <- cbind(x[,par1], x[,1:k!=par1])
mycolnames <- c(colnames(x)[par1], colnames(x)[1:k!=par1])
colnames(x1) <- mycolnames #colnames(x)[par1]
x <- x1
if (par3 == 'First Differences'){
(n <- n -1)
x2 <- array(0, dim=c(n,k), dimnames=list(1:n, paste('(1-B)',colnames(x),sep='')))
for (i in 1:n) {
for (j in 1:k) {
x2[i,j] <- x[i+1,j] - x[i,j]
}
}
x <- x2
}
if (par3 == 'Seasonal Differences (s=12)'){
(n <- n - 12)
x2 <- array(0, dim=c(n,k), dimnames=list(1:n, paste('(1-B12)',colnames(x),sep='')))
for (i in 1:n) {
for (j in 1:k) {
x2[i,j] <- x[i+12,j] - x[i,j]
}
}
x <- x2
}
if (par3 == 'First and Seasonal Differences (s=12)'){
(n <- n -1)
x2 <- array(0, dim=c(n,k), dimnames=list(1:n, paste('(1-B)',colnames(x),sep='')))
for (i in 1:n) {
for (j in 1:k) {
x2[i,j] <- x[i+1,j] - x[i,j]
}
}
x <- x2
(n <- n - 12)
x2 <- array(0, dim=c(n,k), dimnames=list(1:n, paste('(1-B12)',colnames(x),sep='')))
for (i in 1:n) {
for (j in 1:k) {
x2[i,j] <- x[i+12,j] - x[i,j]
}
}
x <- x2
}
if(par4 > 0) {
x2 <- array(0, dim=c(n-par4,par4), dimnames=list(1:(n-par4), paste(colnames(x)[par1],'(t-',1:par4,')',sep='')))
for (i in 1:(n-par4)) {
for (j in 1:par4) {
x2[i,j] <- x[i+par4-j,par1]
}
}
x <- cbind(x[(par4+1):n,], x2)
n <- n - par4
}
if(par5 > 0) {
x2 <- array(0, dim=c(n-par5*12,par5), dimnames=list(1:(n-par5*12), paste(colnames(x)[par1],'(t-',1:par5,'s)',sep='')))
for (i in 1:(n-par5*12)) {
for (j in 1:par5) {
x2[i,j] <- x[i+par5*12-j*12,par1]
}
}
x <- cbind(x[(par5*12+1):n,], x2)
n <- n - par5*12
}
if (par2 == 'Include Monthly Dummies'){
x2 <- array(0, dim=c(n,11), dimnames=list(1:n, paste('M', seq(1:11), sep ='')))
for (i in 1:11){
x2[seq(i,n,12),i] <- 1
}
x <- cbind(x, x2)
}
if (par2 == 'Include Quarterly Dummies'){
x2 <- array(0, dim=c(n,3), dimnames=list(1:n, paste('Q', seq(1:3), sep ='')))
for (i in 1:3){
x2[seq(i,n,4),i] <- 1
}
x <- cbind(x, x2)
}
(k <- length(x[n,]))
if (par3 == 'Linear Trend'){
x <- cbind(x, c(1:n))
colnames(x)[k+1] <- 't'
}
x
(k <- length(x[n,]))
head(x)
df <- as.data.frame(x)
(mylm <- lm(df))
(mysum <- summary(mylm))
if (n > n25) {
kp3 <- k + 3
nmkm3 <- n - k - 3
gqarr <- array(NA, dim=c(nmkm3-kp3+1,3))
numgqtests <- 0
numsignificant1 <- 0
numsignificant5 <- 0
numsignificant10 <- 0
for (mypoint in kp3:nmkm3) {
j <- 0
numgqtests <- numgqtests + 1
for (myalt in c('greater', 'two.sided', 'less')) {
j <- j + 1
gqarr[mypoint-kp3+1,j] <- gqtest(mylm, point=mypoint, alternative=myalt)$p.value
}
if (gqarr[mypoint-kp3+1,2] < 0.01) numsignificant1 <- numsignificant1 + 1
if (gqarr[mypoint-kp3+1,2] < 0.05) numsignificant5 <- numsignificant5 + 1
if (gqarr[mypoint-kp3+1,2] < 0.10) numsignificant10 <- numsignificant10 + 1
}
gqarr
}
bitmap(file='test0.png')
plot(x[,1], type='l', main='Actuals and Interpolation', ylab='value of Actuals and Interpolation (dots)', xlab='time or index')
points(x[,1]-mysum$resid)
grid()
dev.off()
bitmap(file='test1.png')
plot(mysum$resid, type='b', pch=19, main='Residuals', ylab='value of Residuals', xlab='time or index')
grid()
dev.off()
bitmap(file='test2.png')
hist(mysum$resid, main='Residual Histogram', xlab='values of Residuals')
grid()
dev.off()
bitmap(file='test3.png')
densityplot(~mysum$resid,col='black',main='Residual Density Plot', xlab='values of Residuals')
dev.off()
bitmap(file='test4.png')
qqnorm(mysum$resid, main='Residual Normal Q-Q Plot')
qqline(mysum$resid)
grid()
dev.off()
(myerror <- as.ts(mysum$resid))
bitmap(file='test5.png')
dum <- cbind(lag(myerror,k=1),myerror)
dum
dum1 <- dum[2:length(myerror),]
dum1
z <- as.data.frame(dum1)
z
plot(z,main=paste('Residual Lag plot, lowess, and regression line'), ylab='values of Residuals', xlab='lagged values of Residuals')
lines(lowess(z))
abline(lm(z))
grid()
dev.off()
bitmap(file='test6.png')
acf(mysum$resid, lag.max=length(mysum$resid)/2, main='Residual Autocorrelation Function')
grid()
dev.off()
bitmap(file='test7.png')
pacf(mysum$resid, lag.max=length(mysum$resid)/2, main='Residual Partial Autocorrelation Function')
grid()
dev.off()
bitmap(file='test8.png')
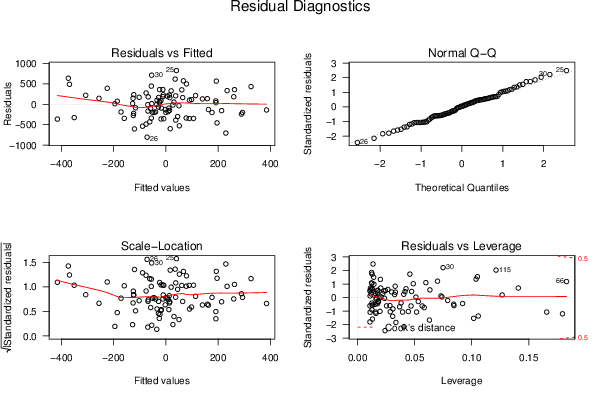
opar <- par(mfrow = c(2,2), oma = c(0, 0, 1.1, 0))
plot(mylm, las = 1, sub='Residual Diagnostics')
par(opar)
dev.off()
if (n > n25) {
bitmap(file='test9.png')
plot(kp3:nmkm3,gqarr[,2], main='Goldfeld-Quandt test',ylab='2-sided p-value',xlab='breakpoint')
grid()
dev.off()
}
load(file='createtable')
a<-table.start()
a<-table.row.start(a)
a<-table.element(a, 'Multiple Linear Regression - Estimated Regression Equation', 1, TRUE)
a<-table.row.end(a)
myeq <- colnames(x)[1]
myeq <- paste(myeq, '[t] = ', sep='')
for (i in 1:k){
if (mysum$coefficients[i,1] > 0) myeq <- paste(myeq, '+', '')
myeq <- paste(myeq, signif(mysum$coefficients[i,1],6), sep=' ')
if (rownames(mysum$coefficients)[i] != '(Intercept)') {
myeq <- paste(myeq, rownames(mysum$coefficients)[i], sep='')
if (rownames(mysum$coefficients)[i] != 't') myeq <- paste(myeq, '[t]', sep='')
}
}
myeq <- paste(myeq, ' + e[t]')
a<-table.row.start(a)
a<-table.element(a, myeq)
a<-table.row.end(a)
a<-table.row.start(a)
a<-table.element(a, mywarning)
a<-table.row.end(a)
a<-table.end(a)
table.save(a,file='mytable1.tab')
a<-table.start()
a<-table.row.start(a)
a<-table.element(a,hyperlink('ols1.htm','Multiple Linear Regression - Ordinary Least Squares',''), 6, TRUE)
a<-table.row.end(a)
a<-table.row.start(a)
a<-table.element(a,'Variable',header=TRUE)
a<-table.element(a,'Parameter',header=TRUE)
a<-table.element(a,'S.D.',header=TRUE)
a<-table.element(a,'T-STAT
H0: parameter = 0',header=TRUE)
a<-table.element(a,'2-tail p-value',header=TRUE)
a<-table.element(a,'1-tail p-value',header=TRUE)
a<-table.row.end(a)
for (i in 1:k){
a<-table.row.start(a)
a<-table.element(a,rownames(mysum$coefficients)[i],header=TRUE)
a<-table.element(a,formatC(signif(mysum$coefficients[i,1],5),format='g',flag='+'))
a<-table.element(a,formatC(signif(mysum$coefficients[i,2],5),format='g',flag=' '))
a<-table.element(a,formatC(signif(mysum$coefficients[i,3],4),format='e',flag='+'))
a<-table.element(a,formatC(signif(mysum$coefficients[i,4],4),format='g',flag=' '))
a<-table.element(a,formatC(signif(mysum$coefficients[i,4]/2,4),format='g',flag=' '))
a<-table.row.end(a)
}
a<-table.end(a)
table.save(a,file='mytable2.tab')
a<-table.start()
a<-table.row.start(a)
a<-table.element(a, 'Multiple Linear Regression - Regression Statistics', 2, TRUE)
a<-table.row.end(a)
a<-table.row.start(a)
a<-table.element(a, 'Multiple R',1,TRUE)
a<-table.element(a,formatC(signif(sqrt(mysum$r.squared),6),format='g',flag=' '))
a<-table.row.end(a)
a<-table.row.start(a)
a<-table.element(a, 'R-squared',1,TRUE)
a<-table.element(a,formatC(signif(mysum$r.squared,6),format='g',flag=' '))
a<-table.row.end(a)
a<-table.row.start(a)
a<-table.element(a, 'Adjusted R-squared',1,TRUE)
a<-table.element(a,formatC(signif(mysum$adj.r.squared,6),format='g',flag=' '))
a<-table.row.end(a)
a<-table.row.start(a)
a<-table.element(a, 'F-TEST (value)',1,TRUE)
a<-table.element(a,formatC(signif(mysum$fstatistic[1],6),format='g',flag=' '))
a<-table.row.end(a)
a<-table.row.start(a)
a<-table.element(a, 'F-TEST (DF numerator)',1,TRUE)
a<-table.element(a, signif(mysum$fstatistic[2],6))
a<-table.row.end(a)
a<-table.row.start(a)
a<-table.element(a, 'F-TEST (DF denominator)',1,TRUE)
a<-table.element(a, signif(mysum$fstatistic[3],6))
a<-table.row.end(a)
a<-table.row.start(a)
a<-table.element(a, 'p-value',1,TRUE)
a<-table.element(a,formatC(signif(1-pf(mysum$fstatistic[1],mysum$fstatistic[2],mysum$fstatistic[3]),6),format='g',flag=' '))
a<-table.row.end(a)
a<-table.row.start(a)
a<-table.element(a, 'Multiple Linear Regression - Residual Statistics', 2, TRUE)
a<-table.row.end(a)
a<-table.row.start(a)
a<-table.element(a, 'Residual Standard Deviation',1,TRUE)
a<-table.element(a,formatC(signif(mysum$sigma,6),format='g',flag=' '))
a<-table.row.end(a)
a<-table.row.start(a)
a<-table.element(a, 'Sum Squared Residuals',1,TRUE)
a<-table.element(a,formatC(signif(sum(myerror*myerror),6),format='g',flag=' '))
a<-table.row.end(a)
a<-table.end(a)
table.save(a,file='mytable3.tab')
if(n < 200) {
a<-table.start()
a<-table.row.start(a)
a<-table.element(a, 'Multiple Linear Regression - Actuals, Interpolation, and Residuals', 4, TRUE)
a<-table.row.end(a)
a<-table.row.start(a)
a<-table.element(a, 'Time or Index', 1, TRUE)
a<-table.element(a, 'Actuals', 1, TRUE)
a<-table.element(a, 'Interpolation
Forecast', 1, TRUE)
a<-table.element(a, 'Residuals
Prediction Error', 1, TRUE)
a<-table.row.end(a)
for (i in 1:n) {
a<-table.row.start(a)
a<-table.element(a,i, 1, TRUE)
a<-table.element(a,formatC(signif(x[i],6),format='g',flag=' '))
a<-table.element(a,formatC(signif(x[i]-mysum$resid[i],6),format='g',flag=' '))
a<-table.element(a,formatC(signif(mysum$resid[i],6),format='g',flag=' '))
a<-table.row.end(a)
}
a<-table.end(a)
table.save(a,file='mytable4.tab')
if (n > n25) {
a<-table.start()
a<-table.row.start(a)
a<-table.element(a,'Goldfeld-Quandt test for Heteroskedasticity',4,TRUE)
a<-table.row.end(a)
a<-table.row.start(a)
a<-table.element(a,'p-values',header=TRUE)
a<-table.element(a,'Alternative Hypothesis',3,header=TRUE)
a<-table.row.end(a)
a<-table.row.start(a)
a<-table.element(a,'breakpoint index',header=TRUE)
a<-table.element(a,'greater',header=TRUE)
a<-table.element(a,'2-sided',header=TRUE)
a<-table.element(a,'less',header=TRUE)
a<-table.row.end(a)
for (mypoint in kp3:nmkm3) {
a<-table.row.start(a)
a<-table.element(a,mypoint,header=TRUE)
a<-table.element(a,formatC(signif(gqarr[mypoint-kp3+1,1],6),format='g',flag=' '))
a<-table.element(a,formatC(signif(gqarr[mypoint-kp3+1,2],6),format='g',flag=' '))
a<-table.element(a,formatC(signif(gqarr[mypoint-kp3+1,3],6),format='g',flag=' '))
a<-table.row.end(a)
}
a<-table.end(a)
table.save(a,file='mytable5.tab')
a<-table.start()
a<-table.row.start(a)
a<-table.element(a,'Meta Analysis of Goldfeld-Quandt test for Heteroskedasticity',4,TRUE)
a<-table.row.end(a)
a<-table.row.start(a)
a<-table.element(a,'Description',header=TRUE)
a<-table.element(a,'# significant tests',header=TRUE)
a<-table.element(a,'% significant tests',header=TRUE)
a<-table.element(a,'OK/NOK',header=TRUE)
a<-table.row.end(a)
a<-table.row.start(a)
a<-table.element(a,'1% type I error level',header=TRUE)
a<-table.element(a,signif(numsignificant1,6))
a<-table.element(a,formatC(signif(numsignificant1/numgqtests,6),format='g',flag=' '))
if (numsignificant1/numgqtests < 0.01) dum <- 'OK' else dum <- 'NOK'
a<-table.element(a,dum)
a<-table.row.end(a)
a<-table.row.start(a)
a<-table.element(a,'5% type I error level',header=TRUE)
a<-table.element(a,signif(numsignificant5,6))
a<-table.element(a,signif(numsignificant5/numgqtests,6))
if (numsignificant5/numgqtests < 0.05) dum <- 'OK' else dum <- 'NOK'
a<-table.element(a,dum)
a<-table.row.end(a)
a<-table.row.start(a)
a<-table.element(a,'10% type I error level',header=TRUE)
a<-table.element(a,signif(numsignificant10,6))
a<-table.element(a,signif(numsignificant10/numgqtests,6))
if (numsignificant10/numgqtests < 0.1) dum <- 'OK' else dum <- 'NOK'
a<-table.element(a,dum)
a<-table.row.end(a)
a<-table.end(a)
table.save(a,file='mytable6.tab')
}
}