Free Statistics

of Irreproducible Research!

Author's title

Author*The author of this computation has been verified*
R Software Modulerwasp_autocorrelation.wasp
Title produced by software(Partial) Autocorrelation Function
Date of computationThu, 17 Dec 2015 13:37:49 +0000
Cite this page as followsStatistical Computations at FreeStatistics.org, Office for Research Development and Education, URL https://freestatistics.org/blog/index.php?v=date/2015/Dec/17/t1450359483wo5afdy6btz067d.htm/, Retrieved Thu, 16 May 2024 15:14:16 +0000
Statistical Computations at FreeStatistics.org, Office for Research Development and Education, URL https://freestatistics.org/blog/index.php?pk=286799, Retrieved Thu, 16 May 2024 15:14:16 +0000
QR Codes:

Original text written by user:
IsPrivate?No (this computation is public)
User-defined keywords
Estimated Impact93
Family? (F = Feedback message, R = changed R code, M = changed R Module, P = changed Parameters, D = changed Data)
-     [Univariate Data Series] [] [2015-12-17 13:13:10] [c4d175d45982400f45768592120a8602]
- RMP     [(Partial) Autocorrelation Function] [] [2015-12-17 13:37:49] [0f06e4fdd8087d4b3abca42184bf2a00] [Current]
- RMPD      [Classical Decomposition] [] [2015-12-17 13:44:23] [c4d175d45982400f45768592120a8602]
- RMP         [Exponential Smoothing] [] [2015-12-17 13:51:34] [c4d175d45982400f45768592120a8602]
Feedback Forum

Post a new message
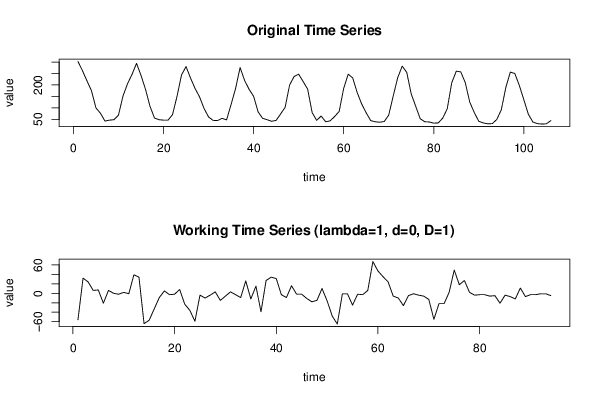
Dataseries X:
302
262
218
175
100
77
43
47
49
69
152
205
246
294
242
181
107
56
49
47
47
71
151
244
280
230
185
148
98
61
46
45
55
48
115
185
276
220
181
151
83
55
49
42
46
74
103
200
237
247
215
182
80
46
65
40
44
63
85
185
247
231
167
117
79
45
40
38
41
69
152
232
282
255
161
107
53
40
39
34
35
56
97
210
260
257
210
125
80
42
35
31
32
50
92
189
256
250
198
136
73
39
32
30
31
45


Summary of computational transaction
Raw Inputview raw input (R code)
Raw Outputview raw output of R engine
Computing time1 seconds
R Server'Sir Ronald Aylmer Fisher' @ fisher.wessa.net

\begin{tabular}{lllllllll}
\hline
Summary of computational transaction \tabularnewline
Raw Input & view raw input (R code)  \tabularnewline
Raw Output & view raw output of R engine  \tabularnewline
Computing time & 1 seconds \tabularnewline
R Server & 'Sir Ronald Aylmer Fisher' @ fisher.wessa.net \tabularnewline
\hline
\end{tabular}
%Source: https://freestatistics.org/blog/index.php?pk=286799&T=0

[TABLE]
[ROW][C]Summary of computational transaction[/C][/ROW]
[ROW][C]Raw Input[/C][C]view raw input (R code) [/C][/ROW]
[ROW][C]Raw Output[/C][C]view raw output of R engine [/C][/ROW]
[ROW][C]Computing time[/C][C]1 seconds[/C][/ROW]
[ROW][C]R Server[/C][C]'Sir Ronald Aylmer Fisher' @ fisher.wessa.net[/C][/ROW]
[/TABLE]
Source: https://freestatistics.org/blog/index.php?pk=286799&T=0

Globally Unique Identifier (entire table): ba.freestatistics.org/blog/index.php?pk=286799&T=0

As an alternative you can also use a QR Code:  

The GUIDs for individual cells are displayed in the table below:

Summary of computational transaction
Raw Inputview raw input (R code)
Raw Outputview raw output of R engine
Computing time1 seconds
R Server'Sir Ronald Aylmer Fisher' @ fisher.wessa.net


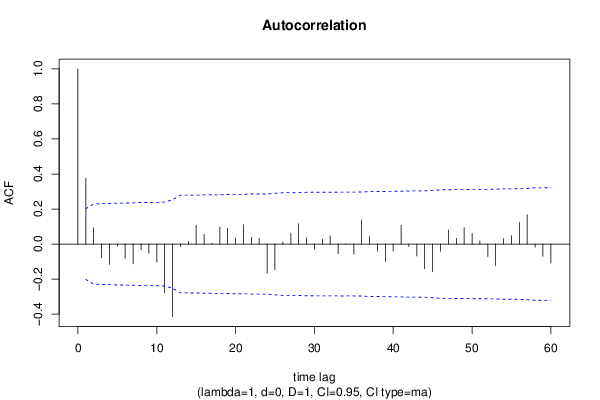
Autocorrelation Function
Time lag kACF(k)T-STATP-value
10.3760823.64630.000218
20.0928330.90.185197
3-0.078421-0.76030.224484
4-0.116698-1.13140.130376
5-0.011804-0.11440.454563
6-0.082145-0.79640.213896
7-0.112661-1.09230.138748
8-0.032004-0.31030.378515
9-0.052945-0.51330.304467
10-0.101733-0.98630.163248
11-0.27851-2.70030.004109
12-0.414605-4.01975.9e-05
13-0.014647-0.1420.443687
140.0155330.15060.440307
150.106871.03610.151397
160.0549280.53250.297803
170.004250.04120.483609
180.0974460.94480.173597
190.0903550.8760.191626
200.0348220.33760.368203
210.1096241.06280.145288
220.0386690.37490.354285
230.0330940.32090.374515
24-0.166186-1.61120.05524
25-0.146985-1.42510.078724
260.0108790.10550.458112
270.0615190.59640.276156
280.1160681.12530.131659
290.0353410.34260.366317
30-0.028971-0.28090.38971
310.028010.27160.393277
320.0460480.44640.32815
33-0.054932-0.53260.297787
340.001310.01270.494947
35-0.057756-0.560.288416
360.1377921.33590.092397
370.0432450.41930.337985
38-0.039089-0.3790.352779
39-0.099574-0.96540.16841
40-0.040403-0.39170.348077
410.1067381.03490.151695
42-0.014488-0.14050.444294
43-0.067861-0.65790.256094
44-0.141568-1.37260.086578
45-0.158557-1.53730.063794
46-0.040749-0.39510.34684
470.0795690.77150.221187
480.0323240.31340.377338
490.093250.90410.184128
500.0603690.58530.279874
510.0176950.17160.432077
52-0.071238-0.69070.245735
53-0.122414-1.18680.119139
540.0309060.29960.382553
550.0479240.46460.321633
560.1236121.19850.116874
570.1674021.6230.053967
58-0.017595-0.17060.432457
59-0.069429-0.67310.251256
60-0.107869-1.04580.149161

\begin{tabular}{lllllllll}
\hline
Autocorrelation Function \tabularnewline
Time lag k & ACF(k) & T-STAT & P-value \tabularnewline
1 & 0.376082 & 3.6463 & 0.000218 \tabularnewline
2 & 0.092833 & 0.9 & 0.185197 \tabularnewline
3 & -0.078421 & -0.7603 & 0.224484 \tabularnewline
4 & -0.116698 & -1.1314 & 0.130376 \tabularnewline
5 & -0.011804 & -0.1144 & 0.454563 \tabularnewline
6 & -0.082145 & -0.7964 & 0.213896 \tabularnewline
7 & -0.112661 & -1.0923 & 0.138748 \tabularnewline
8 & -0.032004 & -0.3103 & 0.378515 \tabularnewline
9 & -0.052945 & -0.5133 & 0.304467 \tabularnewline
10 & -0.101733 & -0.9863 & 0.163248 \tabularnewline
11 & -0.27851 & -2.7003 & 0.004109 \tabularnewline
12 & -0.414605 & -4.0197 & 5.9e-05 \tabularnewline
13 & -0.014647 & -0.142 & 0.443687 \tabularnewline
14 & 0.015533 & 0.1506 & 0.440307 \tabularnewline
15 & 0.10687 & 1.0361 & 0.151397 \tabularnewline
16 & 0.054928 & 0.5325 & 0.297803 \tabularnewline
17 & 0.00425 & 0.0412 & 0.483609 \tabularnewline
18 & 0.097446 & 0.9448 & 0.173597 \tabularnewline
19 & 0.090355 & 0.876 & 0.191626 \tabularnewline
20 & 0.034822 & 0.3376 & 0.368203 \tabularnewline
21 & 0.109624 & 1.0628 & 0.145288 \tabularnewline
22 & 0.038669 & 0.3749 & 0.354285 \tabularnewline
23 & 0.033094 & 0.3209 & 0.374515 \tabularnewline
24 & -0.166186 & -1.6112 & 0.05524 \tabularnewline
25 & -0.146985 & -1.4251 & 0.078724 \tabularnewline
26 & 0.010879 & 0.1055 & 0.458112 \tabularnewline
27 & 0.061519 & 0.5964 & 0.276156 \tabularnewline
28 & 0.116068 & 1.1253 & 0.131659 \tabularnewline
29 & 0.035341 & 0.3426 & 0.366317 \tabularnewline
30 & -0.028971 & -0.2809 & 0.38971 \tabularnewline
31 & 0.02801 & 0.2716 & 0.393277 \tabularnewline
32 & 0.046048 & 0.4464 & 0.32815 \tabularnewline
33 & -0.054932 & -0.5326 & 0.297787 \tabularnewline
34 & 0.00131 & 0.0127 & 0.494947 \tabularnewline
35 & -0.057756 & -0.56 & 0.288416 \tabularnewline
36 & 0.137792 & 1.3359 & 0.092397 \tabularnewline
37 & 0.043245 & 0.4193 & 0.337985 \tabularnewline
38 & -0.039089 & -0.379 & 0.352779 \tabularnewline
39 & -0.099574 & -0.9654 & 0.16841 \tabularnewline
40 & -0.040403 & -0.3917 & 0.348077 \tabularnewline
41 & 0.106738 & 1.0349 & 0.151695 \tabularnewline
42 & -0.014488 & -0.1405 & 0.444294 \tabularnewline
43 & -0.067861 & -0.6579 & 0.256094 \tabularnewline
44 & -0.141568 & -1.3726 & 0.086578 \tabularnewline
45 & -0.158557 & -1.5373 & 0.063794 \tabularnewline
46 & -0.040749 & -0.3951 & 0.34684 \tabularnewline
47 & 0.079569 & 0.7715 & 0.221187 \tabularnewline
48 & 0.032324 & 0.3134 & 0.377338 \tabularnewline
49 & 0.09325 & 0.9041 & 0.184128 \tabularnewline
50 & 0.060369 & 0.5853 & 0.279874 \tabularnewline
51 & 0.017695 & 0.1716 & 0.432077 \tabularnewline
52 & -0.071238 & -0.6907 & 0.245735 \tabularnewline
53 & -0.122414 & -1.1868 & 0.119139 \tabularnewline
54 & 0.030906 & 0.2996 & 0.382553 \tabularnewline
55 & 0.047924 & 0.4646 & 0.321633 \tabularnewline
56 & 0.123612 & 1.1985 & 0.116874 \tabularnewline
57 & 0.167402 & 1.623 & 0.053967 \tabularnewline
58 & -0.017595 & -0.1706 & 0.432457 \tabularnewline
59 & -0.069429 & -0.6731 & 0.251256 \tabularnewline
60 & -0.107869 & -1.0458 & 0.149161 \tabularnewline
\hline
\end{tabular}
%Source: https://freestatistics.org/blog/index.php?pk=286799&T=1

[TABLE]
[ROW][C]Autocorrelation Function[/C][/ROW]
[ROW][C]Time lag k[/C][C]ACF(k)[/C][C]T-STAT[/C][C]P-value[/C][/ROW]
[ROW][C]1[/C][C]0.376082[/C][C]3.6463[/C][C]0.000218[/C][/ROW]
[ROW][C]2[/C][C]0.092833[/C][C]0.9[/C][C]0.185197[/C][/ROW]
[ROW][C]3[/C][C]-0.078421[/C][C]-0.7603[/C][C]0.224484[/C][/ROW]
[ROW][C]4[/C][C]-0.116698[/C][C]-1.1314[/C][C]0.130376[/C][/ROW]
[ROW][C]5[/C][C]-0.011804[/C][C]-0.1144[/C][C]0.454563[/C][/ROW]
[ROW][C]6[/C][C]-0.082145[/C][C]-0.7964[/C][C]0.213896[/C][/ROW]
[ROW][C]7[/C][C]-0.112661[/C][C]-1.0923[/C][C]0.138748[/C][/ROW]
[ROW][C]8[/C][C]-0.032004[/C][C]-0.3103[/C][C]0.378515[/C][/ROW]
[ROW][C]9[/C][C]-0.052945[/C][C]-0.5133[/C][C]0.304467[/C][/ROW]
[ROW][C]10[/C][C]-0.101733[/C][C]-0.9863[/C][C]0.163248[/C][/ROW]
[ROW][C]11[/C][C]-0.27851[/C][C]-2.7003[/C][C]0.004109[/C][/ROW]
[ROW][C]12[/C][C]-0.414605[/C][C]-4.0197[/C][C]5.9e-05[/C][/ROW]
[ROW][C]13[/C][C]-0.014647[/C][C]-0.142[/C][C]0.443687[/C][/ROW]
[ROW][C]14[/C][C]0.015533[/C][C]0.1506[/C][C]0.440307[/C][/ROW]
[ROW][C]15[/C][C]0.10687[/C][C]1.0361[/C][C]0.151397[/C][/ROW]
[ROW][C]16[/C][C]0.054928[/C][C]0.5325[/C][C]0.297803[/C][/ROW]
[ROW][C]17[/C][C]0.00425[/C][C]0.0412[/C][C]0.483609[/C][/ROW]
[ROW][C]18[/C][C]0.097446[/C][C]0.9448[/C][C]0.173597[/C][/ROW]
[ROW][C]19[/C][C]0.090355[/C][C]0.876[/C][C]0.191626[/C][/ROW]
[ROW][C]20[/C][C]0.034822[/C][C]0.3376[/C][C]0.368203[/C][/ROW]
[ROW][C]21[/C][C]0.109624[/C][C]1.0628[/C][C]0.145288[/C][/ROW]
[ROW][C]22[/C][C]0.038669[/C][C]0.3749[/C][C]0.354285[/C][/ROW]
[ROW][C]23[/C][C]0.033094[/C][C]0.3209[/C][C]0.374515[/C][/ROW]
[ROW][C]24[/C][C]-0.166186[/C][C]-1.6112[/C][C]0.05524[/C][/ROW]
[ROW][C]25[/C][C]-0.146985[/C][C]-1.4251[/C][C]0.078724[/C][/ROW]
[ROW][C]26[/C][C]0.010879[/C][C]0.1055[/C][C]0.458112[/C][/ROW]
[ROW][C]27[/C][C]0.061519[/C][C]0.5964[/C][C]0.276156[/C][/ROW]
[ROW][C]28[/C][C]0.116068[/C][C]1.1253[/C][C]0.131659[/C][/ROW]
[ROW][C]29[/C][C]0.035341[/C][C]0.3426[/C][C]0.366317[/C][/ROW]
[ROW][C]30[/C][C]-0.028971[/C][C]-0.2809[/C][C]0.38971[/C][/ROW]
[ROW][C]31[/C][C]0.02801[/C][C]0.2716[/C][C]0.393277[/C][/ROW]
[ROW][C]32[/C][C]0.046048[/C][C]0.4464[/C][C]0.32815[/C][/ROW]
[ROW][C]33[/C][C]-0.054932[/C][C]-0.5326[/C][C]0.297787[/C][/ROW]
[ROW][C]34[/C][C]0.00131[/C][C]0.0127[/C][C]0.494947[/C][/ROW]
[ROW][C]35[/C][C]-0.057756[/C][C]-0.56[/C][C]0.288416[/C][/ROW]
[ROW][C]36[/C][C]0.137792[/C][C]1.3359[/C][C]0.092397[/C][/ROW]
[ROW][C]37[/C][C]0.043245[/C][C]0.4193[/C][C]0.337985[/C][/ROW]
[ROW][C]38[/C][C]-0.039089[/C][C]-0.379[/C][C]0.352779[/C][/ROW]
[ROW][C]39[/C][C]-0.099574[/C][C]-0.9654[/C][C]0.16841[/C][/ROW]
[ROW][C]40[/C][C]-0.040403[/C][C]-0.3917[/C][C]0.348077[/C][/ROW]
[ROW][C]41[/C][C]0.106738[/C][C]1.0349[/C][C]0.151695[/C][/ROW]
[ROW][C]42[/C][C]-0.014488[/C][C]-0.1405[/C][C]0.444294[/C][/ROW]
[ROW][C]43[/C][C]-0.067861[/C][C]-0.6579[/C][C]0.256094[/C][/ROW]
[ROW][C]44[/C][C]-0.141568[/C][C]-1.3726[/C][C]0.086578[/C][/ROW]
[ROW][C]45[/C][C]-0.158557[/C][C]-1.5373[/C][C]0.063794[/C][/ROW]
[ROW][C]46[/C][C]-0.040749[/C][C]-0.3951[/C][C]0.34684[/C][/ROW]
[ROW][C]47[/C][C]0.079569[/C][C]0.7715[/C][C]0.221187[/C][/ROW]
[ROW][C]48[/C][C]0.032324[/C][C]0.3134[/C][C]0.377338[/C][/ROW]
[ROW][C]49[/C][C]0.09325[/C][C]0.9041[/C][C]0.184128[/C][/ROW]
[ROW][C]50[/C][C]0.060369[/C][C]0.5853[/C][C]0.279874[/C][/ROW]
[ROW][C]51[/C][C]0.017695[/C][C]0.1716[/C][C]0.432077[/C][/ROW]
[ROW][C]52[/C][C]-0.071238[/C][C]-0.6907[/C][C]0.245735[/C][/ROW]
[ROW][C]53[/C][C]-0.122414[/C][C]-1.1868[/C][C]0.119139[/C][/ROW]
[ROW][C]54[/C][C]0.030906[/C][C]0.2996[/C][C]0.382553[/C][/ROW]
[ROW][C]55[/C][C]0.047924[/C][C]0.4646[/C][C]0.321633[/C][/ROW]
[ROW][C]56[/C][C]0.123612[/C][C]1.1985[/C][C]0.116874[/C][/ROW]
[ROW][C]57[/C][C]0.167402[/C][C]1.623[/C][C]0.053967[/C][/ROW]
[ROW][C]58[/C][C]-0.017595[/C][C]-0.1706[/C][C]0.432457[/C][/ROW]
[ROW][C]59[/C][C]-0.069429[/C][C]-0.6731[/C][C]0.251256[/C][/ROW]
[ROW][C]60[/C][C]-0.107869[/C][C]-1.0458[/C][C]0.149161[/C][/ROW]
[/TABLE]
Source: https://freestatistics.org/blog/index.php?pk=286799&T=1

Globally Unique Identifier (entire table): ba.freestatistics.org/blog/index.php?pk=286799&T=1

As an alternative you can also use a QR Code:  

The GUIDs for individual cells are displayed in the table below:

Autocorrelation Function
Time lag kACF(k)T-STATP-value
10.3760823.64630.000218
20.0928330.90.185197
3-0.078421-0.76030.224484
4-0.116698-1.13140.130376
5-0.011804-0.11440.454563
6-0.082145-0.79640.213896
7-0.112661-1.09230.138748
8-0.032004-0.31030.378515
9-0.052945-0.51330.304467
10-0.101733-0.98630.163248
11-0.27851-2.70030.004109
12-0.414605-4.01975.9e-05
13-0.014647-0.1420.443687
140.0155330.15060.440307
150.106871.03610.151397
160.0549280.53250.297803
170.004250.04120.483609
180.0974460.94480.173597
190.0903550.8760.191626
200.0348220.33760.368203
210.1096241.06280.145288
220.0386690.37490.354285
230.0330940.32090.374515
24-0.166186-1.61120.05524
25-0.146985-1.42510.078724
260.0108790.10550.458112
270.0615190.59640.276156
280.1160681.12530.131659
290.0353410.34260.366317
30-0.028971-0.28090.38971
310.028010.27160.393277
320.0460480.44640.32815
33-0.054932-0.53260.297787
340.001310.01270.494947
35-0.057756-0.560.288416
360.1377921.33590.092397
370.0432450.41930.337985
38-0.039089-0.3790.352779
39-0.099574-0.96540.16841
40-0.040403-0.39170.348077
410.1067381.03490.151695
42-0.014488-0.14050.444294
43-0.067861-0.65790.256094
44-0.141568-1.37260.086578
45-0.158557-1.53730.063794
46-0.040749-0.39510.34684
470.0795690.77150.221187
480.0323240.31340.377338
490.093250.90410.184128
500.0603690.58530.279874
510.0176950.17160.432077
52-0.071238-0.69070.245735
53-0.122414-1.18680.119139
540.0309060.29960.382553
550.0479240.46460.321633
560.1236121.19850.116874
570.1674021.6230.053967
58-0.017595-0.17060.432457
59-0.069429-0.67310.251256
60-0.107869-1.04580.149161


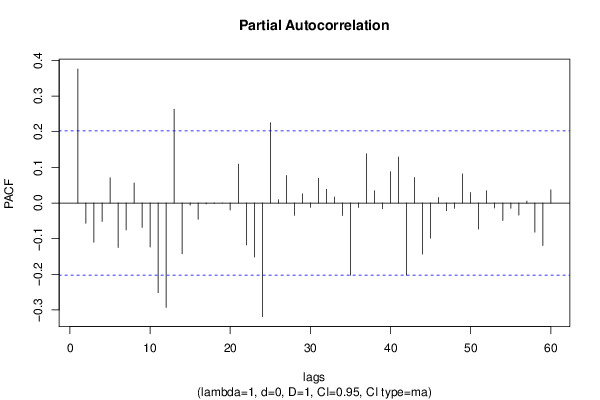
Partial Autocorrelation Function
Time lag kPACF(k)T-STATP-value
10.3760823.64630.000218
2-0.056612-0.54890.292197
3-0.10986-1.06510.144772
4-0.051455-0.49890.309515
50.0709120.68750.246725
6-0.124808-1.21010.114646
7-0.075339-0.73040.233469
80.0561210.54410.293827
9-0.068281-0.6620.254794
10-0.123536-1.19770.117018
11-0.251352-2.43690.008347
12-0.292682-2.83770.002784
130.2628982.54890.006213
14-0.142153-1.37820.085703
15-0.005899-0.05720.477256
16-0.045747-0.44350.3292
17-0.002449-0.02370.490554
18-0.001358-0.01320.494761
19-0.000223-0.00220.499139
20-0.019587-0.18990.424897
210.1091381.05810.146353
22-0.117473-1.13890.12881
23-0.151324-1.46710.072838
24-0.318757-3.09050.001315
250.2252152.18350.015743
260.0092510.08970.464361
270.0772450.74890.227888
28-0.034591-0.33540.369048
290.0256030.24820.40225
30-0.011671-0.11320.455073
310.0694650.67350.251145
320.0383170.37150.35555
330.0168730.16360.435201
34-0.034899-0.33840.367926
35-0.202617-1.96440.026216
36-0.012406-0.12030.452259
370.138331.34120.09155
380.0343920.33340.36977
39-0.016048-0.15560.438345
400.0879040.85230.198118
410.128911.24980.107232
42-0.202392-1.96230.026345
430.0715760.6940.24471
44-0.143121-1.38760.084269
45-0.098532-0.95530.170938
460.0155830.15110.440116
47-0.021451-0.2080.417849
48-0.014794-0.14340.443129
490.0815140.79030.215669
500.029460.28560.387896
51-0.073152-0.70920.239966
520.0345730.33520.369112
53-0.014028-0.1360.446054
54-0.049295-0.47790.316905
55-0.014478-0.14040.444333
56-0.033881-0.32850.371637
570.0053770.05210.479267
58-0.08173-0.79240.21506
59-0.119118-1.15490.125531
600.0368910.35770.360695

\begin{tabular}{lllllllll}
\hline
Partial Autocorrelation Function \tabularnewline
Time lag k & PACF(k) & T-STAT & P-value \tabularnewline
1 & 0.376082 & 3.6463 & 0.000218 \tabularnewline
2 & -0.056612 & -0.5489 & 0.292197 \tabularnewline
3 & -0.10986 & -1.0651 & 0.144772 \tabularnewline
4 & -0.051455 & -0.4989 & 0.309515 \tabularnewline
5 & 0.070912 & 0.6875 & 0.246725 \tabularnewline
6 & -0.124808 & -1.2101 & 0.114646 \tabularnewline
7 & -0.075339 & -0.7304 & 0.233469 \tabularnewline
8 & 0.056121 & 0.5441 & 0.293827 \tabularnewline
9 & -0.068281 & -0.662 & 0.254794 \tabularnewline
10 & -0.123536 & -1.1977 & 0.117018 \tabularnewline
11 & -0.251352 & -2.4369 & 0.008347 \tabularnewline
12 & -0.292682 & -2.8377 & 0.002784 \tabularnewline
13 & 0.262898 & 2.5489 & 0.006213 \tabularnewline
14 & -0.142153 & -1.3782 & 0.085703 \tabularnewline
15 & -0.005899 & -0.0572 & 0.477256 \tabularnewline
16 & -0.045747 & -0.4435 & 0.3292 \tabularnewline
17 & -0.002449 & -0.0237 & 0.490554 \tabularnewline
18 & -0.001358 & -0.0132 & 0.494761 \tabularnewline
19 & -0.000223 & -0.0022 & 0.499139 \tabularnewline
20 & -0.019587 & -0.1899 & 0.424897 \tabularnewline
21 & 0.109138 & 1.0581 & 0.146353 \tabularnewline
22 & -0.117473 & -1.1389 & 0.12881 \tabularnewline
23 & -0.151324 & -1.4671 & 0.072838 \tabularnewline
24 & -0.318757 & -3.0905 & 0.001315 \tabularnewline
25 & 0.225215 & 2.1835 & 0.015743 \tabularnewline
26 & 0.009251 & 0.0897 & 0.464361 \tabularnewline
27 & 0.077245 & 0.7489 & 0.227888 \tabularnewline
28 & -0.034591 & -0.3354 & 0.369048 \tabularnewline
29 & 0.025603 & 0.2482 & 0.40225 \tabularnewline
30 & -0.011671 & -0.1132 & 0.455073 \tabularnewline
31 & 0.069465 & 0.6735 & 0.251145 \tabularnewline
32 & 0.038317 & 0.3715 & 0.35555 \tabularnewline
33 & 0.016873 & 0.1636 & 0.435201 \tabularnewline
34 & -0.034899 & -0.3384 & 0.367926 \tabularnewline
35 & -0.202617 & -1.9644 & 0.026216 \tabularnewline
36 & -0.012406 & -0.1203 & 0.452259 \tabularnewline
37 & 0.13833 & 1.3412 & 0.09155 \tabularnewline
38 & 0.034392 & 0.3334 & 0.36977 \tabularnewline
39 & -0.016048 & -0.1556 & 0.438345 \tabularnewline
40 & 0.087904 & 0.8523 & 0.198118 \tabularnewline
41 & 0.12891 & 1.2498 & 0.107232 \tabularnewline
42 & -0.202392 & -1.9623 & 0.026345 \tabularnewline
43 & 0.071576 & 0.694 & 0.24471 \tabularnewline
44 & -0.143121 & -1.3876 & 0.084269 \tabularnewline
45 & -0.098532 & -0.9553 & 0.170938 \tabularnewline
46 & 0.015583 & 0.1511 & 0.440116 \tabularnewline
47 & -0.021451 & -0.208 & 0.417849 \tabularnewline
48 & -0.014794 & -0.1434 & 0.443129 \tabularnewline
49 & 0.081514 & 0.7903 & 0.215669 \tabularnewline
50 & 0.02946 & 0.2856 & 0.387896 \tabularnewline
51 & -0.073152 & -0.7092 & 0.239966 \tabularnewline
52 & 0.034573 & 0.3352 & 0.369112 \tabularnewline
53 & -0.014028 & -0.136 & 0.446054 \tabularnewline
54 & -0.049295 & -0.4779 & 0.316905 \tabularnewline
55 & -0.014478 & -0.1404 & 0.444333 \tabularnewline
56 & -0.033881 & -0.3285 & 0.371637 \tabularnewline
57 & 0.005377 & 0.0521 & 0.479267 \tabularnewline
58 & -0.08173 & -0.7924 & 0.21506 \tabularnewline
59 & -0.119118 & -1.1549 & 0.125531 \tabularnewline
60 & 0.036891 & 0.3577 & 0.360695 \tabularnewline
\hline
\end{tabular}
%Source: https://freestatistics.org/blog/index.php?pk=286799&T=2

[TABLE]
[ROW][C]Partial Autocorrelation Function[/C][/ROW]
[ROW][C]Time lag k[/C][C]PACF(k)[/C][C]T-STAT[/C][C]P-value[/C][/ROW]
[ROW][C]1[/C][C]0.376082[/C][C]3.6463[/C][C]0.000218[/C][/ROW]
[ROW][C]2[/C][C]-0.056612[/C][C]-0.5489[/C][C]0.292197[/C][/ROW]
[ROW][C]3[/C][C]-0.10986[/C][C]-1.0651[/C][C]0.144772[/C][/ROW]
[ROW][C]4[/C][C]-0.051455[/C][C]-0.4989[/C][C]0.309515[/C][/ROW]
[ROW][C]5[/C][C]0.070912[/C][C]0.6875[/C][C]0.246725[/C][/ROW]
[ROW][C]6[/C][C]-0.124808[/C][C]-1.2101[/C][C]0.114646[/C][/ROW]
[ROW][C]7[/C][C]-0.075339[/C][C]-0.7304[/C][C]0.233469[/C][/ROW]
[ROW][C]8[/C][C]0.056121[/C][C]0.5441[/C][C]0.293827[/C][/ROW]
[ROW][C]9[/C][C]-0.068281[/C][C]-0.662[/C][C]0.254794[/C][/ROW]
[ROW][C]10[/C][C]-0.123536[/C][C]-1.1977[/C][C]0.117018[/C][/ROW]
[ROW][C]11[/C][C]-0.251352[/C][C]-2.4369[/C][C]0.008347[/C][/ROW]
[ROW][C]12[/C][C]-0.292682[/C][C]-2.8377[/C][C]0.002784[/C][/ROW]
[ROW][C]13[/C][C]0.262898[/C][C]2.5489[/C][C]0.006213[/C][/ROW]
[ROW][C]14[/C][C]-0.142153[/C][C]-1.3782[/C][C]0.085703[/C][/ROW]
[ROW][C]15[/C][C]-0.005899[/C][C]-0.0572[/C][C]0.477256[/C][/ROW]
[ROW][C]16[/C][C]-0.045747[/C][C]-0.4435[/C][C]0.3292[/C][/ROW]
[ROW][C]17[/C][C]-0.002449[/C][C]-0.0237[/C][C]0.490554[/C][/ROW]
[ROW][C]18[/C][C]-0.001358[/C][C]-0.0132[/C][C]0.494761[/C][/ROW]
[ROW][C]19[/C][C]-0.000223[/C][C]-0.0022[/C][C]0.499139[/C][/ROW]
[ROW][C]20[/C][C]-0.019587[/C][C]-0.1899[/C][C]0.424897[/C][/ROW]
[ROW][C]21[/C][C]0.109138[/C][C]1.0581[/C][C]0.146353[/C][/ROW]
[ROW][C]22[/C][C]-0.117473[/C][C]-1.1389[/C][C]0.12881[/C][/ROW]
[ROW][C]23[/C][C]-0.151324[/C][C]-1.4671[/C][C]0.072838[/C][/ROW]
[ROW][C]24[/C][C]-0.318757[/C][C]-3.0905[/C][C]0.001315[/C][/ROW]
[ROW][C]25[/C][C]0.225215[/C][C]2.1835[/C][C]0.015743[/C][/ROW]
[ROW][C]26[/C][C]0.009251[/C][C]0.0897[/C][C]0.464361[/C][/ROW]
[ROW][C]27[/C][C]0.077245[/C][C]0.7489[/C][C]0.227888[/C][/ROW]
[ROW][C]28[/C][C]-0.034591[/C][C]-0.3354[/C][C]0.369048[/C][/ROW]
[ROW][C]29[/C][C]0.025603[/C][C]0.2482[/C][C]0.40225[/C][/ROW]
[ROW][C]30[/C][C]-0.011671[/C][C]-0.1132[/C][C]0.455073[/C][/ROW]
[ROW][C]31[/C][C]0.069465[/C][C]0.6735[/C][C]0.251145[/C][/ROW]
[ROW][C]32[/C][C]0.038317[/C][C]0.3715[/C][C]0.35555[/C][/ROW]
[ROW][C]33[/C][C]0.016873[/C][C]0.1636[/C][C]0.435201[/C][/ROW]
[ROW][C]34[/C][C]-0.034899[/C][C]-0.3384[/C][C]0.367926[/C][/ROW]
[ROW][C]35[/C][C]-0.202617[/C][C]-1.9644[/C][C]0.026216[/C][/ROW]
[ROW][C]36[/C][C]-0.012406[/C][C]-0.1203[/C][C]0.452259[/C][/ROW]
[ROW][C]37[/C][C]0.13833[/C][C]1.3412[/C][C]0.09155[/C][/ROW]
[ROW][C]38[/C][C]0.034392[/C][C]0.3334[/C][C]0.36977[/C][/ROW]
[ROW][C]39[/C][C]-0.016048[/C][C]-0.1556[/C][C]0.438345[/C][/ROW]
[ROW][C]40[/C][C]0.087904[/C][C]0.8523[/C][C]0.198118[/C][/ROW]
[ROW][C]41[/C][C]0.12891[/C][C]1.2498[/C][C]0.107232[/C][/ROW]
[ROW][C]42[/C][C]-0.202392[/C][C]-1.9623[/C][C]0.026345[/C][/ROW]
[ROW][C]43[/C][C]0.071576[/C][C]0.694[/C][C]0.24471[/C][/ROW]
[ROW][C]44[/C][C]-0.143121[/C][C]-1.3876[/C][C]0.084269[/C][/ROW]
[ROW][C]45[/C][C]-0.098532[/C][C]-0.9553[/C][C]0.170938[/C][/ROW]
[ROW][C]46[/C][C]0.015583[/C][C]0.1511[/C][C]0.440116[/C][/ROW]
[ROW][C]47[/C][C]-0.021451[/C][C]-0.208[/C][C]0.417849[/C][/ROW]
[ROW][C]48[/C][C]-0.014794[/C][C]-0.1434[/C][C]0.443129[/C][/ROW]
[ROW][C]49[/C][C]0.081514[/C][C]0.7903[/C][C]0.215669[/C][/ROW]
[ROW][C]50[/C][C]0.02946[/C][C]0.2856[/C][C]0.387896[/C][/ROW]
[ROW][C]51[/C][C]-0.073152[/C][C]-0.7092[/C][C]0.239966[/C][/ROW]
[ROW][C]52[/C][C]0.034573[/C][C]0.3352[/C][C]0.369112[/C][/ROW]
[ROW][C]53[/C][C]-0.014028[/C][C]-0.136[/C][C]0.446054[/C][/ROW]
[ROW][C]54[/C][C]-0.049295[/C][C]-0.4779[/C][C]0.316905[/C][/ROW]
[ROW][C]55[/C][C]-0.014478[/C][C]-0.1404[/C][C]0.444333[/C][/ROW]
[ROW][C]56[/C][C]-0.033881[/C][C]-0.3285[/C][C]0.371637[/C][/ROW]
[ROW][C]57[/C][C]0.005377[/C][C]0.0521[/C][C]0.479267[/C][/ROW]
[ROW][C]58[/C][C]-0.08173[/C][C]-0.7924[/C][C]0.21506[/C][/ROW]
[ROW][C]59[/C][C]-0.119118[/C][C]-1.1549[/C][C]0.125531[/C][/ROW]
[ROW][C]60[/C][C]0.036891[/C][C]0.3577[/C][C]0.360695[/C][/ROW]
[/TABLE]
Source: https://freestatistics.org/blog/index.php?pk=286799&T=2

Globally Unique Identifier (entire table): ba.freestatistics.org/blog/index.php?pk=286799&T=2

As an alternative you can also use a QR Code:  

The GUIDs for individual cells are displayed in the table below:

Partial Autocorrelation Function
Time lag kPACF(k)T-STATP-value
10.3760823.64630.000218
2-0.056612-0.54890.292197
3-0.10986-1.06510.144772
4-0.051455-0.49890.309515
50.0709120.68750.246725
6-0.124808-1.21010.114646
7-0.075339-0.73040.233469
80.0561210.54410.293827
9-0.068281-0.6620.254794
10-0.123536-1.19770.117018
11-0.251352-2.43690.008347
12-0.292682-2.83770.002784
130.2628982.54890.006213
14-0.142153-1.37820.085703
15-0.005899-0.05720.477256
16-0.045747-0.44350.3292
17-0.002449-0.02370.490554
18-0.001358-0.01320.494761
19-0.000223-0.00220.499139
20-0.019587-0.18990.424897
210.1091381.05810.146353
22-0.117473-1.13890.12881
23-0.151324-1.46710.072838
24-0.318757-3.09050.001315
250.2252152.18350.015743
260.0092510.08970.464361
270.0772450.74890.227888
28-0.034591-0.33540.369048
290.0256030.24820.40225
30-0.011671-0.11320.455073
310.0694650.67350.251145
320.0383170.37150.35555
330.0168730.16360.435201
34-0.034899-0.33840.367926
35-0.202617-1.96440.026216
36-0.012406-0.12030.452259
370.138331.34120.09155
380.0343920.33340.36977
39-0.016048-0.15560.438345
400.0879040.85230.198118
410.128911.24980.107232
42-0.202392-1.96230.026345
430.0715760.6940.24471
44-0.143121-1.38760.084269
45-0.098532-0.95530.170938
460.0155830.15110.440116
47-0.021451-0.2080.417849
48-0.014794-0.14340.443129
490.0815140.79030.215669
500.029460.28560.387896
51-0.073152-0.70920.239966
520.0345730.33520.369112
53-0.014028-0.1360.446054
54-0.049295-0.47790.316905
55-0.014478-0.14040.444333
56-0.033881-0.32850.371637
570.0053770.05210.479267
58-0.08173-0.79240.21506
59-0.119118-1.15490.125531
600.0368910.35770.360695


Parameters (Session):
par1 = 60 ; par2 = 1 ; par3 = 0 ; par4 = 1 ; par5 = 12 ; par6 = MA ; par7 = 0.95 ;
Parameters (R input):
par1 = 60 ; par2 = 1 ; par3 = 0 ; par4 = 1 ; par5 = 12 ; par6 = MA ; par7 = 0.95 ; par8 = ;
R code (references can be found in the software module):
if (par1 == 'Default') {
par1 = 10*log10(length(x))
} else {
par1 <- as.numeric(par1)
}
par2 <- as.numeric(par2)
par3 <- as.numeric(par3)
par4 <- as.numeric(par4)
par5 <- as.numeric(par5)
if (par6 == 'White Noise') par6 <- 'white' else par6 <- 'ma'
par7 <- as.numeric(par7)
if (par8 != '') par8 <- as.numeric(par8)
x <- na.omit(x)
ox <- x
if (par8 == '') {
if (par2 == 0) {
x <- log(x)
} else {
x <- (x ^ par2 - 1) / par2
}
} else {
x <- log(x,base=par8)
}
if (par3 > 0) x <- diff(x,lag=1,difference=par3)
if (par4 > 0) x <- diff(x,lag=par5,difference=par4)
bitmap(file='picts.png')
op <- par(mfrow=c(2,1))
plot(ox,type='l',main='Original Time Series',xlab='time',ylab='value')
if (par8=='') {
mytitle <- paste('Working Time Series (lambda=',par2,', d=',par3,', D=',par4,')',sep='')
mysub <- paste('(lambda=',par2,', d=',par3,', D=',par4,', CI=', par7, ', CI type=',par6,')',sep='')
} else {
mytitle <- paste('Working Time Series (base=',par8,', d=',par3,', D=',par4,')',sep='')
mysub <- paste('(base=',par8,', d=',par3,', D=',par4,', CI=', par7, ', CI type=',par6,')',sep='')
}
plot(x,type='l', main=mytitle,xlab='time',ylab='value')
par(op)
dev.off()
bitmap(file='pic1.png')
racf <- acf(x, par1, main='Autocorrelation', xlab='time lag', ylab='ACF', ci.type=par6, ci=par7, sub=mysub)
dev.off()
bitmap(file='pic2.png')
rpacf <- pacf(x,par1,main='Partial Autocorrelation',xlab='lags',ylab='PACF',sub=mysub)
dev.off()
(myacf <- c(racf$acf))
(mypacf <- c(rpacf$acf))
lengthx <- length(x)
sqrtn <- sqrt(lengthx)
load(file='createtable')
a<-table.start()
a<-table.row.start(a)
a<-table.element(a,'Autocorrelation Function',4,TRUE)
a<-table.row.end(a)
a<-table.row.start(a)
a<-table.element(a,'Time lag k',header=TRUE)
a<-table.element(a,hyperlink('basics.htm','ACF(k)','click here for more information about the Autocorrelation Function'),header=TRUE)
a<-table.element(a,'T-STAT',header=TRUE)
a<-table.element(a,'P-value',header=TRUE)
a<-table.row.end(a)
for (i in 2:(par1+1)) {
a<-table.row.start(a)
a<-table.element(a,i-1,header=TRUE)
a<-table.element(a,round(myacf[i],6))
mytstat <- myacf[i]*sqrtn
a<-table.element(a,round(mytstat,4))
a<-table.element(a,round(1-pt(abs(mytstat),lengthx),6))
a<-table.row.end(a)
}
a<-table.end(a)
table.save(a,file='mytable.tab')
a<-table.start()
a<-table.row.start(a)
a<-table.element(a,'Partial Autocorrelation Function',4,TRUE)
a<-table.row.end(a)
a<-table.row.start(a)
a<-table.element(a,'Time lag k',header=TRUE)
a<-table.element(a,hyperlink('basics.htm','PACF(k)','click here for more information about the Partial Autocorrelation Function'),header=TRUE)
a<-table.element(a,'T-STAT',header=TRUE)
a<-table.element(a,'P-value',header=TRUE)
a<-table.row.end(a)
for (i in 1:par1) {
a<-table.row.start(a)
a<-table.element(a,i,header=TRUE)
a<-table.element(a,round(mypacf[i],6))
mytstat <- mypacf[i]*sqrtn
a<-table.element(a,round(mytstat,4))
a<-table.element(a,round(1-pt(abs(mytstat),lengthx),6))
a<-table.row.end(a)
}
a<-table.end(a)
table.save(a,file='mytable1.tab')