Free Statistics

of Irreproducible Research!

Author's title

Author*The author of this computation has been verified*
R Software Modulerwasp_correlation.wasp
Title produced by softwarePearson Correlation
Date of computationFri, 18 Dec 2015 12:02:58 +0000
Cite this page as followsStatistical Computations at FreeStatistics.org, Office for Research Development and Education, URL https://freestatistics.org/blog/index.php?v=date/2015/Dec/18/t14504419412uu5jjunm4hdpki.htm/, Retrieved Thu, 16 May 2024 11:52:55 +0000
Statistical Computations at FreeStatistics.org, Office for Research Development and Education, URL https://freestatistics.org/blog/index.php?pk=286883, Retrieved Thu, 16 May 2024 11:52:55 +0000
QR Codes:

Original text written by user:
IsPrivate?No (this computation is public)
User-defined keywords
Estimated Impact115
Family? (F = Feedback message, R = changed R code, M = changed R Module, P = changed Parameters, D = changed Data)
-       [Pearson Correlation] [Pearson correlati...] [2015-12-18 12:02:58] [3fd5ab1060e3487adfc241d011cb6ba1] [Current]
Feedback Forum

Post a new message
Dataseries X:
126346
125966
126296
127306
127042
126903
126276
125939
125713
128183
128434
126719
126536
126549
126901
129473
129173
128363
127544
127000
126527
129445
129138
127610
127855
128037
127843
127194
127490
128000
128625
129049
130198
134112
134767
134523
135427
136478
138613
141444
141208
141436
141311
140874
141740
144939
145041
143762
144331
144470
145283
149654
151019
152125
150527
148389
149055
151058
150818
146338
145738
Dataseries Y:
563668
548604
551174
555654
547970
540324
530577
520579
518654
572273
581302
563280
547612
538712
540735
561649
558685
545732
536352
527676
530455
581744
598714
583775
571477
563278
564872
577537
572399
565430
560619
551227
553397
610893
621668
613148
598778
590623
595902
612186
603453
593362
581940
568075
567467
619423
627325
617144
602280
590816
589812
600615
595729
586958
567705
551407
554324
595557
602467
587774
572107


Summary of computational transaction
Raw Inputview raw input (R code)
Raw Outputview raw output of R engine
Computing time3 seconds
R Server'Herman Ole Andreas Wold' @ wold.wessa.net

\begin{tabular}{lllllllll}
\hline
Summary of computational transaction \tabularnewline
Raw Input & view raw input (R code)  \tabularnewline
Raw Output & view raw output of R engine  \tabularnewline
Computing time & 3 seconds \tabularnewline
R Server & 'Herman Ole Andreas Wold' @ wold.wessa.net \tabularnewline
\hline
\end{tabular}
%Source: https://freestatistics.org/blog/index.php?pk=286883&T=0

[TABLE]
[ROW][C]Summary of computational transaction[/C][/ROW]
[ROW][C]Raw Input[/C][C]view raw input (R code) [/C][/ROW]
[ROW][C]Raw Output[/C][C]view raw output of R engine [/C][/ROW]
[ROW][C]Computing time[/C][C]3 seconds[/C][/ROW]
[ROW][C]R Server[/C][C]'Herman Ole Andreas Wold' @ wold.wessa.net[/C][/ROW]
[/TABLE]
Source: https://freestatistics.org/blog/index.php?pk=286883&T=0

Globally Unique Identifier (entire table): ba.freestatistics.org/blog/index.php?pk=286883&T=0

As an alternative you can also use a QR Code:  

The GUIDs for individual cells are displayed in the table below:

Summary of computational transaction
Raw Inputview raw input (R code)
Raw Outputview raw output of R engine
Computing time3 seconds
R Server'Herman Ole Andreas Wold' @ wold.wessa.net


Pearson Product Moment Correlation - Ungrouped Data
StatisticVariable XVariable Y
Mean134986.114754098572870.06557377
Biased Variance78993799.3802741728265646.684225
Biased Standard Deviation8887.8455983592626986.3974380469
Covariance145468383.225683
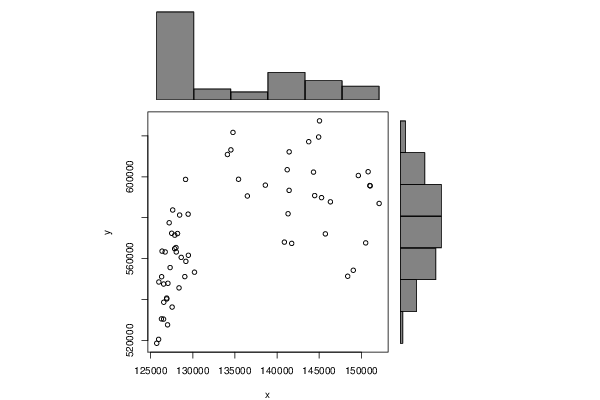
Correlation0.596552422929248
Determination0.355874793302757
T-Test5.70938687544557
p-value (2 sided)3.90459772958707e-07
p-value (1 sided)1.95229886479353e-07
95% CI of Correlation[0.405673723747909, 0.737571952343929]
Degrees of Freedom59
Number of Observations61

\begin{tabular}{lllllllll}
\hline
Pearson Product Moment Correlation - Ungrouped Data \tabularnewline
Statistic & Variable X & Variable Y \tabularnewline
Mean & 134986.114754098 & 572870.06557377 \tabularnewline
Biased Variance & 78993799.3802741 & 728265646.684225 \tabularnewline
Biased Standard Deviation & 8887.84559835926 & 26986.3974380469 \tabularnewline
Covariance & 145468383.225683 \tabularnewline
Correlation & 0.596552422929248 \tabularnewline
Determination & 0.355874793302757 \tabularnewline
T-Test & 5.70938687544557 \tabularnewline
p-value (2 sided) & 3.90459772958707e-07 \tabularnewline
p-value (1 sided) & 1.95229886479353e-07 \tabularnewline
95% CI of Correlation & [0.405673723747909, 0.737571952343929] \tabularnewline
Degrees of Freedom & 59 \tabularnewline
Number of Observations & 61 \tabularnewline
\hline
\end{tabular}
%Source: https://freestatistics.org/blog/index.php?pk=286883&T=1

[TABLE]
[ROW][C]Pearson Product Moment Correlation - Ungrouped Data[/C][/ROW]
[ROW][C]Statistic[/C][C]Variable X[/C][C]Variable Y[/C][/ROW]
[ROW][C]Mean[/C][C]134986.114754098[/C][C]572870.06557377[/C][/ROW]
[ROW][C]Biased Variance[/C][C]78993799.3802741[/C][C]728265646.684225[/C][/ROW]
[ROW][C]Biased Standard Deviation[/C][C]8887.84559835926[/C][C]26986.3974380469[/C][/ROW]
[ROW][C]Covariance[/C][C]145468383.225683[/C][/ROW]
[ROW][C]Correlation[/C][C]0.596552422929248[/C][/ROW]
[ROW][C]Determination[/C][C]0.355874793302757[/C][/ROW]
[ROW][C]T-Test[/C][C]5.70938687544557[/C][/ROW]
[ROW][C]p-value (2 sided)[/C][C]3.90459772958707e-07[/C][/ROW]
[ROW][C]p-value (1 sided)[/C][C]1.95229886479353e-07[/C][/ROW]
[ROW][C]95% CI of Correlation[/C][C][0.405673723747909, 0.737571952343929][/C][/ROW]
[ROW][C]Degrees of Freedom[/C][C]59[/C][/ROW]
[ROW][C]Number of Observations[/C][C]61[/C][/ROW]
[/TABLE]
Source: https://freestatistics.org/blog/index.php?pk=286883&T=1

Globally Unique Identifier (entire table): ba.freestatistics.org/blog/index.php?pk=286883&T=1

As an alternative you can also use a QR Code:  

The GUIDs for individual cells are displayed in the table below:

Pearson Product Moment Correlation - Ungrouped Data
StatisticVariable XVariable Y
Mean134986.114754098572870.06557377
Biased Variance78993799.3802741728265646.684225
Biased Standard Deviation8887.8455983592626986.3974380469
Covariance145468383.225683
Correlation0.596552422929248
Determination0.355874793302757
T-Test5.70938687544557
p-value (2 sided)3.90459772958707e-07
p-value (1 sided)1.95229886479353e-07
95% CI of Correlation[0.405673723747909, 0.737571952343929]
Degrees of Freedom59
Number of Observations61


Normality Tests
> jarque.x
	Jarque-Bera Normality Test
data:  x
JB = 7.367, p-value = 0.02513
alternative hypothesis: greater
> jarque.y
	Jarque-Bera Normality Test
data:  y
JB = 1.7502, p-value = 0.4168
alternative hypothesis: greater
> ad.x
	Anderson-Darling normality test
data:  x
A = 4.1454, p-value = 1.966e-10
> ad.y
	Anderson-Darling normality test
data:  y
A = 0.29327, p-value = 0.5911

\begin{tabular}{lllllllll}
\hline
Normality Tests \tabularnewline
> jarque.x
	Jarque-Bera Normality Test
data:  x
JB = 7.367, p-value = 0.02513
alternative hypothesis: greater
\tabularnewline
> jarque.y
	Jarque-Bera Normality Test
data:  y
JB = 1.7502, p-value = 0.4168
alternative hypothesis: greater
\tabularnewline
> ad.x
	Anderson-Darling normality test
data:  x
A = 4.1454, p-value = 1.966e-10
\tabularnewline
> ad.y
	Anderson-Darling normality test
data:  y
A = 0.29327, p-value = 0.5911
\tabularnewline \hline \end{tabular} %Source: https://freestatistics.org/blog/index.php?pk=286883&T=2

[TABLE]
[ROW][C]Normality Tests[/C][/ROW]
[ROW][C]
> jarque.x
	Jarque-Bera Normality Test
data:  x
JB = 7.367, p-value = 0.02513
alternative hypothesis: greater
[/C][/ROW] [ROW][C]
> jarque.y
	Jarque-Bera Normality Test
data:  y
JB = 1.7502, p-value = 0.4168
alternative hypothesis: greater
[/C][/ROW] [ROW][C]
> ad.x
	Anderson-Darling normality test
data:  x
A = 4.1454, p-value = 1.966e-10
[/C][/ROW] [ROW][C]
> ad.y
	Anderson-Darling normality test
data:  y
A = 0.29327, p-value = 0.5911
[/C][/ROW] [/TABLE] Source: https://freestatistics.org/blog/index.php?pk=286883&T=2

Globally Unique Identifier (entire table): ba.freestatistics.org/blog/index.php?pk=286883&T=2

As an alternative you can also use a QR Code:  

The GUIDs for individual cells are displayed in the table below:

Normality Tests
> jarque.x
	Jarque-Bera Normality Test
data:  x
JB = 7.367, p-value = 0.02513
alternative hypothesis: greater
> jarque.y
	Jarque-Bera Normality Test
data:  y
JB = 1.7502, p-value = 0.4168
alternative hypothesis: greater
> ad.x
	Anderson-Darling normality test
data:  x
A = 4.1454, p-value = 1.966e-10
> ad.y
	Anderson-Darling normality test
data:  y
A = 0.29327, p-value = 0.5911


Parameters (Session):
Parameters (R input):
R code (references can be found in the software module):
library(psychometric)
x <- x[!is.na(y)]
y <- y[!is.na(y)]
y <- y[!is.na(x)]
x <- x[!is.na(x)]
bitmap(file='test1.png')
histx <- hist(x, plot=FALSE)
histy <- hist(y, plot=FALSE)
maxcounts <- max(c(histx$counts, histx$counts))
xrange <- c(min(x),max(x))
yrange <- c(min(y),max(y))
nf <- layout(matrix(c(2,0,1,3),2,2,byrow=TRUE), c(3,1), c(1,3), TRUE)
par(mar=c(4,4,1,1))
plot(x, y, xlim=xrange, ylim=yrange, xlab=xlab, ylab=ylab, sub=main)
par(mar=c(0,4,1,1))
barplot(histx$counts, axes=FALSE, ylim=c(0, maxcounts), space=0)
par(mar=c(4,0,1,1))
barplot(histy$counts, axes=FALSE, xlim=c(0, maxcounts), space=0, horiz=TRUE)
dev.off()
lx = length(x)
makebiased = (lx-1)/lx
varx = var(x)*makebiased
vary = var(y)*makebiased
corxy <- cor.test(x,y,method='pearson', na.rm = T)
cxy <- as.matrix(corxy$estimate)[1,1]
load(file='createtable')
a<-table.start()
a<-table.row.start(a)
a<-table.element(a,'Pearson Product Moment Correlation - Ungrouped Data',3,TRUE)
a<-table.row.end(a)
a<-table.row.start(a)
a<-table.element(a,'Statistic',1,TRUE)
a<-table.element(a,'Variable X',1,TRUE)
a<-table.element(a,'Variable Y',1,TRUE)
a<-table.row.end(a)
a<-table.row.start(a)
a<-table.element(a,hyperlink('arithmetic_mean.htm','Mean',''),header=TRUE)
a<-table.element(a,mean(x))
a<-table.element(a,mean(y))
a<-table.row.end(a)
a<-table.row.start(a)
a<-table.element(a,hyperlink('biased.htm','Biased Variance',''),header=TRUE)
a<-table.element(a,varx)
a<-table.element(a,vary)
a<-table.row.end(a)
a<-table.row.start(a)
a<-table.element(a,hyperlink('biased1.htm','Biased Standard Deviation',''),header=TRUE)
a<-table.element(a,sqrt(varx))
a<-table.element(a,sqrt(vary))
a<-table.row.end(a)
a<-table.row.start(a)
a<-table.element(a,hyperlink('covariance.htm','Covariance',''),header=TRUE)
a<-table.element(a,cov(x,y),2)
a<-table.row.end(a)
a<-table.row.start(a)
a<-table.element(a,hyperlink('pearson_correlation.htm','Correlation',''),header=TRUE)
a<-table.element(a,cxy,2)
a<-table.row.end(a)
a<-table.row.start(a)
a<-table.element(a,hyperlink('coeff_of_determination.htm','Determination',''),header=TRUE)
a<-table.element(a,cxy*cxy,2)
a<-table.row.end(a)
a<-table.row.start(a)
a<-table.element(a,hyperlink('ttest_statistic.htm','T-Test',''),header=TRUE)
a<-table.element(a,as.matrix(corxy$statistic)[1,1],2)
a<-table.row.end(a)
a<-table.row.start(a)
a<-table.element(a,'p-value (2 sided)',header=TRUE)
a<-table.element(a,(p2 <- as.matrix(corxy$p.value)[1,1]),2)
a<-table.row.end(a)
a<-table.row.start(a)
a<-table.element(a,'p-value (1 sided)',header=TRUE)
a<-table.element(a,p2/2,2)
a<-table.row.end(a)
a<-table.row.start(a)
a<-table.element(a,'95% CI of Correlation',header=TRUE)
a<-table.element(a,paste('[',CIr(r=cxy, n = lx, level = .95)[1],', ', CIr(r=cxy, n = lx, level = .95)[2],']',sep=''),2)
a<-table.row.end(a)
a<-table.row.start(a)
a<-table.element(a,'Degrees of Freedom',header=TRUE)
a<-table.element(a,lx-2,2)
a<-table.row.end(a)
a<-table.row.start(a)
a<-table.element(a,'Number of Observations',header=TRUE)
a<-table.element(a,lx,2)
a<-table.row.end(a)
a<-table.end(a)
table.save(a,file='mytable.tab')
library(moments)
library(nortest)
jarque.x <- jarque.test(x)
jarque.y <- jarque.test(y)
if(lx>7) {
ad.x <- ad.test(x)
ad.y <- ad.test(y)
}
a<-table.start()
a<-table.row.start(a)
a<-table.element(a,'Normality Tests',1,TRUE)
a<-table.row.end(a)
a<-table.row.start(a)
a<-table.element(a,paste('
',RC.texteval('jarque.x'),'
',sep=''))
a<-table.row.end(a)
a<-table.row.start(a)
a<-table.element(a,paste('
',RC.texteval('jarque.y'),'
',sep=''))
a<-table.row.end(a)
if(lx>7) {
a<-table.row.start(a)
a<-table.element(a,paste('
',RC.texteval('ad.x'),'
',sep=''))
a<-table.row.end(a)
a<-table.row.start(a)
a<-table.element(a,paste('
',RC.texteval('ad.y'),'
',sep=''))
a<-table.row.end(a)
}
a<-table.end(a)
table.save(a,file='mytable1.tab')
library(car)
bitmap(file='test2.png')
qq.plot(x,main='QQplot of variable x')
dev.off()
bitmap(file='test3.png')
qq.plot(y,main='QQplot of variable y')
dev.off()