Free Statistics

of Irreproducible Research!

Author's title

Author*The author of this computation has been verified*
R Software Modulerwasp_correlation.wasp
Title produced by softwarePearson Correlation
Date of computationFri, 18 Dec 2015 12:38:04 +0000
Cite this page as followsStatistical Computations at FreeStatistics.org, Office for Research Development and Education, URL https://freestatistics.org/blog/index.php?v=date/2015/Dec/18/t1450442321145y1robi894ez6.htm/, Retrieved Thu, 16 May 2024 10:55:48 +0000
Statistical Computations at FreeStatistics.org, Office for Research Development and Education, URL https://freestatistics.org/blog/index.php?pk=286886, Retrieved Thu, 16 May 2024 10:55:48 +0000
QR Codes:

Original text written by user:
IsPrivate?No (this computation is public)
User-defined keywords
Estimated Impact123
Family? (F = Feedback message, R = changed R code, M = changed R Module, P = changed Parameters, D = changed Data)
-       [Pearson Correlation] [Pearson correlati...] [2015-12-18 12:38:04] [3fd5ab1060e3487adfc241d011cb6ba1] [Current]
Feedback Forum

Post a new message
Dataseries X:
317402
310184
315463
318505
314563
311117
306333
302178
300655
323998
326212
312417
307031
304043
308136
320973
319482
313360
309036
304375
306248
330736
335366
323054
319095
317652
321330
332513
329035
326163
324009
319993
321098
347849
351119
341654
337059
334885
339930
350924
346186
341880
336529
329220
328200
350784
352606
342592
336988
332114
334011
340002
336267
330856
320052
312158
313310
330764
331936
319531
313927
Dataseries Y:
563668
548604
551174
555654
547970
540324
530577
520579
518654
572273
581302
563280
547612
538712
540735
561649
558685
545732
536352
527676
530455
581744
598714
583775
571477
563278
564872
577537
572399
565430
560619
551227
553397
610893
621668
613148
598778
590623
595902
612186
603453
593362
581940
568075
567467
619423
627325
617144
602280
590816
589812
600615
595729
586958
567705
551407
554324
595557
602467
587774
572107


Summary of computational transaction
Raw Inputview raw input (R code)
Raw Outputview raw output of R engine
Computing time4 seconds
R Server'George Udny Yule' @ yule.wessa.net

\begin{tabular}{lllllllll}
\hline
Summary of computational transaction \tabularnewline
Raw Input & view raw input (R code)  \tabularnewline
Raw Output & view raw output of R engine  \tabularnewline
Computing time & 4 seconds \tabularnewline
R Server & 'George Udny Yule' @ yule.wessa.net \tabularnewline
\hline
\end{tabular}
%Source: https://freestatistics.org/blog/index.php?pk=286886&T=0

[TABLE]
[ROW][C]Summary of computational transaction[/C][/ROW]
[ROW][C]Raw Input[/C][C]view raw input (R code) [/C][/ROW]
[ROW][C]Raw Output[/C][C]view raw output of R engine [/C][/ROW]
[ROW][C]Computing time[/C][C]4 seconds[/C][/ROW]
[ROW][C]R Server[/C][C]'George Udny Yule' @ yule.wessa.net[/C][/ROW]
[/TABLE]
Source: https://freestatistics.org/blog/index.php?pk=286886&T=0

Globally Unique Identifier (entire table): ba.freestatistics.org/blog/index.php?pk=286886&T=0

As an alternative you can also use a QR Code:  

The GUIDs for individual cells are displayed in the table below:

Summary of computational transaction
Raw Inputview raw input (R code)
Raw Outputview raw output of R engine
Computing time4 seconds
R Server'George Udny Yule' @ yule.wessa.net


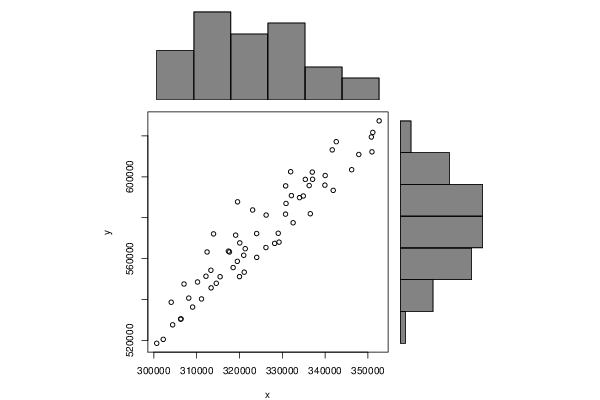
Pearson Product Moment Correlation - Ungrouped Data
StatisticVariable XVariable Y
Mean325165.37704918572870.06557377
Biased Variance187345722.857834728265646.684225
Biased Standard Deviation13687.429373619926986.3974380469
Covariance356014672.458197
Correlation0.948030935109175
Determination0.898762653923976
T-Test22.8864345105313
p-value (2 sided)0
p-value (1 sided)0
95% CI of Correlation[0.914542432664153, 0.968611355422414]
Degrees of Freedom59
Number of Observations61

\begin{tabular}{lllllllll}
\hline
Pearson Product Moment Correlation - Ungrouped Data \tabularnewline
Statistic & Variable X & Variable Y \tabularnewline
Mean & 325165.37704918 & 572870.06557377 \tabularnewline
Biased Variance & 187345722.857834 & 728265646.684225 \tabularnewline
Biased Standard Deviation & 13687.4293736199 & 26986.3974380469 \tabularnewline
Covariance & 356014672.458197 \tabularnewline
Correlation & 0.948030935109175 \tabularnewline
Determination & 0.898762653923976 \tabularnewline
T-Test & 22.8864345105313 \tabularnewline
p-value (2 sided) & 0 \tabularnewline
p-value (1 sided) & 0 \tabularnewline
95% CI of Correlation & [0.914542432664153, 0.968611355422414] \tabularnewline
Degrees of Freedom & 59 \tabularnewline
Number of Observations & 61 \tabularnewline
\hline
\end{tabular}
%Source: https://freestatistics.org/blog/index.php?pk=286886&T=1

[TABLE]
[ROW][C]Pearson Product Moment Correlation - Ungrouped Data[/C][/ROW]
[ROW][C]Statistic[/C][C]Variable X[/C][C]Variable Y[/C][/ROW]
[ROW][C]Mean[/C][C]325165.37704918[/C][C]572870.06557377[/C][/ROW]
[ROW][C]Biased Variance[/C][C]187345722.857834[/C][C]728265646.684225[/C][/ROW]
[ROW][C]Biased Standard Deviation[/C][C]13687.4293736199[/C][C]26986.3974380469[/C][/ROW]
[ROW][C]Covariance[/C][C]356014672.458197[/C][/ROW]
[ROW][C]Correlation[/C][C]0.948030935109175[/C][/ROW]
[ROW][C]Determination[/C][C]0.898762653923976[/C][/ROW]
[ROW][C]T-Test[/C][C]22.8864345105313[/C][/ROW]
[ROW][C]p-value (2 sided)[/C][C]0[/C][/ROW]
[ROW][C]p-value (1 sided)[/C][C]0[/C][/ROW]
[ROW][C]95% CI of Correlation[/C][C][0.914542432664153, 0.968611355422414][/C][/ROW]
[ROW][C]Degrees of Freedom[/C][C]59[/C][/ROW]
[ROW][C]Number of Observations[/C][C]61[/C][/ROW]
[/TABLE]
Source: https://freestatistics.org/blog/index.php?pk=286886&T=1

Globally Unique Identifier (entire table): ba.freestatistics.org/blog/index.php?pk=286886&T=1

As an alternative you can also use a QR Code:  

The GUIDs for individual cells are displayed in the table below:

Pearson Product Moment Correlation - Ungrouped Data
StatisticVariable XVariable Y
Mean325165.37704918572870.06557377
Biased Variance187345722.857834728265646.684225
Biased Standard Deviation13687.429373619926986.3974380469
Covariance356014672.458197
Correlation0.948030935109175
Determination0.898762653923976
T-Test22.8864345105313
p-value (2 sided)0
p-value (1 sided)0
95% CI of Correlation[0.914542432664153, 0.968611355422414]
Degrees of Freedom59
Number of Observations61


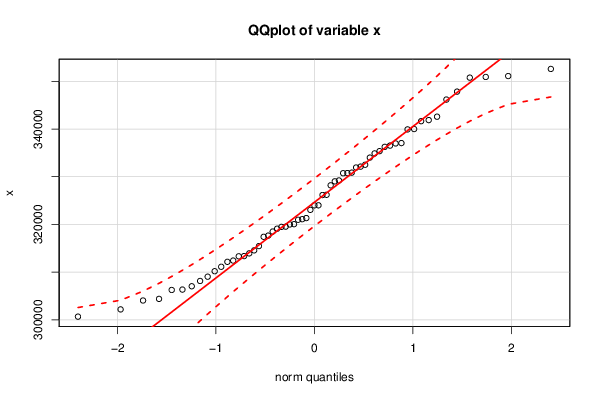
Normality Tests
> jarque.x
	Jarque-Bera Normality Test
data:  x
JB = 2.297, p-value = 0.3171
alternative hypothesis: greater
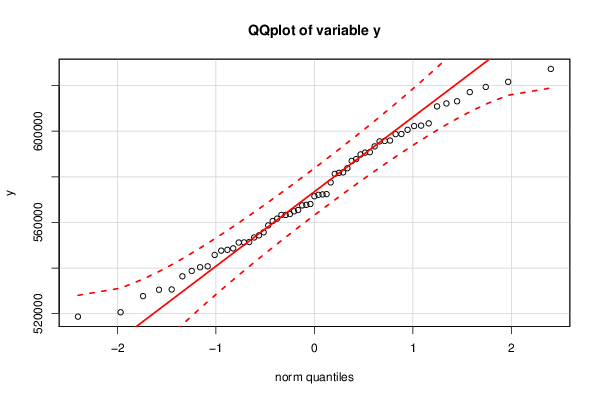
> jarque.y
	Jarque-Bera Normality Test
data:  y
JB = 1.7502, p-value = 0.4168
alternative hypothesis: greater
> ad.x
	Anderson-Darling normality test
data:  x
A = 0.38481, p-value = 0.383
> ad.y
	Anderson-Darling normality test
data:  y
A = 0.29327, p-value = 0.5911

\begin{tabular}{lllllllll}
\hline
Normality Tests \tabularnewline
> jarque.x
	Jarque-Bera Normality Test
data:  x
JB = 2.297, p-value = 0.3171
alternative hypothesis: greater
\tabularnewline
> jarque.y
	Jarque-Bera Normality Test
data:  y
JB = 1.7502, p-value = 0.4168
alternative hypothesis: greater
\tabularnewline
> ad.x
	Anderson-Darling normality test
data:  x
A = 0.38481, p-value = 0.383
\tabularnewline
> ad.y
	Anderson-Darling normality test
data:  y
A = 0.29327, p-value = 0.5911
\tabularnewline \hline \end{tabular} %Source: https://freestatistics.org/blog/index.php?pk=286886&T=2

[TABLE]
[ROW][C]Normality Tests[/C][/ROW]
[ROW][C]
> jarque.x
	Jarque-Bera Normality Test
data:  x
JB = 2.297, p-value = 0.3171
alternative hypothesis: greater
[/C][/ROW] [ROW][C]
> jarque.y
	Jarque-Bera Normality Test
data:  y
JB = 1.7502, p-value = 0.4168
alternative hypothesis: greater
[/C][/ROW] [ROW][C]
> ad.x
	Anderson-Darling normality test
data:  x
A = 0.38481, p-value = 0.383
[/C][/ROW] [ROW][C]
> ad.y
	Anderson-Darling normality test
data:  y
A = 0.29327, p-value = 0.5911
[/C][/ROW] [/TABLE] Source: https://freestatistics.org/blog/index.php?pk=286886&T=2

Globally Unique Identifier (entire table): ba.freestatistics.org/blog/index.php?pk=286886&T=2

As an alternative you can also use a QR Code:  

The GUIDs for individual cells are displayed in the table below:

Normality Tests
> jarque.x
	Jarque-Bera Normality Test
data:  x
JB = 2.297, p-value = 0.3171
alternative hypothesis: greater
> jarque.y
	Jarque-Bera Normality Test
data:  y
JB = 1.7502, p-value = 0.4168
alternative hypothesis: greater
> ad.x
	Anderson-Darling normality test
data:  x
A = 0.38481, p-value = 0.383
> ad.y
	Anderson-Darling normality test
data:  y
A = 0.29327, p-value = 0.5911


Parameters (Session):
Parameters (R input):
R code (references can be found in the software module):
library(psychometric)
x <- x[!is.na(y)]
y <- y[!is.na(y)]
y <- y[!is.na(x)]
x <- x[!is.na(x)]
bitmap(file='test1.png')
histx <- hist(x, plot=FALSE)
histy <- hist(y, plot=FALSE)
maxcounts <- max(c(histx$counts, histx$counts))
xrange <- c(min(x),max(x))
yrange <- c(min(y),max(y))
nf <- layout(matrix(c(2,0,1,3),2,2,byrow=TRUE), c(3,1), c(1,3), TRUE)
par(mar=c(4,4,1,1))
plot(x, y, xlim=xrange, ylim=yrange, xlab=xlab, ylab=ylab, sub=main)
par(mar=c(0,4,1,1))
barplot(histx$counts, axes=FALSE, ylim=c(0, maxcounts), space=0)
par(mar=c(4,0,1,1))
barplot(histy$counts, axes=FALSE, xlim=c(0, maxcounts), space=0, horiz=TRUE)
dev.off()
lx = length(x)
makebiased = (lx-1)/lx
varx = var(x)*makebiased
vary = var(y)*makebiased
corxy <- cor.test(x,y,method='pearson', na.rm = T)
cxy <- as.matrix(corxy$estimate)[1,1]
load(file='createtable')
a<-table.start()
a<-table.row.start(a)
a<-table.element(a,'Pearson Product Moment Correlation - Ungrouped Data',3,TRUE)
a<-table.row.end(a)
a<-table.row.start(a)
a<-table.element(a,'Statistic',1,TRUE)
a<-table.element(a,'Variable X',1,TRUE)
a<-table.element(a,'Variable Y',1,TRUE)
a<-table.row.end(a)
a<-table.row.start(a)
a<-table.element(a,hyperlink('arithmetic_mean.htm','Mean',''),header=TRUE)
a<-table.element(a,mean(x))
a<-table.element(a,mean(y))
a<-table.row.end(a)
a<-table.row.start(a)
a<-table.element(a,hyperlink('biased.htm','Biased Variance',''),header=TRUE)
a<-table.element(a,varx)
a<-table.element(a,vary)
a<-table.row.end(a)
a<-table.row.start(a)
a<-table.element(a,hyperlink('biased1.htm','Biased Standard Deviation',''),header=TRUE)
a<-table.element(a,sqrt(varx))
a<-table.element(a,sqrt(vary))
a<-table.row.end(a)
a<-table.row.start(a)
a<-table.element(a,hyperlink('covariance.htm','Covariance',''),header=TRUE)
a<-table.element(a,cov(x,y),2)
a<-table.row.end(a)
a<-table.row.start(a)
a<-table.element(a,hyperlink('pearson_correlation.htm','Correlation',''),header=TRUE)
a<-table.element(a,cxy,2)
a<-table.row.end(a)
a<-table.row.start(a)
a<-table.element(a,hyperlink('coeff_of_determination.htm','Determination',''),header=TRUE)
a<-table.element(a,cxy*cxy,2)
a<-table.row.end(a)
a<-table.row.start(a)
a<-table.element(a,hyperlink('ttest_statistic.htm','T-Test',''),header=TRUE)
a<-table.element(a,as.matrix(corxy$statistic)[1,1],2)
a<-table.row.end(a)
a<-table.row.start(a)
a<-table.element(a,'p-value (2 sided)',header=TRUE)
a<-table.element(a,(p2 <- as.matrix(corxy$p.value)[1,1]),2)
a<-table.row.end(a)
a<-table.row.start(a)
a<-table.element(a,'p-value (1 sided)',header=TRUE)
a<-table.element(a,p2/2,2)
a<-table.row.end(a)
a<-table.row.start(a)
a<-table.element(a,'95% CI of Correlation',header=TRUE)
a<-table.element(a,paste('[',CIr(r=cxy, n = lx, level = .95)[1],', ', CIr(r=cxy, n = lx, level = .95)[2],']',sep=''),2)
a<-table.row.end(a)
a<-table.row.start(a)
a<-table.element(a,'Degrees of Freedom',header=TRUE)
a<-table.element(a,lx-2,2)
a<-table.row.end(a)
a<-table.row.start(a)
a<-table.element(a,'Number of Observations',header=TRUE)
a<-table.element(a,lx,2)
a<-table.row.end(a)
a<-table.end(a)
table.save(a,file='mytable.tab')
library(moments)
library(nortest)
jarque.x <- jarque.test(x)
jarque.y <- jarque.test(y)
if(lx>7) {
ad.x <- ad.test(x)
ad.y <- ad.test(y)
}
a<-table.start()
a<-table.row.start(a)
a<-table.element(a,'Normality Tests',1,TRUE)
a<-table.row.end(a)
a<-table.row.start(a)
a<-table.element(a,paste('
',RC.texteval('jarque.x'),'
',sep=''))
a<-table.row.end(a)
a<-table.row.start(a)
a<-table.element(a,paste('
',RC.texteval('jarque.y'),'
',sep=''))
a<-table.row.end(a)
if(lx>7) {
a<-table.row.start(a)
a<-table.element(a,paste('
',RC.texteval('ad.x'),'
',sep=''))
a<-table.row.end(a)
a<-table.row.start(a)
a<-table.element(a,paste('
',RC.texteval('ad.y'),'
',sep=''))
a<-table.row.end(a)
}
a<-table.end(a)
table.save(a,file='mytable1.tab')
library(car)
bitmap(file='test2.png')
qq.plot(x,main='QQplot of variable x')
dev.off()
bitmap(file='test3.png')
qq.plot(y,main='QQplot of variable y')
dev.off()