Free Statistics

of Irreproducible Research!

Author's title

Author*The author of this computation has been verified*
R Software Modulerwasp_multipleregression.wasp
Title produced by softwareMultiple Regression
Date of computationFri, 18 Dec 2015 15:23:03 +0000
Cite this page as followsStatistical Computations at FreeStatistics.org, Office for Research Development and Education, URL https://freestatistics.org/blog/index.php?v=date/2015/Dec/18/t14504522076hjmsan8hj99ykd.htm/, Retrieved Thu, 16 May 2024 14:56:13 +0000
Statistical Computations at FreeStatistics.org, Office for Research Development and Education, URL https://freestatistics.org/blog/index.php?pk=286894, Retrieved Thu, 16 May 2024 14:56:13 +0000
QR Codes:

Original text written by user:
IsPrivate?No (this computation is public)
User-defined keywords
Estimated Impact100
Family? (F = Feedback message, R = changed R code, M = changed R Module, P = changed Parameters, D = changed Data)
-       [Multiple Regression] [Crime residu 1] [2015-12-18 15:23:03] [f8729d7585f0075d0e97a80d5900c863] [Current]
Feedback Forum

Post a new message
Dataseries X:
478 184 40
494 213 32
643 347 57
341 565 31
773 327 67
603 260 25
484 325 34
546 102 33
424 38 36
548 226 31
506 137 35
819 369 30
541 109 44
491 809 32
514 29 30
371 245 16
457 118 29
437 148 36
570 387 30
432 98 23
619 608 33
357 218 35
623 254 38
547 697 44
792 827 28
799 693 35
439 448 31
867 942 39
912 1017 27
462 216 36
859 673 38
805 989 46
652 630 29
776 404 32
919 692 39
732 1517 44
657 879 33
1419 631 43
989 1375 22
821 1139 30
1740 3545 86
815 706 30
760 451 32
936 433 43
863 601 20
783 1024 55
715 457 44
1504 1441 37
1324 1022 82
940 1244 66


Summary of computational transaction
Raw Inputview raw input (R code)
Raw Outputview raw output of R engine
Computing time5 seconds
R Server'Herman Ole Andreas Wold' @ wold.wessa.net

\begin{tabular}{lllllllll}
\hline
Summary of computational transaction \tabularnewline
Raw Input & view raw input (R code)  \tabularnewline
Raw Output & view raw output of R engine  \tabularnewline
Computing time & 5 seconds \tabularnewline
R Server & 'Herman Ole Andreas Wold' @ wold.wessa.net \tabularnewline
\hline
\end{tabular}
%Source: https://freestatistics.org/blog/index.php?pk=286894&T=0

[TABLE]
[ROW][C]Summary of computational transaction[/C][/ROW]
[ROW][C]Raw Input[/C][C]view raw input (R code) [/C][/ROW]
[ROW][C]Raw Output[/C][C]view raw output of R engine [/C][/ROW]
[ROW][C]Computing time[/C][C]5 seconds[/C][/ROW]
[ROW][C]R Server[/C][C]'Herman Ole Andreas Wold' @ wold.wessa.net[/C][/ROW]
[/TABLE]
Source: https://freestatistics.org/blog/index.php?pk=286894&T=0

Globally Unique Identifier (entire table): ba.freestatistics.org/blog/index.php?pk=286894&T=0

As an alternative you can also use a QR Code:  

The GUIDs for individual cells are displayed in the table below:

Summary of computational transaction
Raw Inputview raw input (R code)
Raw Outputview raw output of R engine
Computing time5 seconds
R Server'Herman Ole Andreas Wold' @ wold.wessa.net


Multiple Linear Regression - Estimated Regression Equation
Y[t] = + 350.886 + 0.335467X1[t] + 4.24696X2[t] + e[t]

\begin{tabular}{lllllllll}
\hline
Multiple Linear Regression - Estimated Regression Equation \tabularnewline
Y[t] =  +  350.886 +  0.335467X1[t] +  4.24696X2[t]  + e[t] \tabularnewline
 \tabularnewline
\hline
\end{tabular}
%Source: https://freestatistics.org/blog/index.php?pk=286894&T=1

[TABLE]
[ROW][C]Multiple Linear Regression - Estimated Regression Equation[/C][/ROW]
[ROW][C]Y[t] =  +  350.886 +  0.335467X1[t] +  4.24696X2[t]  + e[t][/C][/ROW]
[ROW][C][/C][/ROW]
[/TABLE]
Source: https://freestatistics.org/blog/index.php?pk=286894&T=1

Globally Unique Identifier (entire table): ba.freestatistics.org/blog/index.php?pk=286894&T=1

As an alternative you can also use a QR Code:  

The GUIDs for individual cells are displayed in the table below:

Multiple Linear Regression - Estimated Regression Equation
Y[t] = + 350.886 + 0.335467X1[t] + 4.24696X2[t] + e[t]


Multiple Linear Regression - Ordinary Least Squares
VariableParameterS.D.T-STATH0: parameter = 02-tail p-value1-tail p-value
(Intercept)+350.9 79.25+4.4270e+00 5.653e-05 2.827e-05
X1+0.3355 0.0548+6.1220e+00 1.758e-07 8.79e-08
X2+4.247 2.275+1.8670e+00 0.06815 0.03407

\begin{tabular}{lllllllll}
\hline
Multiple Linear Regression - Ordinary Least Squares \tabularnewline
Variable & Parameter & S.D. & T-STATH0: parameter = 0 & 2-tail p-value & 1-tail p-value \tabularnewline
(Intercept) & +350.9 &  79.25 & +4.4270e+00 &  5.653e-05 &  2.827e-05 \tabularnewline
X1 & +0.3355 &  0.0548 & +6.1220e+00 &  1.758e-07 &  8.79e-08 \tabularnewline
X2 & +4.247 &  2.275 & +1.8670e+00 &  0.06815 &  0.03407 \tabularnewline
\hline
\end{tabular}
%Source: https://freestatistics.org/blog/index.php?pk=286894&T=2

[TABLE]
[ROW][C]Multiple Linear Regression - Ordinary Least Squares[/C][/ROW]
[ROW][C]Variable[/C][C]Parameter[/C][C]S.D.[/C][C]T-STATH0: parameter = 0[/C][C]2-tail p-value[/C][C]1-tail p-value[/C][/ROW]
[ROW][C](Intercept)[/C][C]+350.9[/C][C] 79.25[/C][C]+4.4270e+00[/C][C] 5.653e-05[/C][C] 2.827e-05[/C][/ROW]
[ROW][C]X1[/C][C]+0.3355[/C][C] 0.0548[/C][C]+6.1220e+00[/C][C] 1.758e-07[/C][C] 8.79e-08[/C][/ROW]
[ROW][C]X2[/C][C]+4.247[/C][C] 2.275[/C][C]+1.8670e+00[/C][C] 0.06815[/C][C] 0.03407[/C][/ROW]
[/TABLE]
Source: https://freestatistics.org/blog/index.php?pk=286894&T=2

Globally Unique Identifier (entire table): ba.freestatistics.org/blog/index.php?pk=286894&T=2

As an alternative you can also use a QR Code:  

The GUIDs for individual cells are displayed in the table below:

Multiple Linear Regression - Ordinary Least Squares
VariableParameterS.D.T-STATH0: parameter = 02-tail p-value1-tail p-value
(Intercept)+350.9 79.25+4.4270e+00 5.653e-05 2.827e-05
X1+0.3355 0.0548+6.1220e+00 1.758e-07 8.79e-08
X2+4.247 2.275+1.8670e+00 0.06815 0.03407


Multiple Linear Regression - Regression Statistics
Multiple R 0.7758
R-squared 0.6018
Adjusted R-squared 0.5849
F-TEST (value) 35.52
F-TEST (DF numerator)2
F-TEST (DF denominator)47
p-value 3.996e-10
Multiple Linear Regression - Residual Statistics
Residual Standard Deviation 189.4
Sum Squared Residuals 1.686e+06

\begin{tabular}{lllllllll}
\hline
Multiple Linear Regression - Regression Statistics \tabularnewline
Multiple R &  0.7758 \tabularnewline
R-squared &  0.6018 \tabularnewline
Adjusted R-squared &  0.5849 \tabularnewline
F-TEST (value) &  35.52 \tabularnewline
F-TEST (DF numerator) & 2 \tabularnewline
F-TEST (DF denominator) & 47 \tabularnewline
p-value &  3.996e-10 \tabularnewline
Multiple Linear Regression - Residual Statistics \tabularnewline
Residual Standard Deviation &  189.4 \tabularnewline
Sum Squared Residuals &  1.686e+06 \tabularnewline
\hline
\end{tabular}
%Source: https://freestatistics.org/blog/index.php?pk=286894&T=3

[TABLE]
[ROW][C]Multiple Linear Regression - Regression Statistics[/C][/ROW]
[ROW][C]Multiple R[/C][C] 0.7758[/C][/ROW]
[ROW][C]R-squared[/C][C] 0.6018[/C][/ROW]
[ROW][C]Adjusted R-squared[/C][C] 0.5849[/C][/ROW]
[ROW][C]F-TEST (value)[/C][C] 35.52[/C][/ROW]
[ROW][C]F-TEST (DF numerator)[/C][C]2[/C][/ROW]
[ROW][C]F-TEST (DF denominator)[/C][C]47[/C][/ROW]
[ROW][C]p-value[/C][C] 3.996e-10[/C][/ROW]
[ROW][C]Multiple Linear Regression - Residual Statistics[/C][/ROW]
[ROW][C]Residual Standard Deviation[/C][C] 189.4[/C][/ROW]
[ROW][C]Sum Squared Residuals[/C][C] 1.686e+06[/C][/ROW]
[/TABLE]
Source: https://freestatistics.org/blog/index.php?pk=286894&T=3

Globally Unique Identifier (entire table): ba.freestatistics.org/blog/index.php?pk=286894&T=3

As an alternative you can also use a QR Code:  

The GUIDs for individual cells are displayed in the table below:

Multiple Linear Regression - Regression Statistics
Multiple R 0.7758
R-squared 0.6018
Adjusted R-squared 0.5849
F-TEST (value) 35.52
F-TEST (DF numerator)2
F-TEST (DF denominator)47
p-value 3.996e-10
Multiple Linear Regression - Residual Statistics
Residual Standard Deviation 189.4
Sum Squared Residuals 1.686e+06


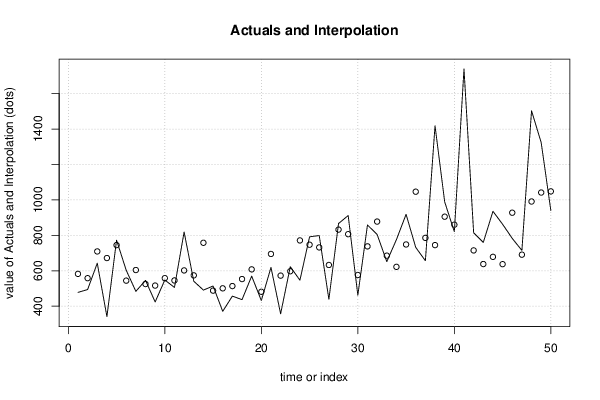
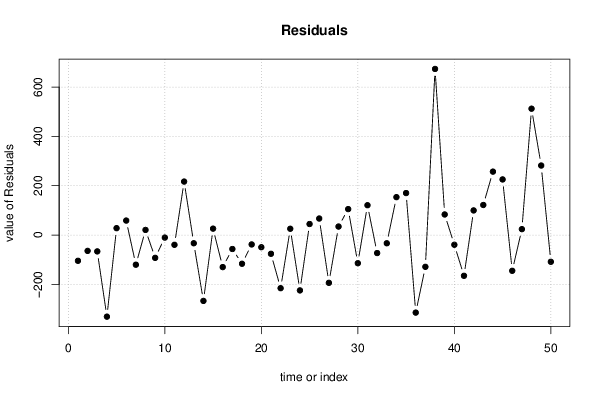
Multiple Linear Regression - Actuals, Interpolation, and Residuals
Time or IndexActualsInterpolationForecastResidualsPrediction Error
1 478 582.5-104.5
2 494 558.2-64.24
3 643 709.4-66.37
4 341 672.1-331.1
5 773 745.1 27.87
6 603 544.3 58.72
7 484 604.3-120.3
8 546 525.3 20.75
9 424 516.5-92.52
10 548 558.4-10.36
11 506 545.5-39.49
12 819 602.1 216.9
13 541 574.3-33.32
14 491 758.2-267.2
15 514 488 25.98
16 371 501-130
17 457 513.6-56.63
18 437 553.4-116.4
19 570 608.1-38.12
20 432 481.4-49.44
21 619 695-76
22 357 572.7-215.7
23 623 597.5 25.52
24 547 771.6-224.6
25 792 747.2 44.77
26 799 732 66.99
27 439 632.8-193.8
28 867 832.5 34.47
29 912 806.7 105.3
30 462 576.2-114.2
31 859 738 121
32 805 878-73.02
33 652 685.4-33.39
34 776 622.3 153.7
35 919 748.7 170.3
36 732 1047-314.7
37 657 785.9-128.9
38 1419 745.2 673.8
39 989 905.6 83.41
40 821 860.4-39.39
41 1740 1905-165.4
42 815 715.1 99.86
43 760 638.1 121.9
44 936 678.8 257.2
45 863 637.4 225.6
46 783 928-145
47 715 691.1 23.94
48 1504 991.4 512.6
49 1324 1042 282
50 940 1049-108.5

\begin{tabular}{lllllllll}
\hline
Multiple Linear Regression - Actuals, Interpolation, and Residuals \tabularnewline
Time or Index & Actuals & InterpolationForecast & ResidualsPrediction Error \tabularnewline
1 &  478 &  582.5 & -104.5 \tabularnewline
2 &  494 &  558.2 & -64.24 \tabularnewline
3 &  643 &  709.4 & -66.37 \tabularnewline
4 &  341 &  672.1 & -331.1 \tabularnewline
5 &  773 &  745.1 &  27.87 \tabularnewline
6 &  603 &  544.3 &  58.72 \tabularnewline
7 &  484 &  604.3 & -120.3 \tabularnewline
8 &  546 &  525.3 &  20.75 \tabularnewline
9 &  424 &  516.5 & -92.52 \tabularnewline
10 &  548 &  558.4 & -10.36 \tabularnewline
11 &  506 &  545.5 & -39.49 \tabularnewline
12 &  819 &  602.1 &  216.9 \tabularnewline
13 &  541 &  574.3 & -33.32 \tabularnewline
14 &  491 &  758.2 & -267.2 \tabularnewline
15 &  514 &  488 &  25.98 \tabularnewline
16 &  371 &  501 & -130 \tabularnewline
17 &  457 &  513.6 & -56.63 \tabularnewline
18 &  437 &  553.4 & -116.4 \tabularnewline
19 &  570 &  608.1 & -38.12 \tabularnewline
20 &  432 &  481.4 & -49.44 \tabularnewline
21 &  619 &  695 & -76 \tabularnewline
22 &  357 &  572.7 & -215.7 \tabularnewline
23 &  623 &  597.5 &  25.52 \tabularnewline
24 &  547 &  771.6 & -224.6 \tabularnewline
25 &  792 &  747.2 &  44.77 \tabularnewline
26 &  799 &  732 &  66.99 \tabularnewline
27 &  439 &  632.8 & -193.8 \tabularnewline
28 &  867 &  832.5 &  34.47 \tabularnewline
29 &  912 &  806.7 &  105.3 \tabularnewline
30 &  462 &  576.2 & -114.2 \tabularnewline
31 &  859 &  738 &  121 \tabularnewline
32 &  805 &  878 & -73.02 \tabularnewline
33 &  652 &  685.4 & -33.39 \tabularnewline
34 &  776 &  622.3 &  153.7 \tabularnewline
35 &  919 &  748.7 &  170.3 \tabularnewline
36 &  732 &  1047 & -314.7 \tabularnewline
37 &  657 &  785.9 & -128.9 \tabularnewline
38 &  1419 &  745.2 &  673.8 \tabularnewline
39 &  989 &  905.6 &  83.41 \tabularnewline
40 &  821 &  860.4 & -39.39 \tabularnewline
41 &  1740 &  1905 & -165.4 \tabularnewline
42 &  815 &  715.1 &  99.86 \tabularnewline
43 &  760 &  638.1 &  121.9 \tabularnewline
44 &  936 &  678.8 &  257.2 \tabularnewline
45 &  863 &  637.4 &  225.6 \tabularnewline
46 &  783 &  928 & -145 \tabularnewline
47 &  715 &  691.1 &  23.94 \tabularnewline
48 &  1504 &  991.4 &  512.6 \tabularnewline
49 &  1324 &  1042 &  282 \tabularnewline
50 &  940 &  1049 & -108.5 \tabularnewline
\hline
\end{tabular}
%Source: https://freestatistics.org/blog/index.php?pk=286894&T=4

[TABLE]
[ROW][C]Multiple Linear Regression - Actuals, Interpolation, and Residuals[/C][/ROW]
[ROW][C]Time or Index[/C][C]Actuals[/C][C]InterpolationForecast[/C][C]ResidualsPrediction Error[/C][/ROW]
[ROW][C]1[/C][C] 478[/C][C] 582.5[/C][C]-104.5[/C][/ROW]
[ROW][C]2[/C][C] 494[/C][C] 558.2[/C][C]-64.24[/C][/ROW]
[ROW][C]3[/C][C] 643[/C][C] 709.4[/C][C]-66.37[/C][/ROW]
[ROW][C]4[/C][C] 341[/C][C] 672.1[/C][C]-331.1[/C][/ROW]
[ROW][C]5[/C][C] 773[/C][C] 745.1[/C][C] 27.87[/C][/ROW]
[ROW][C]6[/C][C] 603[/C][C] 544.3[/C][C] 58.72[/C][/ROW]
[ROW][C]7[/C][C] 484[/C][C] 604.3[/C][C]-120.3[/C][/ROW]
[ROW][C]8[/C][C] 546[/C][C] 525.3[/C][C] 20.75[/C][/ROW]
[ROW][C]9[/C][C] 424[/C][C] 516.5[/C][C]-92.52[/C][/ROW]
[ROW][C]10[/C][C] 548[/C][C] 558.4[/C][C]-10.36[/C][/ROW]
[ROW][C]11[/C][C] 506[/C][C] 545.5[/C][C]-39.49[/C][/ROW]
[ROW][C]12[/C][C] 819[/C][C] 602.1[/C][C] 216.9[/C][/ROW]
[ROW][C]13[/C][C] 541[/C][C] 574.3[/C][C]-33.32[/C][/ROW]
[ROW][C]14[/C][C] 491[/C][C] 758.2[/C][C]-267.2[/C][/ROW]
[ROW][C]15[/C][C] 514[/C][C] 488[/C][C] 25.98[/C][/ROW]
[ROW][C]16[/C][C] 371[/C][C] 501[/C][C]-130[/C][/ROW]
[ROW][C]17[/C][C] 457[/C][C] 513.6[/C][C]-56.63[/C][/ROW]
[ROW][C]18[/C][C] 437[/C][C] 553.4[/C][C]-116.4[/C][/ROW]
[ROW][C]19[/C][C] 570[/C][C] 608.1[/C][C]-38.12[/C][/ROW]
[ROW][C]20[/C][C] 432[/C][C] 481.4[/C][C]-49.44[/C][/ROW]
[ROW][C]21[/C][C] 619[/C][C] 695[/C][C]-76[/C][/ROW]
[ROW][C]22[/C][C] 357[/C][C] 572.7[/C][C]-215.7[/C][/ROW]
[ROW][C]23[/C][C] 623[/C][C] 597.5[/C][C] 25.52[/C][/ROW]
[ROW][C]24[/C][C] 547[/C][C] 771.6[/C][C]-224.6[/C][/ROW]
[ROW][C]25[/C][C] 792[/C][C] 747.2[/C][C] 44.77[/C][/ROW]
[ROW][C]26[/C][C] 799[/C][C] 732[/C][C] 66.99[/C][/ROW]
[ROW][C]27[/C][C] 439[/C][C] 632.8[/C][C]-193.8[/C][/ROW]
[ROW][C]28[/C][C] 867[/C][C] 832.5[/C][C] 34.47[/C][/ROW]
[ROW][C]29[/C][C] 912[/C][C] 806.7[/C][C] 105.3[/C][/ROW]
[ROW][C]30[/C][C] 462[/C][C] 576.2[/C][C]-114.2[/C][/ROW]
[ROW][C]31[/C][C] 859[/C][C] 738[/C][C] 121[/C][/ROW]
[ROW][C]32[/C][C] 805[/C][C] 878[/C][C]-73.02[/C][/ROW]
[ROW][C]33[/C][C] 652[/C][C] 685.4[/C][C]-33.39[/C][/ROW]
[ROW][C]34[/C][C] 776[/C][C] 622.3[/C][C] 153.7[/C][/ROW]
[ROW][C]35[/C][C] 919[/C][C] 748.7[/C][C] 170.3[/C][/ROW]
[ROW][C]36[/C][C] 732[/C][C] 1047[/C][C]-314.7[/C][/ROW]
[ROW][C]37[/C][C] 657[/C][C] 785.9[/C][C]-128.9[/C][/ROW]
[ROW][C]38[/C][C] 1419[/C][C] 745.2[/C][C] 673.8[/C][/ROW]
[ROW][C]39[/C][C] 989[/C][C] 905.6[/C][C] 83.41[/C][/ROW]
[ROW][C]40[/C][C] 821[/C][C] 860.4[/C][C]-39.39[/C][/ROW]
[ROW][C]41[/C][C] 1740[/C][C] 1905[/C][C]-165.4[/C][/ROW]
[ROW][C]42[/C][C] 815[/C][C] 715.1[/C][C] 99.86[/C][/ROW]
[ROW][C]43[/C][C] 760[/C][C] 638.1[/C][C] 121.9[/C][/ROW]
[ROW][C]44[/C][C] 936[/C][C] 678.8[/C][C] 257.2[/C][/ROW]
[ROW][C]45[/C][C] 863[/C][C] 637.4[/C][C] 225.6[/C][/ROW]
[ROW][C]46[/C][C] 783[/C][C] 928[/C][C]-145[/C][/ROW]
[ROW][C]47[/C][C] 715[/C][C] 691.1[/C][C] 23.94[/C][/ROW]
[ROW][C]48[/C][C] 1504[/C][C] 991.4[/C][C] 512.6[/C][/ROW]
[ROW][C]49[/C][C] 1324[/C][C] 1042[/C][C] 282[/C][/ROW]
[ROW][C]50[/C][C] 940[/C][C] 1049[/C][C]-108.5[/C][/ROW]
[/TABLE]
Source: https://freestatistics.org/blog/index.php?pk=286894&T=4

Globally Unique Identifier (entire table): ba.freestatistics.org/blog/index.php?pk=286894&T=4

As an alternative you can also use a QR Code:  

The GUIDs for individual cells are displayed in the table below:

Multiple Linear Regression - Actuals, Interpolation, and Residuals
Time or IndexActualsInterpolationForecastResidualsPrediction Error
1 478 582.5-104.5
2 494 558.2-64.24
3 643 709.4-66.37
4 341 672.1-331.1
5 773 745.1 27.87
6 603 544.3 58.72
7 484 604.3-120.3
8 546 525.3 20.75
9 424 516.5-92.52
10 548 558.4-10.36
11 506 545.5-39.49
12 819 602.1 216.9
13 541 574.3-33.32
14 491 758.2-267.2
15 514 488 25.98
16 371 501-130
17 457 513.6-56.63
18 437 553.4-116.4
19 570 608.1-38.12
20 432 481.4-49.44
21 619 695-76
22 357 572.7-215.7
23 623 597.5 25.52
24 547 771.6-224.6
25 792 747.2 44.77
26 799 732 66.99
27 439 632.8-193.8
28 867 832.5 34.47
29 912 806.7 105.3
30 462 576.2-114.2
31 859 738 121
32 805 878-73.02
33 652 685.4-33.39
34 776 622.3 153.7
35 919 748.7 170.3
36 732 1047-314.7
37 657 785.9-128.9
38 1419 745.2 673.8
39 989 905.6 83.41
40 821 860.4-39.39
41 1740 1905-165.4
42 815 715.1 99.86
43 760 638.1 121.9
44 936 678.8 257.2
45 863 637.4 225.6
46 783 928-145
47 715 691.1 23.94
48 1504 991.4 512.6
49 1324 1042 282
50 940 1049-108.5


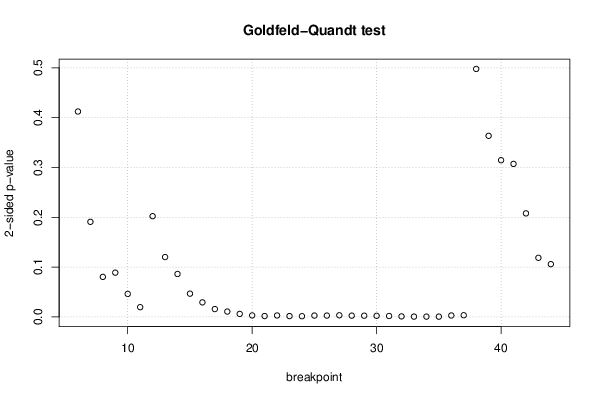
Goldfeld-Quandt test for Heteroskedasticity
p-valuesAlternative Hypothesis
breakpoint indexgreater2-sidedless
6 0.2061 0.4123 0.7939
7 0.09544 0.1909 0.9046
8 0.04021 0.08042 0.9598
9 0.04443 0.08887 0.9556
10 0.02311 0.04622 0.9769
11 0.009799 0.0196 0.9902
12 0.1011 0.2022 0.8989
13 0.06009 0.1202 0.9399
14 0.04312 0.08623 0.9569
15 0.02336 0.04671 0.9766
16 0.01464 0.02928 0.9854
17 0.007921 0.01584 0.9921
18 0.005425 0.01085 0.9946
19 0.003034 0.006068 0.997
20 0.001517 0.003034 0.9985
21 0.0008868 0.001774 0.9991
22 0.001476 0.002951 0.9985
23 0.0008543 0.001709 0.9991
24 0.0007566 0.001513 0.9992
25 0.001369 0.002738 0.9986
26 0.00136 0.00272 0.9986
27 0.001674 0.003347 0.9983
28 0.001293 0.002586 0.9987
29 0.001218 0.002436 0.9988
30 0.001149 0.002298 0.9989
31 0.0009411 0.001882 0.9991
32 0.0005727 0.001145 0.9994
33 0.000341 0.0006821 0.9997
34 0.0003264 0.0006528 0.9997
35 0.0002949 0.0005898 0.9997
36 0.001461 0.002921 0.9985
37 0.001725 0.003451 0.9983
38 0.2488 0.4977 0.7512
39 0.1817 0.3635 0.8183
40 0.1573 0.3146 0.8427
41 0.1536 0.3071 0.8464
42 0.1039 0.2079 0.8961
43 0.05934 0.1187 0.9407
44 0.05297 0.1059 0.947

\begin{tabular}{lllllllll}
\hline
Goldfeld-Quandt test for Heteroskedasticity \tabularnewline
p-values & Alternative Hypothesis \tabularnewline
breakpoint index & greater & 2-sided & less \tabularnewline
6 &  0.2061 &  0.4123 &  0.7939 \tabularnewline
7 &  0.09544 &  0.1909 &  0.9046 \tabularnewline
8 &  0.04021 &  0.08042 &  0.9598 \tabularnewline
9 &  0.04443 &  0.08887 &  0.9556 \tabularnewline
10 &  0.02311 &  0.04622 &  0.9769 \tabularnewline
11 &  0.009799 &  0.0196 &  0.9902 \tabularnewline
12 &  0.1011 &  0.2022 &  0.8989 \tabularnewline
13 &  0.06009 &  0.1202 &  0.9399 \tabularnewline
14 &  0.04312 &  0.08623 &  0.9569 \tabularnewline
15 &  0.02336 &  0.04671 &  0.9766 \tabularnewline
16 &  0.01464 &  0.02928 &  0.9854 \tabularnewline
17 &  0.007921 &  0.01584 &  0.9921 \tabularnewline
18 &  0.005425 &  0.01085 &  0.9946 \tabularnewline
19 &  0.003034 &  0.006068 &  0.997 \tabularnewline
20 &  0.001517 &  0.003034 &  0.9985 \tabularnewline
21 &  0.0008868 &  0.001774 &  0.9991 \tabularnewline
22 &  0.001476 &  0.002951 &  0.9985 \tabularnewline
23 &  0.0008543 &  0.001709 &  0.9991 \tabularnewline
24 &  0.0007566 &  0.001513 &  0.9992 \tabularnewline
25 &  0.001369 &  0.002738 &  0.9986 \tabularnewline
26 &  0.00136 &  0.00272 &  0.9986 \tabularnewline
27 &  0.001674 &  0.003347 &  0.9983 \tabularnewline
28 &  0.001293 &  0.002586 &  0.9987 \tabularnewline
29 &  0.001218 &  0.002436 &  0.9988 \tabularnewline
30 &  0.001149 &  0.002298 &  0.9989 \tabularnewline
31 &  0.0009411 &  0.001882 &  0.9991 \tabularnewline
32 &  0.0005727 &  0.001145 &  0.9994 \tabularnewline
33 &  0.000341 &  0.0006821 &  0.9997 \tabularnewline
34 &  0.0003264 &  0.0006528 &  0.9997 \tabularnewline
35 &  0.0002949 &  0.0005898 &  0.9997 \tabularnewline
36 &  0.001461 &  0.002921 &  0.9985 \tabularnewline
37 &  0.001725 &  0.003451 &  0.9983 \tabularnewline
38 &  0.2488 &  0.4977 &  0.7512 \tabularnewline
39 &  0.1817 &  0.3635 &  0.8183 \tabularnewline
40 &  0.1573 &  0.3146 &  0.8427 \tabularnewline
41 &  0.1536 &  0.3071 &  0.8464 \tabularnewline
42 &  0.1039 &  0.2079 &  0.8961 \tabularnewline
43 &  0.05934 &  0.1187 &  0.9407 \tabularnewline
44 &  0.05297 &  0.1059 &  0.947 \tabularnewline
\hline
\end{tabular}
%Source: https://freestatistics.org/blog/index.php?pk=286894&T=5

[TABLE]
[ROW][C]Goldfeld-Quandt test for Heteroskedasticity[/C][/ROW]
[ROW][C]p-values[/C][C]Alternative Hypothesis[/C][/ROW]
[ROW][C]breakpoint index[/C][C]greater[/C][C]2-sided[/C][C]less[/C][/ROW]
[ROW][C]6[/C][C] 0.2061[/C][C] 0.4123[/C][C] 0.7939[/C][/ROW]
[ROW][C]7[/C][C] 0.09544[/C][C] 0.1909[/C][C] 0.9046[/C][/ROW]
[ROW][C]8[/C][C] 0.04021[/C][C] 0.08042[/C][C] 0.9598[/C][/ROW]
[ROW][C]9[/C][C] 0.04443[/C][C] 0.08887[/C][C] 0.9556[/C][/ROW]
[ROW][C]10[/C][C] 0.02311[/C][C] 0.04622[/C][C] 0.9769[/C][/ROW]
[ROW][C]11[/C][C] 0.009799[/C][C] 0.0196[/C][C] 0.9902[/C][/ROW]
[ROW][C]12[/C][C] 0.1011[/C][C] 0.2022[/C][C] 0.8989[/C][/ROW]
[ROW][C]13[/C][C] 0.06009[/C][C] 0.1202[/C][C] 0.9399[/C][/ROW]
[ROW][C]14[/C][C] 0.04312[/C][C] 0.08623[/C][C] 0.9569[/C][/ROW]
[ROW][C]15[/C][C] 0.02336[/C][C] 0.04671[/C][C] 0.9766[/C][/ROW]
[ROW][C]16[/C][C] 0.01464[/C][C] 0.02928[/C][C] 0.9854[/C][/ROW]
[ROW][C]17[/C][C] 0.007921[/C][C] 0.01584[/C][C] 0.9921[/C][/ROW]
[ROW][C]18[/C][C] 0.005425[/C][C] 0.01085[/C][C] 0.9946[/C][/ROW]
[ROW][C]19[/C][C] 0.003034[/C][C] 0.006068[/C][C] 0.997[/C][/ROW]
[ROW][C]20[/C][C] 0.001517[/C][C] 0.003034[/C][C] 0.9985[/C][/ROW]
[ROW][C]21[/C][C] 0.0008868[/C][C] 0.001774[/C][C] 0.9991[/C][/ROW]
[ROW][C]22[/C][C] 0.001476[/C][C] 0.002951[/C][C] 0.9985[/C][/ROW]
[ROW][C]23[/C][C] 0.0008543[/C][C] 0.001709[/C][C] 0.9991[/C][/ROW]
[ROW][C]24[/C][C] 0.0007566[/C][C] 0.001513[/C][C] 0.9992[/C][/ROW]
[ROW][C]25[/C][C] 0.001369[/C][C] 0.002738[/C][C] 0.9986[/C][/ROW]
[ROW][C]26[/C][C] 0.00136[/C][C] 0.00272[/C][C] 0.9986[/C][/ROW]
[ROW][C]27[/C][C] 0.001674[/C][C] 0.003347[/C][C] 0.9983[/C][/ROW]
[ROW][C]28[/C][C] 0.001293[/C][C] 0.002586[/C][C] 0.9987[/C][/ROW]
[ROW][C]29[/C][C] 0.001218[/C][C] 0.002436[/C][C] 0.9988[/C][/ROW]
[ROW][C]30[/C][C] 0.001149[/C][C] 0.002298[/C][C] 0.9989[/C][/ROW]
[ROW][C]31[/C][C] 0.0009411[/C][C] 0.001882[/C][C] 0.9991[/C][/ROW]
[ROW][C]32[/C][C] 0.0005727[/C][C] 0.001145[/C][C] 0.9994[/C][/ROW]
[ROW][C]33[/C][C] 0.000341[/C][C] 0.0006821[/C][C] 0.9997[/C][/ROW]
[ROW][C]34[/C][C] 0.0003264[/C][C] 0.0006528[/C][C] 0.9997[/C][/ROW]
[ROW][C]35[/C][C] 0.0002949[/C][C] 0.0005898[/C][C] 0.9997[/C][/ROW]
[ROW][C]36[/C][C] 0.001461[/C][C] 0.002921[/C][C] 0.9985[/C][/ROW]
[ROW][C]37[/C][C] 0.001725[/C][C] 0.003451[/C][C] 0.9983[/C][/ROW]
[ROW][C]38[/C][C] 0.2488[/C][C] 0.4977[/C][C] 0.7512[/C][/ROW]
[ROW][C]39[/C][C] 0.1817[/C][C] 0.3635[/C][C] 0.8183[/C][/ROW]
[ROW][C]40[/C][C] 0.1573[/C][C] 0.3146[/C][C] 0.8427[/C][/ROW]
[ROW][C]41[/C][C] 0.1536[/C][C] 0.3071[/C][C] 0.8464[/C][/ROW]
[ROW][C]42[/C][C] 0.1039[/C][C] 0.2079[/C][C] 0.8961[/C][/ROW]
[ROW][C]43[/C][C] 0.05934[/C][C] 0.1187[/C][C] 0.9407[/C][/ROW]
[ROW][C]44[/C][C] 0.05297[/C][C] 0.1059[/C][C] 0.947[/C][/ROW]
[/TABLE]
Source: https://freestatistics.org/blog/index.php?pk=286894&T=5

Globally Unique Identifier (entire table): ba.freestatistics.org/blog/index.php?pk=286894&T=5

As an alternative you can also use a QR Code:  

The GUIDs for individual cells are displayed in the table below:

Goldfeld-Quandt test for Heteroskedasticity
p-valuesAlternative Hypothesis
breakpoint indexgreater2-sidedless
6 0.2061 0.4123 0.7939
7 0.09544 0.1909 0.9046
8 0.04021 0.08042 0.9598
9 0.04443 0.08887 0.9556
10 0.02311 0.04622 0.9769
11 0.009799 0.0196 0.9902
12 0.1011 0.2022 0.8989
13 0.06009 0.1202 0.9399
14 0.04312 0.08623 0.9569
15 0.02336 0.04671 0.9766
16 0.01464 0.02928 0.9854
17 0.007921 0.01584 0.9921
18 0.005425 0.01085 0.9946
19 0.003034 0.006068 0.997
20 0.001517 0.003034 0.9985
21 0.0008868 0.001774 0.9991
22 0.001476 0.002951 0.9985
23 0.0008543 0.001709 0.9991
24 0.0007566 0.001513 0.9992
25 0.001369 0.002738 0.9986
26 0.00136 0.00272 0.9986
27 0.001674 0.003347 0.9983
28 0.001293 0.002586 0.9987
29 0.001218 0.002436 0.9988
30 0.001149 0.002298 0.9989
31 0.0009411 0.001882 0.9991
32 0.0005727 0.001145 0.9994
33 0.000341 0.0006821 0.9997
34 0.0003264 0.0006528 0.9997
35 0.0002949 0.0005898 0.9997
36 0.001461 0.002921 0.9985
37 0.001725 0.003451 0.9983
38 0.2488 0.4977 0.7512
39 0.1817 0.3635 0.8183
40 0.1573 0.3146 0.8427
41 0.1536 0.3071 0.8464
42 0.1039 0.2079 0.8961
43 0.05934 0.1187 0.9407
44 0.05297 0.1059 0.947


Meta Analysis of Goldfeld-Quandt test for Heteroskedasticity
Description# significant tests% significant testsOK/NOK
1% type I error level19 0.4872NOK
5% type I error level250.641026NOK
10% type I error level280.717949NOK

\begin{tabular}{lllllllll}
\hline
Meta Analysis of Goldfeld-Quandt test for Heteroskedasticity \tabularnewline
Description & # significant tests & % significant tests & OK/NOK \tabularnewline
1% type I error level & 19 &  0.4872 & NOK \tabularnewline
5% type I error level & 25 & 0.641026 & NOK \tabularnewline
10% type I error level & 28 & 0.717949 & NOK \tabularnewline
\hline
\end{tabular}
%Source: https://freestatistics.org/blog/index.php?pk=286894&T=6

[TABLE]
[ROW][C]Meta Analysis of Goldfeld-Quandt test for Heteroskedasticity[/C][/ROW]
[ROW][C]Description[/C][C]# significant tests[/C][C]% significant tests[/C][C]OK/NOK[/C][/ROW]
[ROW][C]1% type I error level[/C][C]19[/C][C] 0.4872[/C][C]NOK[/C][/ROW]
[ROW][C]5% type I error level[/C][C]25[/C][C]0.641026[/C][C]NOK[/C][/ROW]
[ROW][C]10% type I error level[/C][C]28[/C][C]0.717949[/C][C]NOK[/C][/ROW]
[/TABLE]
Source: https://freestatistics.org/blog/index.php?pk=286894&T=6

Globally Unique Identifier (entire table): ba.freestatistics.org/blog/index.php?pk=286894&T=6

As an alternative you can also use a QR Code:  

The GUIDs for individual cells are displayed in the table below:

Meta Analysis of Goldfeld-Quandt test for Heteroskedasticity
Description# significant tests% significant testsOK/NOK
1% type I error level19 0.4872NOK
5% type I error level250.641026NOK
10% type I error level280.717949NOK


Parameters (Session):
par1 = 1 ; par2 = Do not include Seasonal Dummies ; par3 = No Linear Trend ; par4 = 0 ; par5 = 0 ;
Parameters (R input):
par1 = 1 ; par2 = Do not include Seasonal Dummies ; par3 = No Linear Trend ; par4 = 0 ; par5 = 0 ;
R code (references can be found in the software module):
library(lattice)
library(lmtest)
n25 <- 25 #minimum number of obs. for Goldfeld-Quandt test
mywarning <- ''
par1 <- as.numeric(par1)
if(is.na(par1)) {
par1 <- 1
mywarning = 'Warning: you did not specify the column number of the endogenous series! The first column was selected by default.'
}
if (par4=='') par4 <- 0
par4 <- as.numeric(par4)
if (par5=='') par5 <- 0
par5 <- as.numeric(par5)
x <- na.omit(t(y))
k <- length(x[1,])
n <- length(x[,1])
x1 <- cbind(x[,par1], x[,1:k!=par1])
mycolnames <- c(colnames(x)[par1], colnames(x)[1:k!=par1])
colnames(x1) <- mycolnames #colnames(x)[par1]
x <- x1
if (par3 == 'First Differences'){
(n <- n -1)
x2 <- array(0, dim=c(n,k), dimnames=list(1:n, paste('(1-B)',colnames(x),sep='')))
for (i in 1:n) {
for (j in 1:k) {
x2[i,j] <- x[i+1,j] - x[i,j]
}
}
x <- x2
}
if (par3 == 'Seasonal Differences (s=12)'){
(n <- n - 12)
x2 <- array(0, dim=c(n,k), dimnames=list(1:n, paste('(1-B12)',colnames(x),sep='')))
for (i in 1:n) {
for (j in 1:k) {
x2[i,j] <- x[i+12,j] - x[i,j]
}
}
x <- x2
}
if (par3 == 'First and Seasonal Differences (s=12)'){
(n <- n -1)
x2 <- array(0, dim=c(n,k), dimnames=list(1:n, paste('(1-B)',colnames(x),sep='')))
for (i in 1:n) {
for (j in 1:k) {
x2[i,j] <- x[i+1,j] - x[i,j]
}
}
x <- x2
(n <- n - 12)
x2 <- array(0, dim=c(n,k), dimnames=list(1:n, paste('(1-B12)',colnames(x),sep='')))
for (i in 1:n) {
for (j in 1:k) {
x2[i,j] <- x[i+12,j] - x[i,j]
}
}
x <- x2
}
if(par4 > 0) {
x2 <- array(0, dim=c(n-par4,par4), dimnames=list(1:(n-par4), paste(colnames(x)[par1],'(t-',1:par4,')',sep='')))
for (i in 1:(n-par4)) {
for (j in 1:par4) {
x2[i,j] <- x[i+par4-j,par1]
}
}
x <- cbind(x[(par4+1):n,], x2)
n <- n - par4
}
if(par5 > 0) {
x2 <- array(0, dim=c(n-par5*12,par5), dimnames=list(1:(n-par5*12), paste(colnames(x)[par1],'(t-',1:par5,'s)',sep='')))
for (i in 1:(n-par5*12)) {
for (j in 1:par5) {
x2[i,j] <- x[i+par5*12-j*12,par1]
}
}
x <- cbind(x[(par5*12+1):n,], x2)
n <- n - par5*12
}
if (par2 == 'Include Monthly Dummies'){
x2 <- array(0, dim=c(n,11), dimnames=list(1:n, paste('M', seq(1:11), sep ='')))
for (i in 1:11){
x2[seq(i,n,12),i] <- 1
}
x <- cbind(x, x2)
}
if (par2 == 'Include Quarterly Dummies'){
x2 <- array(0, dim=c(n,3), dimnames=list(1:n, paste('Q', seq(1:3), sep ='')))
for (i in 1:3){
x2[seq(i,n,4),i] <- 1
}
x <- cbind(x, x2)
}
(k <- length(x[n,]))
if (par3 == 'Linear Trend'){
x <- cbind(x, c(1:n))
colnames(x)[k+1] <- 't'
}
x
(k <- length(x[n,]))
head(x)
df <- as.data.frame(x)
(mylm <- lm(df))
(mysum <- summary(mylm))
if (n > n25) {
kp3 <- k + 3
nmkm3 <- n - k - 3
gqarr <- array(NA, dim=c(nmkm3-kp3+1,3))
numgqtests <- 0
numsignificant1 <- 0
numsignificant5 <- 0
numsignificant10 <- 0
for (mypoint in kp3:nmkm3) {
j <- 0
numgqtests <- numgqtests + 1
for (myalt in c('greater', 'two.sided', 'less')) {
j <- j + 1
gqarr[mypoint-kp3+1,j] <- gqtest(mylm, point=mypoint, alternative=myalt)$p.value
}
if (gqarr[mypoint-kp3+1,2] < 0.01) numsignificant1 <- numsignificant1 + 1
if (gqarr[mypoint-kp3+1,2] < 0.05) numsignificant5 <- numsignificant5 + 1
if (gqarr[mypoint-kp3+1,2] < 0.10) numsignificant10 <- numsignificant10 + 1
}
gqarr
}
bitmap(file='test0.png')
plot(x[,1], type='l', main='Actuals and Interpolation', ylab='value of Actuals and Interpolation (dots)', xlab='time or index')
points(x[,1]-mysum$resid)
grid()
dev.off()
bitmap(file='test1.png')
plot(mysum$resid, type='b', pch=19, main='Residuals', ylab='value of Residuals', xlab='time or index')
grid()
dev.off()
bitmap(file='test2.png')
hist(mysum$resid, main='Residual Histogram', xlab='values of Residuals')
grid()
dev.off()
bitmap(file='test3.png')
densityplot(~mysum$resid,col='black',main='Residual Density Plot', xlab='values of Residuals')
dev.off()
bitmap(file='test4.png')
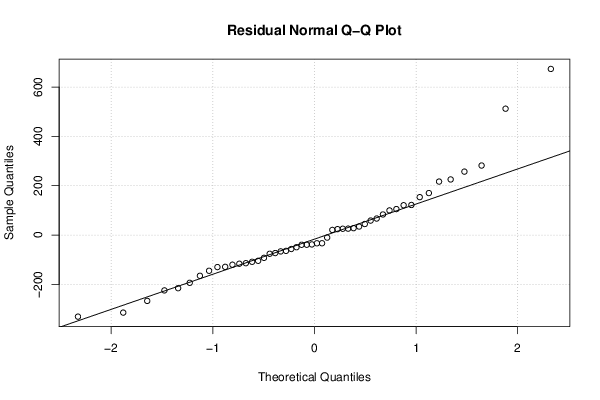
qqnorm(mysum$resid, main='Residual Normal Q-Q Plot')
qqline(mysum$resid)
grid()
dev.off()
(myerror <- as.ts(mysum$resid))
bitmap(file='test5.png')
dum <- cbind(lag(myerror,k=1),myerror)
dum
dum1 <- dum[2:length(myerror),]
dum1
z <- as.data.frame(dum1)
z
plot(z,main=paste('Residual Lag plot, lowess, and regression line'), ylab='values of Residuals', xlab='lagged values of Residuals')
lines(lowess(z))
abline(lm(z))
grid()
dev.off()
bitmap(file='test6.png')
acf(mysum$resid, lag.max=length(mysum$resid)/2, main='Residual Autocorrelation Function')
grid()
dev.off()
bitmap(file='test7.png')
pacf(mysum$resid, lag.max=length(mysum$resid)/2, main='Residual Partial Autocorrelation Function')
grid()
dev.off()
bitmap(file='test8.png')
opar <- par(mfrow = c(2,2), oma = c(0, 0, 1.1, 0))
plot(mylm, las = 1, sub='Residual Diagnostics')
par(opar)
dev.off()
if (n > n25) {
bitmap(file='test9.png')
plot(kp3:nmkm3,gqarr[,2], main='Goldfeld-Quandt test',ylab='2-sided p-value',xlab='breakpoint')
grid()
dev.off()
}
load(file='createtable')
a<-table.start()
a<-table.row.start(a)
a<-table.element(a, 'Multiple Linear Regression - Estimated Regression Equation', 1, TRUE)
a<-table.row.end(a)
myeq <- colnames(x)[1]
myeq <- paste(myeq, '[t] = ', sep='')
for (i in 1:k){
if (mysum$coefficients[i,1] > 0) myeq <- paste(myeq, '+', '')
myeq <- paste(myeq, signif(mysum$coefficients[i,1],6), sep=' ')
if (rownames(mysum$coefficients)[i] != '(Intercept)') {
myeq <- paste(myeq, rownames(mysum$coefficients)[i], sep='')
if (rownames(mysum$coefficients)[i] != 't') myeq <- paste(myeq, '[t]', sep='')
}
}
myeq <- paste(myeq, ' + e[t]')
a<-table.row.start(a)
a<-table.element(a, myeq)
a<-table.row.end(a)
a<-table.row.start(a)
a<-table.element(a, mywarning)
a<-table.row.end(a)
a<-table.end(a)
table.save(a,file='mytable1.tab')
a<-table.start()
a<-table.row.start(a)
a<-table.element(a,hyperlink('ols1.htm','Multiple Linear Regression - Ordinary Least Squares',''), 6, TRUE)
a<-table.row.end(a)
a<-table.row.start(a)
a<-table.element(a,'Variable',header=TRUE)
a<-table.element(a,'Parameter',header=TRUE)
a<-table.element(a,'S.D.',header=TRUE)
a<-table.element(a,'T-STAT
H0: parameter = 0',header=TRUE)
a<-table.element(a,'2-tail p-value',header=TRUE)
a<-table.element(a,'1-tail p-value',header=TRUE)
a<-table.row.end(a)
for (i in 1:k){
a<-table.row.start(a)
a<-table.element(a,rownames(mysum$coefficients)[i],header=TRUE)
a<-table.element(a,formatC(signif(mysum$coefficients[i,1],5),format='g',flag='+'))
a<-table.element(a,formatC(signif(mysum$coefficients[i,2],5),format='g',flag=' '))
a<-table.element(a,formatC(signif(mysum$coefficients[i,3],4),format='e',flag='+'))
a<-table.element(a,formatC(signif(mysum$coefficients[i,4],4),format='g',flag=' '))
a<-table.element(a,formatC(signif(mysum$coefficients[i,4]/2,4),format='g',flag=' '))
a<-table.row.end(a)
}
a<-table.end(a)
table.save(a,file='mytable2.tab')
a<-table.start()
a<-table.row.start(a)
a<-table.element(a, 'Multiple Linear Regression - Regression Statistics', 2, TRUE)
a<-table.row.end(a)
a<-table.row.start(a)
a<-table.element(a, 'Multiple R',1,TRUE)
a<-table.element(a,formatC(signif(sqrt(mysum$r.squared),6),format='g',flag=' '))
a<-table.row.end(a)
a<-table.row.start(a)
a<-table.element(a, 'R-squared',1,TRUE)
a<-table.element(a,formatC(signif(mysum$r.squared,6),format='g',flag=' '))
a<-table.row.end(a)
a<-table.row.start(a)
a<-table.element(a, 'Adjusted R-squared',1,TRUE)
a<-table.element(a,formatC(signif(mysum$adj.r.squared,6),format='g',flag=' '))
a<-table.row.end(a)
a<-table.row.start(a)
a<-table.element(a, 'F-TEST (value)',1,TRUE)
a<-table.element(a,formatC(signif(mysum$fstatistic[1],6),format='g',flag=' '))
a<-table.row.end(a)
a<-table.row.start(a)
a<-table.element(a, 'F-TEST (DF numerator)',1,TRUE)
a<-table.element(a, signif(mysum$fstatistic[2],6))
a<-table.row.end(a)
a<-table.row.start(a)
a<-table.element(a, 'F-TEST (DF denominator)',1,TRUE)
a<-table.element(a, signif(mysum$fstatistic[3],6))
a<-table.row.end(a)
a<-table.row.start(a)
a<-table.element(a, 'p-value',1,TRUE)
a<-table.element(a,formatC(signif(1-pf(mysum$fstatistic[1],mysum$fstatistic[2],mysum$fstatistic[3]),6),format='g',flag=' '))
a<-table.row.end(a)
a<-table.row.start(a)
a<-table.element(a, 'Multiple Linear Regression - Residual Statistics', 2, TRUE)
a<-table.row.end(a)
a<-table.row.start(a)
a<-table.element(a, 'Residual Standard Deviation',1,TRUE)
a<-table.element(a,formatC(signif(mysum$sigma,6),format='g',flag=' '))
a<-table.row.end(a)
a<-table.row.start(a)
a<-table.element(a, 'Sum Squared Residuals',1,TRUE)
a<-table.element(a,formatC(signif(sum(myerror*myerror),6),format='g',flag=' '))
a<-table.row.end(a)
a<-table.end(a)
table.save(a,file='mytable3.tab')
if(n < 200) {
a<-table.start()
a<-table.row.start(a)
a<-table.element(a, 'Multiple Linear Regression - Actuals, Interpolation, and Residuals', 4, TRUE)
a<-table.row.end(a)
a<-table.row.start(a)
a<-table.element(a, 'Time or Index', 1, TRUE)
a<-table.element(a, 'Actuals', 1, TRUE)
a<-table.element(a, 'Interpolation
Forecast', 1, TRUE)
a<-table.element(a, 'Residuals
Prediction Error', 1, TRUE)
a<-table.row.end(a)
for (i in 1:n) {
a<-table.row.start(a)
a<-table.element(a,i, 1, TRUE)
a<-table.element(a,formatC(signif(x[i],6),format='g',flag=' '))
a<-table.element(a,formatC(signif(x[i]-mysum$resid[i],6),format='g',flag=' '))
a<-table.element(a,formatC(signif(mysum$resid[i],6),format='g',flag=' '))
a<-table.row.end(a)
}
a<-table.end(a)
table.save(a,file='mytable4.tab')
if (n > n25) {
a<-table.start()
a<-table.row.start(a)
a<-table.element(a,'Goldfeld-Quandt test for Heteroskedasticity',4,TRUE)
a<-table.row.end(a)
a<-table.row.start(a)
a<-table.element(a,'p-values',header=TRUE)
a<-table.element(a,'Alternative Hypothesis',3,header=TRUE)
a<-table.row.end(a)
a<-table.row.start(a)
a<-table.element(a,'breakpoint index',header=TRUE)
a<-table.element(a,'greater',header=TRUE)
a<-table.element(a,'2-sided',header=TRUE)
a<-table.element(a,'less',header=TRUE)
a<-table.row.end(a)
for (mypoint in kp3:nmkm3) {
a<-table.row.start(a)
a<-table.element(a,mypoint,header=TRUE)
a<-table.element(a,formatC(signif(gqarr[mypoint-kp3+1,1],6),format='g',flag=' '))
a<-table.element(a,formatC(signif(gqarr[mypoint-kp3+1,2],6),format='g',flag=' '))
a<-table.element(a,formatC(signif(gqarr[mypoint-kp3+1,3],6),format='g',flag=' '))
a<-table.row.end(a)
}
a<-table.end(a)
table.save(a,file='mytable5.tab')
a<-table.start()
a<-table.row.start(a)
a<-table.element(a,'Meta Analysis of Goldfeld-Quandt test for Heteroskedasticity',4,TRUE)
a<-table.row.end(a)
a<-table.row.start(a)
a<-table.element(a,'Description',header=TRUE)
a<-table.element(a,'# significant tests',header=TRUE)
a<-table.element(a,'% significant tests',header=TRUE)
a<-table.element(a,'OK/NOK',header=TRUE)
a<-table.row.end(a)
a<-table.row.start(a)
a<-table.element(a,'1% type I error level',header=TRUE)
a<-table.element(a,signif(numsignificant1,6))
a<-table.element(a,formatC(signif(numsignificant1/numgqtests,6),format='g',flag=' '))
if (numsignificant1/numgqtests < 0.01) dum <- 'OK' else dum <- 'NOK'
a<-table.element(a,dum)
a<-table.row.end(a)
a<-table.row.start(a)
a<-table.element(a,'5% type I error level',header=TRUE)
a<-table.element(a,signif(numsignificant5,6))
a<-table.element(a,signif(numsignificant5/numgqtests,6))
if (numsignificant5/numgqtests < 0.05) dum <- 'OK' else dum <- 'NOK'
a<-table.element(a,dum)
a<-table.row.end(a)
a<-table.row.start(a)
a<-table.element(a,'10% type I error level',header=TRUE)
a<-table.element(a,signif(numsignificant10,6))
a<-table.element(a,signif(numsignificant10/numgqtests,6))
if (numsignificant10/numgqtests < 0.1) dum <- 'OK' else dum <- 'NOK'
a<-table.element(a,dum)
a<-table.row.end(a)
a<-table.end(a)
table.save(a,file='mytable6.tab')
}
}