Free Statistics

of Irreproducible Research!

Author's title

Author*Unverified author*
R Software Modulerwasp_multipleregression.wasp
Title produced by softwareMultiple Regression
Date of computationFri, 18 Dec 2015 16:48:52 +0000
Cite this page as followsStatistical Computations at FreeStatistics.org, Office for Research Development and Education, URL https://freestatistics.org/blog/index.php?v=date/2015/Dec/18/t1450457548rxqxpcxtl0mucjq.htm/, Retrieved Thu, 16 May 2024 16:08:44 +0000
Statistical Computations at FreeStatistics.org, Office for Research Development and Education, URL https://freestatistics.org/blog/index.php?pk=286915, Retrieved Thu, 16 May 2024 16:08:44 +0000
QR Codes:

Original text written by user:
IsPrivate?No (this computation is public)
User-defined keywords
Estimated Impact68
Family? (F = Feedback message, R = changed R code, M = changed R Module, P = changed Parameters, D = changed Data)
-       [Multiple Regression] [4] [2015-12-18 16:48:52] [d41d8cd98f00b204e9800998ecf8427e] [Current]
Feedback Forum

Post a new message
Dataseries X:
26	50	4	21	149	96	18	68	86	12,9
57	62	4	22	139	70	31	39	70	12,2
37	54	5	22	148	88	39	32	71	12,8
67	71	4	18	158	114	46	62	108	7,4
43	54	4	23	128	69	31	33	64	6,7
52	65	9	12	224	176	67	52	119	12,6
52	73	8	20	159	114	35	62	97	14,8
43	52	11	22	105	121	52	77	129	13,3
84	84	4	21	159	110	77	76	153	11,1
67	42	4	19	167	158	37	41	78	8,2
49	66	6	22	165	116	32	48	80	11,4
70	65	4	15	159	181	36	63	99	6,4
52	78	8	20	119	77	38	30	68	10,6
58	73	4	19	176	141	69	78	147	12
68	75	4	18	54	35	21	19	40	6,3
62	72	11	15	91	80	26	31	57	11,3
43	66	4	20	163	152	54	66	120	11,9
56	70	4	21	124	97	36	35	71	9,3
56	61	6	21	137	99	42	42	84	9,6
74	81	6	15	121	84	23	45	68	10
65	71	4	16	153	68	34	21	55	6,4
63	69	8	23	148	101	112	25	137	13,8
58	71	5	21	221	107	35	44	79	10,8
57	72	4	18	188	88	47	69	116	13,8
63	68	9	25	149	112	47	54	101	11,7
53	70	4	9	244	171	37	74	111	10,9
57	68	7	30	148	137	109	80	189	16,1
51	61	10	20	92	77	24	42	66	13,4
64	67	4	23	150	66	20	61	81	9,9
53	76	4	16	153	93	22	41	63	11,5
29	70	7	16	94	105	23	46	69	8,3
54	60	12	19	156	131	32	39	71	11,7
58	72	7	25	132	102	30	34	64	9
43	69	5	18	161	161	92	51	143	9,7
51	71	8	23	105	120	43	42	85	10,8
53	62	5	21	97	127	55	31	86	10,3
54	70	4	10	151	77	16	39	55	10,4
56	64	9	14	131	108	49	20	69	12,7
61	58	7	22	166	85	71	49	120	9,3
47	76	4	26	157	168	43	53	96	11,8
39	52	4	23	111	48	29	31	60	5,9
48	59	4	23	145	152	56	39	95	11,4
50	68	4	24	162	75	46	54	100	13
35	76	4	24	163	107	19	49	68	10,8
30	65	7	18	59	62	23	34	57	12,3
68	67	4	23	187	121	59	46	105	11,3
49	59	7	15	109	124	30	55	85	11,8
61	69	4	19	90	72	61	42	103	7,9
67	76	4	16	105	40	7	50	57	12,7
47	63	4	25	83	58	38	13	51	12,3
56	75	4	23	116	97	32	37	69	11,6
50	63	8	17	42	88	16	25	41	6,7
43	60	4	19	148	126	19	30	49	10,9
67	73	4	21	155	104	22	28	50	12,1
62	63	4	18	125	148	48	45	93	13,3
57	70	4	27	116	146	23	35	58	10,1
41	75	7	21	128	80	26	28	54	5,7
54	66	12	13	138	97	33	41	74	14,3
45	63	4	8	49	25	9	6	15	8
48	63	4	29	96	99	24	45	69	13,3
61	64	4	28	164	118	34	73	107	9,3
56	70	5	23	162	58	48	17	65	12,5
41	75	15	21	99	63	18	40	58	7,6
43	61	5	19	202	139	43	64	107	15,9
53	60	10	19	186	50	33	37	70	9,2
44	62	9	20	66	60	28	25	53	9,1
66	73	8	18	183	152	71	65	136	11,1
58	61	4	19	214	142	26	100	126	13
46	66	5	17	188	94	67	28	95	14,5
37	64	4	19	104	66	34	35	69	12,2
51	59	9	25	177	127	80	56	136	12,3
51	64	4	19	126	67	29	29	58	11,4
56	60	10	22	76	90	16	43	59	8,8
66	56	4	23	99	75	59	59	118	14,6
37	78	4	14	139	128	32	50	82	12,6
42	67	7	16	162	146	43	59	102	13
38	59	5	24	108	69	38	27	65	12,6
66	66	4	20	159	186	29	61	90	13,2
34	68	4	12	74	81	36	28	64	9,9
53	71	4	24	110	85	32	51	83	7,7
49	66	4	22	96	54	35	35	70	10,5
55	73	4	12	116	46	21	29	50	13,4
49	72	4	22	87	106	29	48	77	10,9
59	71	6	20	97	34	12	25	37	4,3
40	59	10	10	127	60	37	44	81	10,3
58	64	7	23	106	95	37	64	101	11,8
60	66	4	17	80	57	47	32	79	11,2
63	78	4	22	74	62	51	20	71	11,4
56	68	7	24	91	36	32	28	60	8,6
54	73	4	18	133	56	21	34	55	13,2
52	62	8	21	74	54	13	31	44	12,6
34	65	11	20	114	64	14	26	40	5,6
69	68	6	20	140	76	-2	58	56	9,9
32	65	14	22	95	98	20	23	43	8,8
48	60	5	19	98	88	24	21	45	7,7
67	71	4	20	121	35	11	21	32	9
58	65	8	26	126	102	23	33	56	7,3
57	68	9	23	98	61	24	16	40	11,4
42	64	4	24	95	80	14	20	34	13,6
64	74	4	21	110	49	52	37	89	7,9
58	69	5	21	70	78	15	35	50	10,7
66	76	4	19	102	90	23	33	56	10,3
26	68	5	8	86	45	19	27	46	8,3
61	72	4	17	130	55	35	41	76	9,6
52	67	4	20	96	96	24	40	64	14,2
51	63	7	11	102	43	39	35	74	8,5
55	59	10	8	100	52	29	28	57	13,5
50	73	4	15	94	60	13	32	45	4,9
60	66	5	18	52	54	8	22	30	6,4
56	62	4	18	98	51	18	44	62	9,6
63	69	4	19	118	51	24	27	51	11,6
61	66	4	19	99	38	19	17	36	11,1
52	51	6	23	48	41	23	12	34	4,35
16	56	4	22	50	146	16	45	61	12,7
46	67	8	21	150	182	33	37	70	18,1
56	69	5	25	154	192	32	37	69	17,85
52	57	4	30	109	263	37	108	145	16,6
55	56	17	17	68	35	14	10	23	12,6
50	55	4	27	194	439	52	68	120	17,1
59	63	4	23	158	214	75	72	147	19,1
60	67	8	23	159	341	72	143	215	16,1
52	65	4	18	67	58	15	9	24	13,35
44	47	7	18	147	292	29	55	84	18,4
67	76	4	23	39	85	13	17	30	14,7
52	64	4	19	100	200	40	37	77	10,6
55	68	5	15	111	158	19	27	46	12,6
37	64	7	20	138	199	24	37	61	16,2
54	65	4	16	101	297	121	58	178	13,6
72	71	4	24	131	227	93	66	160	18,9
51	63	7	25	101	108	36	21	57	14,1
48	60	11	25	114	86	23	19	42	14,5
60	68	7	19	165	302	85	78	163	16,15
50	72	4	19	114	148	41	35	75	14,75
63	70	4	16	111	178	46	48	94	14,8
33	61	4	19	75	120	18	27	45	12,45
67	61	4	19	82	207	35	43	78	12,65
46	62	4	23	121	157	17	30	47	17,35
54	71	4	21	32	128	4	25	29	8,6
59	71	6	22	150	296	28	69	97	18,4
61	51	8	19	117	323	44	72	116	16,1
33	56	23	20	71	79	10	23	32	11,6
47	70	4	20	165	70	38	13	50	17,75
69	73	8	3	154	146	57	61	118	15,25
52	76	6	23	126	246	23	43	66	17,65
55	68	4	23	149	196	36	51	86	16,35
41	48	7	20	145	199	22	67	89	17,65
73	52	4	15	120	127	40	36	76	13,6
52	60	4	16	109	153	31	44	75	14,35
50	59	4	7	132	299	11	45	57	14,75
51	57	10	24	172	228	38	34	72	18,25
60	79	6	17	169	190	24	36	60	9,9
56	60	5	24	114	180	37	72	109	16
56	60	5	24	156	212	37	39	76	18,25
29	59	4	19	172	269	22	43	65	16,85
66	62	4	25	68	130	15	25	40	14,6
66	59	5	20	89	179	2	56	58	13,85
73	61	5	28	167	243	43	80	123	18,95
55	71	5	23	113	190	31	40	71	15,6
64	57	5	27	115	299	29	73	102	14,85
40	66	4	18	78	121	45	34	80	11,75
46	63	6	28	118	137	25	72	97	18,45
58	69	4	21	87	305	4	42	46	15,9
43	58	4	19	173	157	31	61	93	17,1
61	59	4	23	2	96	-4	23	19	16,1
51	48	9	27	162	183	66	74	140	19,9
50	66	18	22	49	52	61	16	78	10,95
52	73	6	28	122	238	32	66	98	18,45
54	67	5	25	96	40	31	9	40	15,1
66	61	4	21	100	226	39	41	80	15
61	68	11	22	82	190	19	57	76	11,35
80	75	4	28	100	214	31	48	79	15,95
51	62	10	20	115	145	36	51	87	18,1
56	69	6	29	141	119	42	53	95	14,6
56	58	8	25	165	222	21	29	49	15,4
56	60	8	25	165	222	21	29	49	15,4
53	74	6	20	110	159	25	55	80	17,6
47	55	8	20	118	165	32	54	86	13,35
25	62	4	16	158	249	26	43	69	19,1
47	63	4	20	146	125	28	51	79	15,35
46	69	9	20	49	122	32	20	52	7,6
50	58	9	23	90	186	41	79	120	13,4
39	58	5	18	121	148	29	39	69	13,9
51	68	4	25	155	274	33	61	94	19,1
58	72	4	18	104	172	17	55	72	15,25
35	62	15	19	147	84	13	30	43	12,9
58	62	10	25	110	168	32	55	87	16,1
60	65	9	25	108	102	30	22	52	17,35
62	69	7	25	113	106	34	37	71	13,15
63	66	9	24	115	2	59	2	61	12,15
53	72	6	19	61	139	13	38	51	12,6
46	62	4	26	60	95	23	27	50	10,35
67	75	7	10	109	130	10	56	67	15,4
59	58	4	17	68	72	5	25	30	9,6
64	66	7	13	111	141	31	39	70	18,2
38	55	4	17	77	113	19	33	52	13,6
50	47	15	30	73	206	32	43	75	14,85
48	72	4	25	151	268	30	57	87	14,75
48	62	9	4	89	175	25	43	69	14,1
47	64	4	16	78	77	48	23	72	14,9
66	64	4	21	110	125	35	44	79	16,25
47	19	28	23	220	255	67	54	121	19,25
63	50	4	22	65	111	15	28	43	13,6
58	68	4	17	141	132	22	36	58	13,6
44	70	4	20	117	211	18	39	57	15,65
51	79	5	20	122	92	33	16	50	12,75
43	69	4	22	63	76	46	23	69	14,6
55	71	4	16	44	171	24	40	64	9,85
38	48	12	23	52	83	14	24	38	12,65
45	73	4	0	131	266	12	78	90	19,2
50	74	6	18	101	186	38	57	96	16,6
54	66	6	25	42	50	12	37	49	11,2
57	71	5	23	152	117	28	27	56	15,25
60	74	4	12	107	219	41	61	102	11,9
55	78	4	18	77	246	12	27	40	13,2
56	75	4	24	154	279	31	69	100	16,35
49	53	10	11	103	148	33	34	67	12,4
37	60	7	18	96	137	34	44	78	15,85
59	70	4	23	175	181	21	34	55	18,15
46	69	7	24	57	98	20	39	59	11,15
51	65	4	29	112	226	44	51	96	15,65
58	78	4	18	143	234	52	34	86	17,75
64	78	12	15	49	138	7	31	38	7,65
53	59	5	29	110	85	29	13	43	12,35
48	72	8	16	131	66	11	12	23	15,6
51	70	6	19	167	236	26	51	77	19,3
47	63	17	22	56	106	24	24	48	15,2
59	63	4	16	137	135	7	19	26	17,1
62	71	5	23	86	122	60	30	91	15,6
62	74	4	23	121	218	13	81	94	18,4
51	67	5	19	149	199	20	42	62	19,05
64	66	5	4	168	112	52	22	74	18,55
52	62	6	20	140	278	28	85	114	19,1
67	80	4	24	88	94	25	27	52	13,1
50	73	4	20	168	113	39	25	64	12,85
54	67	4	4	94	84	9	22	31	9,5
58	61	6	24	51	86	19	19	38	4,5
56	73	8	22	48	62	13	14	27	11,85
63	74	10	16	145	222	60	45	105	13,6
31	32	4	3	66	167	19	45	64	11,7
65	69	5	15	85	82	34	28	62	12,4
71	69	4	24	109	207	14	51	65	13,35
50	84	4	17	63	184	17	41	58	11,4
57	64	4	20	102	83	45	31	76	14,9
47	58	16	27	162	183	66	74	140	19,9
47	59	7	26	86	89	48	19	68	11,2
57	78	4	23	114	225	29	51	80	14,6
43	57	4	17	164	237	-2	73	71	17,6
41	60	14	20	119	102	51	24	76	14,05
63	68	5	22	126	221	2	61	63	16,1
63	68	5	19	132	128	24	23	46	13,35
56	73	5	24	142	91	40	14	53	11,85
51	69	5	19	83	198	20	54	74	11,95
50	67	7	23	94	204	19	51	70	14,75
22	60	19	15	81	158	16	62	78	15,15
41	65	16	27	166	138	20	36	56	13,2
59	66	4	26	110	226	40	59	100	16,85
56	74	4	22	64	44	27	24	51	7,85
66	81	7	22	93	196	25	26	52	7,7
53	72	9	18	104	83	49	54	102	12,6
42	55	5	15	105	79	39	39	78	7,85
52	49	14	22	49	52	61	16	78	10,95
54	74	4	27	88	105	19	36	55	12,35
44	53	16	10	95	116	67	31	98	9,95
62	64	10	20	102	83	45	31	76	14,9
53	65	5	17	99	196	30	42	73	16,65
50	57	6	23	63	153	8	39	47	13,4
36	51	4	19	76	157	19	25	45	13,95
76	80	4	13	109	75	52	31	83	15,7
66	67	4	27	117	106	22	38	60	16,85
62	70	5	23	57	58	17	31	48	10,95
59	74	4	16	120	75	33	17	50	15,35
47	75	4	25	73	74	34	22	56	12,2
55	70	5	2	91	185	22	55	77	15,1
58	69	4	26	108	265	30	62	91	17,75
60	65	4	20	105	131	25	51	76	15,2
44	55	5	23	117	139	38	30	68	14,6
57	71	8	22	119	196	26	49	74	16,65
45	65	15	24	31	78	13	16	29	8,1


Summary of computational transaction
Raw Inputview raw input (R code)
Raw Outputview raw output of R engine
Computing time8 seconds
R Server'Sir Ronald Aylmer Fisher' @ fisher.wessa.net
R Framework error message
The field 'Names of X columns' contains a hard return which cannot be interpreted.
Please, resubmit your request without hard returns in the 'Names of X columns'.

\begin{tabular}{lllllllll}
\hline
Summary of computational transaction \tabularnewline
Raw Input & view raw input (R code)  \tabularnewline
Raw Output & view raw output of R engine  \tabularnewline
Computing time & 8 seconds \tabularnewline
R Server & 'Sir Ronald Aylmer Fisher' @ fisher.wessa.net \tabularnewline
R Framework error message & 
The field 'Names of X columns' contains a hard return which cannot be interpreted.
Please, resubmit your request without hard returns in the 'Names of X columns'.
\tabularnewline \hline \end{tabular} %Source: https://freestatistics.org/blog/index.php?pk=286915&T=0

[TABLE]
[ROW][C]Summary of computational transaction[/C][/ROW]
[ROW][C]Raw Input[/C][C]view raw input (R code) [/C][/ROW]
[ROW][C]Raw Output[/C][C]view raw output of R engine [/C][/ROW]
[ROW][C]Computing time[/C][C]8 seconds[/C][/ROW]
[ROW][C]R Server[/C][C]'Sir Ronald Aylmer Fisher' @ fisher.wessa.net[/C][/ROW]
[ROW][C]R Framework error message[/C][C]
The field 'Names of X columns' contains a hard return which cannot be interpreted.
Please, resubmit your request without hard returns in the 'Names of X columns'.
[/C][/ROW] [/TABLE] Source: https://freestatistics.org/blog/index.php?pk=286915&T=0

Globally Unique Identifier (entire table): ba.freestatistics.org/blog/index.php?pk=286915&T=0

As an alternative you can also use a QR Code:  

The GUIDs for individual cells are displayed in the table below:

Summary of computational transaction
Raw Inputview raw input (R code)
Raw Outputview raw output of R engine
Computing time8 seconds
R Server'Sir Ronald Aylmer Fisher' @ fisher.wessa.net
R Framework error message
The field 'Names of X columns' contains a hard return which cannot be interpreted.
Please, resubmit your request without hard returns in the 'Names of X columns'.


Multiple Linear Regression - Estimated Regression Equation
TOT [t] = + 8.25603 + 0.00261901AMS.I[t] -0.01975AMS.E[t] + 0.029883AMS.A[t] + 0.0491566NUMERACYTOT[t] + 0.0119326LFM[t] + 0.0271545B[t] -0.434853PRH[t] -0.443113CH[t] + 0.435175H[t] + e[t]

\begin{tabular}{lllllllll}
\hline
Multiple Linear Regression - Estimated Regression Equation \tabularnewline
TOT


[t] =  +  8.25603 +  0.00261901AMS.I[t] -0.01975AMS.E[t] +  0.029883AMS.A[t] +  0.0491566NUMERACYTOT[t] +  0.0119326LFM[t] +  0.0271545B[t] -0.434853PRH[t] -0.443113CH[t] +  0.435175H[t]  + e[t] \tabularnewline
 \tabularnewline
\hline
\end{tabular}
%Source: https://freestatistics.org/blog/index.php?pk=286915&T=1

[TABLE]
[ROW][C]Multiple Linear Regression - Estimated Regression Equation[/C][/ROW]
[ROW][C]TOT


[t] =  +  8.25603 +  0.00261901AMS.I[t] -0.01975AMS.E[t] +  0.029883AMS.A[t] +  0.0491566NUMERACYTOT[t] +  0.0119326LFM[t] +  0.0271545B[t] -0.434853PRH[t] -0.443113CH[t] +  0.435175H[t]  + e[t][/C][/ROW]
[ROW][C][/C][/ROW]
[/TABLE]
Source: https://freestatistics.org/blog/index.php?pk=286915&T=1

Globally Unique Identifier (entire table): ba.freestatistics.org/blog/index.php?pk=286915&T=1

As an alternative you can also use a QR Code:  

The GUIDs for individual cells are displayed in the table below:

Multiple Linear Regression - Estimated Regression Equation
TOT [t] = + 8.25603 + 0.00261901AMS.I[t] -0.01975AMS.E[t] + 0.029883AMS.A[t] + 0.0491566NUMERACYTOT[t] + 0.0119326LFM[t] + 0.0271545B[t] -0.434853PRH[t] -0.443113CH[t] + 0.435175H[t] + e[t]


Multiple Linear Regression - Ordinary Least Squares
VariableParameterS.D.T-STATH0: parameter = 02-tail p-value1-tail p-value
(Intercept)+8.256 1.835+4.4990e+00 1.018e-05 5.089e-06
AMS.I+0.002619 0.01749+1.4980e-01 0.8811 0.4405
AMS.E-0.01975 0.02254-8.7620e-01 0.3817 0.1909
AMS.A+0.02988 0.05107+5.8510e-01 0.559 0.2795
NUMERACYTOT+0.04916 0.03244+1.5150e+00 0.1308 0.06542
LFM+0.01193 0.004878+2.4460e+00 0.01509 0.007543
B+0.02715 0.002944+9.2250e+00 8.77e-18 4.385e-18
PRH-0.4349 0.4505-9.6540e-01 0.3352 0.1676
CH-0.4431 0.4496-9.8560e-01 0.3252 0.1626
H+0.4352 0.4494+9.6830e-01 0.3338 0.1669

\begin{tabular}{lllllllll}
\hline
Multiple Linear Regression - Ordinary Least Squares \tabularnewline
Variable & Parameter & S.D. & T-STATH0: parameter = 0 & 2-tail p-value & 1-tail p-value \tabularnewline
(Intercept) & +8.256 &  1.835 & +4.4990e+00 &  1.018e-05 &  5.089e-06 \tabularnewline
AMS.I & +0.002619 &  0.01749 & +1.4980e-01 &  0.8811 &  0.4405 \tabularnewline
AMS.E & -0.01975 &  0.02254 & -8.7620e-01 &  0.3817 &  0.1909 \tabularnewline
AMS.A & +0.02988 &  0.05107 & +5.8510e-01 &  0.559 &  0.2795 \tabularnewline
NUMERACYTOT & +0.04916 &  0.03244 & +1.5150e+00 &  0.1308 &  0.06542 \tabularnewline
LFM & +0.01193 &  0.004878 & +2.4460e+00 &  0.01509 &  0.007543 \tabularnewline
B & +0.02715 &  0.002944 & +9.2250e+00 &  8.77e-18 &  4.385e-18 \tabularnewline
PRH & -0.4349 &  0.4505 & -9.6540e-01 &  0.3352 &  0.1676 \tabularnewline
CH & -0.4431 &  0.4496 & -9.8560e-01 &  0.3252 &  0.1626 \tabularnewline
H & +0.4352 &  0.4494 & +9.6830e-01 &  0.3338 &  0.1669 \tabularnewline
\hline
\end{tabular}
%Source: https://freestatistics.org/blog/index.php?pk=286915&T=2

[TABLE]
[ROW][C]Multiple Linear Regression - Ordinary Least Squares[/C][/ROW]
[ROW][C]Variable[/C][C]Parameter[/C][C]S.D.[/C][C]T-STATH0: parameter = 0[/C][C]2-tail p-value[/C][C]1-tail p-value[/C][/ROW]
[ROW][C](Intercept)[/C][C]+8.256[/C][C] 1.835[/C][C]+4.4990e+00[/C][C] 1.018e-05[/C][C] 5.089e-06[/C][/ROW]
[ROW][C]AMS.I[/C][C]+0.002619[/C][C] 0.01749[/C][C]+1.4980e-01[/C][C] 0.8811[/C][C] 0.4405[/C][/ROW]
[ROW][C]AMS.E[/C][C]-0.01975[/C][C] 0.02254[/C][C]-8.7620e-01[/C][C] 0.3817[/C][C] 0.1909[/C][/ROW]
[ROW][C]AMS.A[/C][C]+0.02988[/C][C] 0.05107[/C][C]+5.8510e-01[/C][C] 0.559[/C][C] 0.2795[/C][/ROW]
[ROW][C]NUMERACYTOT[/C][C]+0.04916[/C][C] 0.03244[/C][C]+1.5150e+00[/C][C] 0.1308[/C][C] 0.06542[/C][/ROW]
[ROW][C]LFM[/C][C]+0.01193[/C][C] 0.004878[/C][C]+2.4460e+00[/C][C] 0.01509[/C][C] 0.007543[/C][/ROW]
[ROW][C]B[/C][C]+0.02715[/C][C] 0.002944[/C][C]+9.2250e+00[/C][C] 8.77e-18[/C][C] 4.385e-18[/C][/ROW]
[ROW][C]PRH[/C][C]-0.4349[/C][C] 0.4505[/C][C]-9.6540e-01[/C][C] 0.3352[/C][C] 0.1676[/C][/ROW]
[ROW][C]CH[/C][C]-0.4431[/C][C] 0.4496[/C][C]-9.8560e-01[/C][C] 0.3252[/C][C] 0.1626[/C][/ROW]
[ROW][C]H[/C][C]+0.4352[/C][C] 0.4494[/C][C]+9.6830e-01[/C][C] 0.3338[/C][C] 0.1669[/C][/ROW]
[/TABLE]
Source: https://freestatistics.org/blog/index.php?pk=286915&T=2

Globally Unique Identifier (entire table): ba.freestatistics.org/blog/index.php?pk=286915&T=2

As an alternative you can also use a QR Code:  

The GUIDs for individual cells are displayed in the table below:

Multiple Linear Regression - Ordinary Least Squares
VariableParameterS.D.T-STATH0: parameter = 02-tail p-value1-tail p-value
(Intercept)+8.256 1.835+4.4990e+00 1.018e-05 5.089e-06
AMS.I+0.002619 0.01749+1.4980e-01 0.8811 0.4405
AMS.E-0.01975 0.02254-8.7620e-01 0.3817 0.1909
AMS.A+0.02988 0.05107+5.8510e-01 0.559 0.2795
NUMERACYTOT+0.04916 0.03244+1.5150e+00 0.1308 0.06542
LFM+0.01193 0.004878+2.4460e+00 0.01509 0.007543
B+0.02715 0.002944+9.2250e+00 8.77e-18 4.385e-18
PRH-0.4349 0.4505-9.6540e-01 0.3352 0.1676
CH-0.4431 0.4496-9.8560e-01 0.3252 0.1626
H+0.4352 0.4494+9.6830e-01 0.3338 0.1669


Multiple Linear Regression - Regression Statistics
Multiple R 0.6163
R-squared 0.3799
Adjusted R-squared 0.3591
F-TEST (value) 18.24
F-TEST (DF numerator)9
F-TEST (DF denominator)268
p-value 0
Multiple Linear Regression - Residual Statistics
Residual Standard Deviation 2.717
Sum Squared Residuals 1979

\begin{tabular}{lllllllll}
\hline
Multiple Linear Regression - Regression Statistics \tabularnewline
Multiple R &  0.6163 \tabularnewline
R-squared &  0.3799 \tabularnewline
Adjusted R-squared &  0.3591 \tabularnewline
F-TEST (value) &  18.24 \tabularnewline
F-TEST (DF numerator) & 9 \tabularnewline
F-TEST (DF denominator) & 268 \tabularnewline
p-value &  0 \tabularnewline
Multiple Linear Regression - Residual Statistics \tabularnewline
Residual Standard Deviation &  2.717 \tabularnewline
Sum Squared Residuals &  1979 \tabularnewline
\hline
\end{tabular}
%Source: https://freestatistics.org/blog/index.php?pk=286915&T=3

[TABLE]
[ROW][C]Multiple Linear Regression - Regression Statistics[/C][/ROW]
[ROW][C]Multiple R[/C][C] 0.6163[/C][/ROW]
[ROW][C]R-squared[/C][C] 0.3799[/C][/ROW]
[ROW][C]Adjusted R-squared[/C][C] 0.3591[/C][/ROW]
[ROW][C]F-TEST (value)[/C][C] 18.24[/C][/ROW]
[ROW][C]F-TEST (DF numerator)[/C][C]9[/C][/ROW]
[ROW][C]F-TEST (DF denominator)[/C][C]268[/C][/ROW]
[ROW][C]p-value[/C][C] 0[/C][/ROW]
[ROW][C]Multiple Linear Regression - Residual Statistics[/C][/ROW]
[ROW][C]Residual Standard Deviation[/C][C] 2.717[/C][/ROW]
[ROW][C]Sum Squared Residuals[/C][C] 1979[/C][/ROW]
[/TABLE]
Source: https://freestatistics.org/blog/index.php?pk=286915&T=3

Globally Unique Identifier (entire table): ba.freestatistics.org/blog/index.php?pk=286915&T=3

As an alternative you can also use a QR Code:  

The GUIDs for individual cells are displayed in the table below:

Multiple Linear Regression - Regression Statistics
Multiple R 0.6163
R-squared 0.3799
Adjusted R-squared 0.3591
F-TEST (value) 18.24
F-TEST (DF numerator)9
F-TEST (DF denominator)268
p-value 0
Multiple Linear Regression - Residual Statistics
Residual Standard Deviation 2.717
Sum Squared Residuals 1979


Parameters (Session):
par1 = 1 ; par2 = 2 ; par3 = Pearson Chi-Squared ;
Parameters (R input):
par1 = 10 ; par2 = Do not include Seasonal Dummies ; par3 = No Linear Trend ; par4 = 0 ; par5 = 0 ;
R code (references can be found in the software module):
library(lattice)
library(lmtest)
n25 <- 25 #minimum number of obs. for Goldfeld-Quandt test
mywarning <- ''
par1 <- as.numeric(par1)
if(is.na(par1)) {
par1 <- 1
mywarning = 'Warning: you did not specify the column number of the endogenous series! The first column was selected by default.'
}
if (par4=='') par4 <- 0
par4 <- as.numeric(par4)
if (par5=='') par5 <- 0
par5 <- as.numeric(par5)
x <- na.omit(t(y))
k <- length(x[1,])
n <- length(x[,1])
x1 <- cbind(x[,par1], x[,1:k!=par1])
mycolnames <- c(colnames(x)[par1], colnames(x)[1:k!=par1])
colnames(x1) <- mycolnames #colnames(x)[par1]
x <- x1
if (par3 == 'First Differences'){
(n <- n -1)
x2 <- array(0, dim=c(n,k), dimnames=list(1:n, paste('(1-B)',colnames(x),sep='')))
for (i in 1:n) {
for (j in 1:k) {
x2[i,j] <- x[i+1,j] - x[i,j]
}
}
x <- x2
}
if (par3 == 'Seasonal Differences (s=12)'){
(n <- n - 12)
x2 <- array(0, dim=c(n,k), dimnames=list(1:n, paste('(1-B12)',colnames(x),sep='')))
for (i in 1:n) {
for (j in 1:k) {
x2[i,j] <- x[i+12,j] - x[i,j]
}
}
x <- x2
}
if (par3 == 'First and Seasonal Differences (s=12)'){
(n <- n -1)
x2 <- array(0, dim=c(n,k), dimnames=list(1:n, paste('(1-B)',colnames(x),sep='')))
for (i in 1:n) {
for (j in 1:k) {
x2[i,j] <- x[i+1,j] - x[i,j]
}
}
x <- x2
(n <- n - 12)
x2 <- array(0, dim=c(n,k), dimnames=list(1:n, paste('(1-B12)',colnames(x),sep='')))
for (i in 1:n) {
for (j in 1:k) {
x2[i,j] <- x[i+12,j] - x[i,j]
}
}
x <- x2
}
if(par4 > 0) {
x2 <- array(0, dim=c(n-par4,par4), dimnames=list(1:(n-par4), paste(colnames(x)[par1],'(t-',1:par4,')',sep='')))
for (i in 1:(n-par4)) {
for (j in 1:par4) {
x2[i,j] <- x[i+par4-j,par1]
}
}
x <- cbind(x[(par4+1):n,], x2)
n <- n - par4
}
if(par5 > 0) {
x2 <- array(0, dim=c(n-par5*12,par5), dimnames=list(1:(n-par5*12), paste(colnames(x)[par1],'(t-',1:par5,'s)',sep='')))
for (i in 1:(n-par5*12)) {
for (j in 1:par5) {
x2[i,j] <- x[i+par5*12-j*12,par1]
}
}
x <- cbind(x[(par5*12+1):n,], x2)
n <- n - par5*12
}
if (par2 == 'Include Monthly Dummies'){
x2 <- array(0, dim=c(n,11), dimnames=list(1:n, paste('M', seq(1:11), sep ='')))
for (i in 1:11){
x2[seq(i,n,12),i] <- 1
}
x <- cbind(x, x2)
}
if (par2 == 'Include Quarterly Dummies'){
x2 <- array(0, dim=c(n,3), dimnames=list(1:n, paste('Q', seq(1:3), sep ='')))
for (i in 1:3){
x2[seq(i,n,4),i] <- 1
}
x <- cbind(x, x2)
}
(k <- length(x[n,]))
if (par3 == 'Linear Trend'){
x <- cbind(x, c(1:n))
colnames(x)[k+1] <- 't'
}
x
(k <- length(x[n,]))
head(x)
df <- as.data.frame(x)
(mylm <- lm(df))
(mysum <- summary(mylm))
if (n > n25) {
kp3 <- k + 3
nmkm3 <- n - k - 3
gqarr <- array(NA, dim=c(nmkm3-kp3+1,3))
numgqtests <- 0
numsignificant1 <- 0
numsignificant5 <- 0
numsignificant10 <- 0
for (mypoint in kp3:nmkm3) {
j <- 0
numgqtests <- numgqtests + 1
for (myalt in c('greater', 'two.sided', 'less')) {
j <- j + 1
gqarr[mypoint-kp3+1,j] <- gqtest(mylm, point=mypoint, alternative=myalt)$p.value
}
if (gqarr[mypoint-kp3+1,2] < 0.01) numsignificant1 <- numsignificant1 + 1
if (gqarr[mypoint-kp3+1,2] < 0.05) numsignificant5 <- numsignificant5 + 1
if (gqarr[mypoint-kp3+1,2] < 0.10) numsignificant10 <- numsignificant10 + 1
}
gqarr
}
bitmap(file='test0.png')
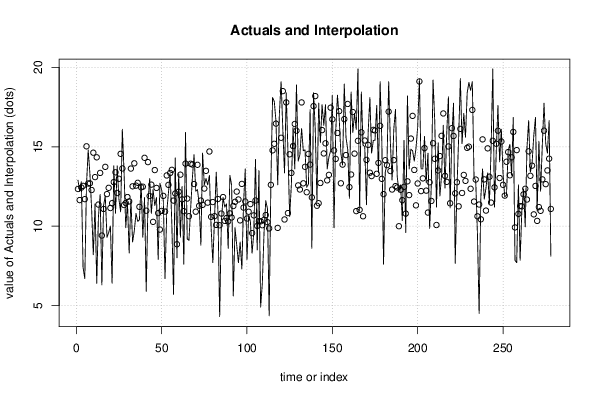
plot(x[,1], type='l', main='Actuals and Interpolation', ylab='value of Actuals and Interpolation (dots)', xlab='time or index')
points(x[,1]-mysum$resid)
grid()
dev.off()
bitmap(file='test1.png')
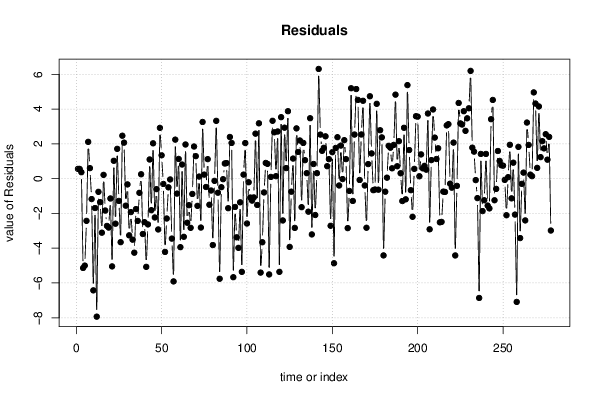
plot(mysum$resid, type='b', pch=19, main='Residuals', ylab='value of Residuals', xlab='time or index')
grid()
dev.off()
bitmap(file='test2.png')
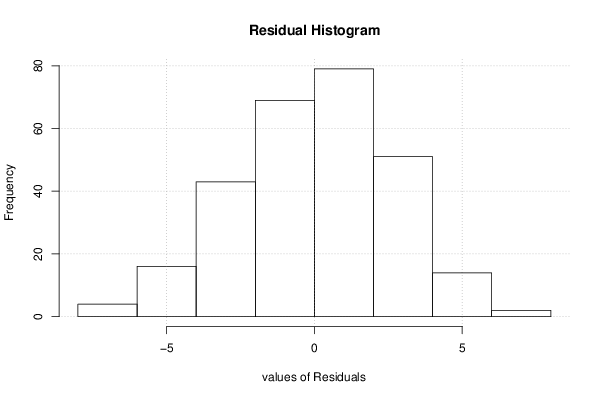
hist(mysum$resid, main='Residual Histogram', xlab='values of Residuals')
grid()
dev.off()
bitmap(file='test3.png')
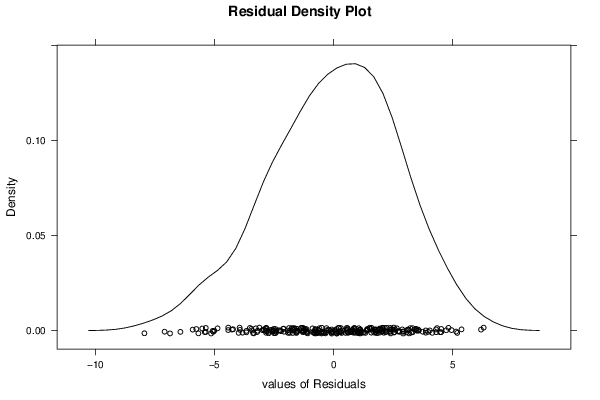
densityplot(~mysum$resid,col='black',main='Residual Density Plot', xlab='values of Residuals')
dev.off()
bitmap(file='test4.png')
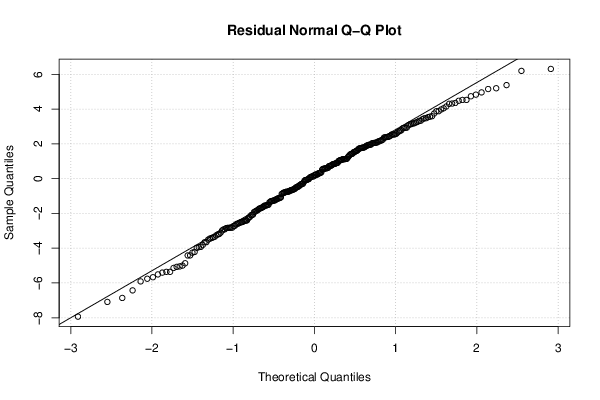
qqnorm(mysum$resid, main='Residual Normal Q-Q Plot')
qqline(mysum$resid)
grid()
dev.off()
(myerror <- as.ts(mysum$resid))
bitmap(file='test5.png')
dum <- cbind(lag(myerror,k=1),myerror)
dum
dum1 <- dum[2:length(myerror),]
dum1
z <- as.data.frame(dum1)
z
plot(z,main=paste('Residual Lag plot, lowess, and regression line'), ylab='values of Residuals', xlab='lagged values of Residuals')
lines(lowess(z))
abline(lm(z))
grid()
dev.off()
bitmap(file='test6.png')
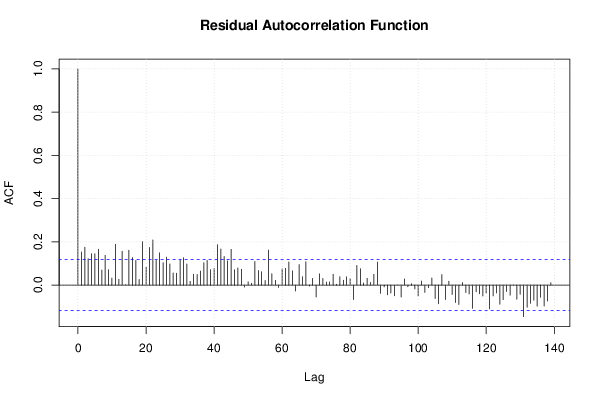
acf(mysum$resid, lag.max=length(mysum$resid)/2, main='Residual Autocorrelation Function')
grid()
dev.off()
bitmap(file='test7.png')
pacf(mysum$resid, lag.max=length(mysum$resid)/2, main='Residual Partial Autocorrelation Function')
grid()
dev.off()
bitmap(file='test8.png')
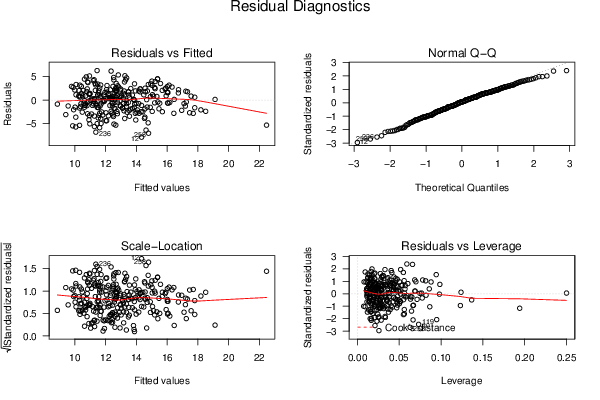
opar <- par(mfrow = c(2,2), oma = c(0, 0, 1.1, 0))
plot(mylm, las = 1, sub='Residual Diagnostics')
par(opar)
dev.off()
if (n > n25) {
bitmap(file='test9.png')
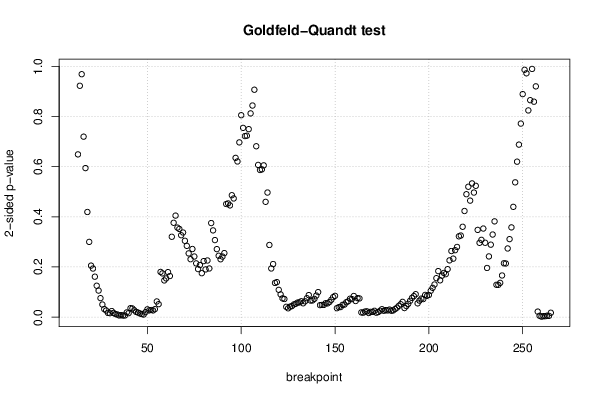
plot(kp3:nmkm3,gqarr[,2], main='Goldfeld-Quandt test',ylab='2-sided p-value',xlab='breakpoint')
grid()
dev.off()
}
load(file='createtable')
a<-table.start()
a<-table.row.start(a)
a<-table.element(a, 'Multiple Linear Regression - Estimated Regression Equation', 1, TRUE)
a<-table.row.end(a)
myeq <- colnames(x)[1]
myeq <- paste(myeq, '[t] = ', sep='')
for (i in 1:k){
if (mysum$coefficients[i,1] > 0) myeq <- paste(myeq, '+', '')
myeq <- paste(myeq, signif(mysum$coefficients[i,1],6), sep=' ')
if (rownames(mysum$coefficients)[i] != '(Intercept)') {
myeq <- paste(myeq, rownames(mysum$coefficients)[i], sep='')
if (rownames(mysum$coefficients)[i] != 't') myeq <- paste(myeq, '[t]', sep='')
}
}
myeq <- paste(myeq, ' + e[t]')
a<-table.row.start(a)
a<-table.element(a, myeq)
a<-table.row.end(a)
a<-table.row.start(a)
a<-table.element(a, mywarning)
a<-table.row.end(a)
a<-table.end(a)
table.save(a,file='mytable1.tab')
a<-table.start()
a<-table.row.start(a)
a<-table.element(a,hyperlink('ols1.htm','Multiple Linear Regression - Ordinary Least Squares',''), 6, TRUE)
a<-table.row.end(a)
a<-table.row.start(a)
a<-table.element(a,'Variable',header=TRUE)
a<-table.element(a,'Parameter',header=TRUE)
a<-table.element(a,'S.D.',header=TRUE)
a<-table.element(a,'T-STAT
H0: parameter = 0',header=TRUE)
a<-table.element(a,'2-tail p-value',header=TRUE)
a<-table.element(a,'1-tail p-value',header=TRUE)
a<-table.row.end(a)
for (i in 1:k){
a<-table.row.start(a)
a<-table.element(a,rownames(mysum$coefficients)[i],header=TRUE)
a<-table.element(a,formatC(signif(mysum$coefficients[i,1],5),format='g',flag='+'))
a<-table.element(a,formatC(signif(mysum$coefficients[i,2],5),format='g',flag=' '))
a<-table.element(a,formatC(signif(mysum$coefficients[i,3],4),format='e',flag='+'))
a<-table.element(a,formatC(signif(mysum$coefficients[i,4],4),format='g',flag=' '))
a<-table.element(a,formatC(signif(mysum$coefficients[i,4]/2,4),format='g',flag=' '))
a<-table.row.end(a)
}
a<-table.end(a)
table.save(a,file='mytable2.tab')
a<-table.start()
a<-table.row.start(a)
a<-table.element(a, 'Multiple Linear Regression - Regression Statistics', 2, TRUE)
a<-table.row.end(a)
a<-table.row.start(a)
a<-table.element(a, 'Multiple R',1,TRUE)
a<-table.element(a,formatC(signif(sqrt(mysum$r.squared),6),format='g',flag=' '))
a<-table.row.end(a)
a<-table.row.start(a)
a<-table.element(a, 'R-squared',1,TRUE)
a<-table.element(a,formatC(signif(mysum$r.squared,6),format='g',flag=' '))
a<-table.row.end(a)
a<-table.row.start(a)
a<-table.element(a, 'Adjusted R-squared',1,TRUE)
a<-table.element(a,formatC(signif(mysum$adj.r.squared,6),format='g',flag=' '))
a<-table.row.end(a)
a<-table.row.start(a)
a<-table.element(a, 'F-TEST (value)',1,TRUE)
a<-table.element(a,formatC(signif(mysum$fstatistic[1],6),format='g',flag=' '))
a<-table.row.end(a)
a<-table.row.start(a)
a<-table.element(a, 'F-TEST (DF numerator)',1,TRUE)
a<-table.element(a, signif(mysum$fstatistic[2],6))
a<-table.row.end(a)
a<-table.row.start(a)
a<-table.element(a, 'F-TEST (DF denominator)',1,TRUE)
a<-table.element(a, signif(mysum$fstatistic[3],6))
a<-table.row.end(a)
a<-table.row.start(a)
a<-table.element(a, 'p-value',1,TRUE)
a<-table.element(a,formatC(signif(1-pf(mysum$fstatistic[1],mysum$fstatistic[2],mysum$fstatistic[3]),6),format='g',flag=' '))
a<-table.row.end(a)
a<-table.row.start(a)
a<-table.element(a, 'Multiple Linear Regression - Residual Statistics', 2, TRUE)
a<-table.row.end(a)
a<-table.row.start(a)
a<-table.element(a, 'Residual Standard Deviation',1,TRUE)
a<-table.element(a,formatC(signif(mysum$sigma,6),format='g',flag=' '))
a<-table.row.end(a)
a<-table.row.start(a)
a<-table.element(a, 'Sum Squared Residuals',1,TRUE)
a<-table.element(a,formatC(signif(sum(myerror*myerror),6),format='g',flag=' '))
a<-table.row.end(a)
a<-table.end(a)
table.save(a,file='mytable3.tab')
if(n < 200) {
a<-table.start()
a<-table.row.start(a)
a<-table.element(a, 'Multiple Linear Regression - Actuals, Interpolation, and Residuals', 4, TRUE)
a<-table.row.end(a)
a<-table.row.start(a)
a<-table.element(a, 'Time or Index', 1, TRUE)
a<-table.element(a, 'Actuals', 1, TRUE)
a<-table.element(a, 'Interpolation
Forecast', 1, TRUE)
a<-table.element(a, 'Residuals
Prediction Error', 1, TRUE)
a<-table.row.end(a)
for (i in 1:n) {
a<-table.row.start(a)
a<-table.element(a,i, 1, TRUE)
a<-table.element(a,formatC(signif(x[i],6),format='g',flag=' '))
a<-table.element(a,formatC(signif(x[i]-mysum$resid[i],6),format='g',flag=' '))
a<-table.element(a,formatC(signif(mysum$resid[i],6),format='g',flag=' '))
a<-table.row.end(a)
}
a<-table.end(a)
table.save(a,file='mytable4.tab')
if (n > n25) {
a<-table.start()
a<-table.row.start(a)
a<-table.element(a,'Goldfeld-Quandt test for Heteroskedasticity',4,TRUE)
a<-table.row.end(a)
a<-table.row.start(a)
a<-table.element(a,'p-values',header=TRUE)
a<-table.element(a,'Alternative Hypothesis',3,header=TRUE)
a<-table.row.end(a)
a<-table.row.start(a)
a<-table.element(a,'breakpoint index',header=TRUE)
a<-table.element(a,'greater',header=TRUE)
a<-table.element(a,'2-sided',header=TRUE)
a<-table.element(a,'less',header=TRUE)
a<-table.row.end(a)
for (mypoint in kp3:nmkm3) {
a<-table.row.start(a)
a<-table.element(a,mypoint,header=TRUE)
a<-table.element(a,formatC(signif(gqarr[mypoint-kp3+1,1],6),format='g',flag=' '))
a<-table.element(a,formatC(signif(gqarr[mypoint-kp3+1,2],6),format='g',flag=' '))
a<-table.element(a,formatC(signif(gqarr[mypoint-kp3+1,3],6),format='g',flag=' '))
a<-table.row.end(a)
}
a<-table.end(a)
table.save(a,file='mytable5.tab')
a<-table.start()
a<-table.row.start(a)
a<-table.element(a,'Meta Analysis of Goldfeld-Quandt test for Heteroskedasticity',4,TRUE)
a<-table.row.end(a)
a<-table.row.start(a)
a<-table.element(a,'Description',header=TRUE)
a<-table.element(a,'# significant tests',header=TRUE)
a<-table.element(a,'% significant tests',header=TRUE)
a<-table.element(a,'OK/NOK',header=TRUE)
a<-table.row.end(a)
a<-table.row.start(a)
a<-table.element(a,'1% type I error level',header=TRUE)
a<-table.element(a,signif(numsignificant1,6))
a<-table.element(a,formatC(signif(numsignificant1/numgqtests,6),format='g',flag=' '))
if (numsignificant1/numgqtests < 0.01) dum <- 'OK' else dum <- 'NOK'
a<-table.element(a,dum)
a<-table.row.end(a)
a<-table.row.start(a)
a<-table.element(a,'5% type I error level',header=TRUE)
a<-table.element(a,signif(numsignificant5,6))
a<-table.element(a,signif(numsignificant5/numgqtests,6))
if (numsignificant5/numgqtests < 0.05) dum <- 'OK' else dum <- 'NOK'
a<-table.element(a,dum)
a<-table.row.end(a)
a<-table.row.start(a)
a<-table.element(a,'10% type I error level',header=TRUE)
a<-table.element(a,signif(numsignificant10,6))
a<-table.element(a,signif(numsignificant10/numgqtests,6))
if (numsignificant10/numgqtests < 0.1) dum <- 'OK' else dum <- 'NOK'
a<-table.element(a,dum)
a<-table.row.end(a)
a<-table.end(a)
table.save(a,file='mytable6.tab')
}
}