Free Statistics

of Irreproducible Research!

Author's title

Author*Unverified author*
R Software Modulerwasp_smp.wasp
Title produced by softwareStandard Deviation-Mean Plot
Date of computationFri, 25 Dec 2015 09:50:15 +0000
Cite this page as followsStatistical Computations at FreeStatistics.org, Office for Research Development and Education, URL https://freestatistics.org/blog/index.php?v=date/2015/Dec/25/t1451037198je7wr8jiz5itijz.htm/, Retrieved Thu, 16 May 2024 10:38:28 +0000
Statistical Computations at FreeStatistics.org, Office for Research Development and Education, URL https://freestatistics.org/blog/index.php?pk=287079, Retrieved Thu, 16 May 2024 10:38:28 +0000
QR Codes:

Original text written by user:
IsPrivate?No (this computation is public)
User-defined keywords
Estimated Impact145
Family? (F = Feedback message, R = changed R code, M = changed R Module, P = changed Parameters, D = changed Data)
-       [Standard Deviation-Mean Plot] [] [2015-12-25 09:50:15] [e7bd1b63287b3004f428c98394187272] [Current]
Feedback Forum

Post a new message
Dataseries X:
62239,3
64816,6
62625,3
67923
64363,7
67342
64411,2
69174,5
66290,2
69336,8
66712,2
72225,9
68229,5
71096,3
68407,9
74522,4
71798,4
75074,3
72694,6
78789,4
74814,5
78303,2
75431,6
82600,7
78830,5
82168,1
79493,2
86876,6
83478,5
87003,2
83672,7
90914,2
86448
90577,7
86621,1
91418,5
84275,4
87677,9
85149,6
92600
87111,3
92293,9
89060
97281,6
91812
95980,4
92043,7
100079,2
94384,8
97900,5
93630,8
102255,2
95251,8
100001,8
95689,8
104298
97435,1
101220,2
97537
105834,9


Summary of computational transaction
Raw Inputview raw input (R code)
Raw Outputview raw output of R engine
Computing time1 seconds
R Server'George Udny Yule' @ yule.wessa.net

\begin{tabular}{lllllllll}
\hline
Summary of computational transaction \tabularnewline
Raw Input & view raw input (R code)  \tabularnewline
Raw Output & view raw output of R engine  \tabularnewline
Computing time & 1 seconds \tabularnewline
R Server & 'George Udny Yule' @ yule.wessa.net \tabularnewline
\hline
\end{tabular}
%Source: https://freestatistics.org/blog/index.php?pk=287079&T=0

[TABLE]
[ROW][C]Summary of computational transaction[/C][/ROW]
[ROW][C]Raw Input[/C][C]view raw input (R code) [/C][/ROW]
[ROW][C]Raw Output[/C][C]view raw output of R engine [/C][/ROW]
[ROW][C]Computing time[/C][C]1 seconds[/C][/ROW]
[ROW][C]R Server[/C][C]'George Udny Yule' @ yule.wessa.net[/C][/ROW]
[/TABLE]
Source: https://freestatistics.org/blog/index.php?pk=287079&T=0

Globally Unique Identifier (entire table): ba.freestatistics.org/blog/index.php?pk=287079&T=0

As an alternative you can also use a QR Code:  

The GUIDs for individual cells are displayed in the table below:

Summary of computational transaction
Raw Inputview raw input (R code)
Raw Outputview raw output of R engine
Computing time1 seconds
R Server'George Udny Yule' @ yule.wessa.net


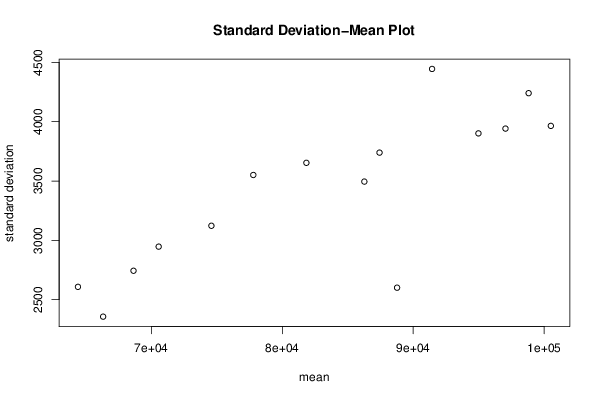
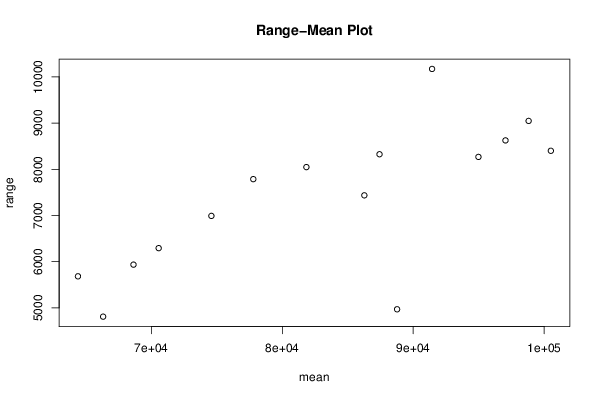
Standard Deviation-Mean Plot
SectionMeanStandard DeviationRange
164401.052607.889614867425683.7
266322.852356.780918258354810.8
368641.2752743.609266853915935.7
470564.0252946.802295568316292.89999999999
574589.1753122.769916142826991
677787.53550.672919321077786.2
781842.13653.287652694958046.10000000001
886267.153494.976534494427435.7
988766.3252600.751989169034970.5
1087425.7253739.073264304058324.60000000001
1191436.74444.3010661595210170.3
1294978.8253901.312470075518267.2
1397042.8253941.720058024588624.39999999999
1498810.354240.085141833839046.2
15100506.83964.536210790198399.79999999999

\begin{tabular}{lllllllll}
\hline
Standard Deviation-Mean Plot \tabularnewline
Section & Mean & Standard Deviation & Range \tabularnewline
1 & 64401.05 & 2607.88961486742 & 5683.7 \tabularnewline
2 & 66322.85 & 2356.78091825835 & 4810.8 \tabularnewline
3 & 68641.275 & 2743.60926685391 & 5935.7 \tabularnewline
4 & 70564.025 & 2946.80229556831 & 6292.89999999999 \tabularnewline
5 & 74589.175 & 3122.76991614282 & 6991 \tabularnewline
6 & 77787.5 & 3550.67291932107 & 7786.2 \tabularnewline
7 & 81842.1 & 3653.28765269495 & 8046.10000000001 \tabularnewline
8 & 86267.15 & 3494.97653449442 & 7435.7 \tabularnewline
9 & 88766.325 & 2600.75198916903 & 4970.5 \tabularnewline
10 & 87425.725 & 3739.07326430405 & 8324.60000000001 \tabularnewline
11 & 91436.7 & 4444.30106615952 & 10170.3 \tabularnewline
12 & 94978.825 & 3901.31247007551 & 8267.2 \tabularnewline
13 & 97042.825 & 3941.72005802458 & 8624.39999999999 \tabularnewline
14 & 98810.35 & 4240.08514183383 & 9046.2 \tabularnewline
15 & 100506.8 & 3964.53621079019 & 8399.79999999999 \tabularnewline
\hline
\end{tabular}
%Source: https://freestatistics.org/blog/index.php?pk=287079&T=1

[TABLE]
[ROW][C]Standard Deviation-Mean Plot[/C][/ROW]
[ROW][C]Section[/C][C]Mean[/C][C]Standard Deviation[/C][C]Range[/C][/ROW]
[ROW][C]1[/C][C]64401.05[/C][C]2607.88961486742[/C][C]5683.7[/C][/ROW]
[ROW][C]2[/C][C]66322.85[/C][C]2356.78091825835[/C][C]4810.8[/C][/ROW]
[ROW][C]3[/C][C]68641.275[/C][C]2743.60926685391[/C][C]5935.7[/C][/ROW]
[ROW][C]4[/C][C]70564.025[/C][C]2946.80229556831[/C][C]6292.89999999999[/C][/ROW]
[ROW][C]5[/C][C]74589.175[/C][C]3122.76991614282[/C][C]6991[/C][/ROW]
[ROW][C]6[/C][C]77787.5[/C][C]3550.67291932107[/C][C]7786.2[/C][/ROW]
[ROW][C]7[/C][C]81842.1[/C][C]3653.28765269495[/C][C]8046.10000000001[/C][/ROW]
[ROW][C]8[/C][C]86267.15[/C][C]3494.97653449442[/C][C]7435.7[/C][/ROW]
[ROW][C]9[/C][C]88766.325[/C][C]2600.75198916903[/C][C]4970.5[/C][/ROW]
[ROW][C]10[/C][C]87425.725[/C][C]3739.07326430405[/C][C]8324.60000000001[/C][/ROW]
[ROW][C]11[/C][C]91436.7[/C][C]4444.30106615952[/C][C]10170.3[/C][/ROW]
[ROW][C]12[/C][C]94978.825[/C][C]3901.31247007551[/C][C]8267.2[/C][/ROW]
[ROW][C]13[/C][C]97042.825[/C][C]3941.72005802458[/C][C]8624.39999999999[/C][/ROW]
[ROW][C]14[/C][C]98810.35[/C][C]4240.08514183383[/C][C]9046.2[/C][/ROW]
[ROW][C]15[/C][C]100506.8[/C][C]3964.53621079019[/C][C]8399.79999999999[/C][/ROW]
[/TABLE]
Source: https://freestatistics.org/blog/index.php?pk=287079&T=1

Globally Unique Identifier (entire table): ba.freestatistics.org/blog/index.php?pk=287079&T=1

As an alternative you can also use a QR Code:  

The GUIDs for individual cells are displayed in the table below:

Standard Deviation-Mean Plot
SectionMeanStandard DeviationRange
164401.052607.889614867425683.7
266322.852356.780918258354810.8
368641.2752743.609266853915935.7
470564.0252946.802295568316292.89999999999
574589.1753122.769916142826991
677787.53550.672919321077786.2
781842.13653.287652694958046.10000000001
886267.153494.976534494427435.7
988766.3252600.751989169034970.5
1087425.7253739.073264304058324.60000000001
1191436.74444.3010661595210170.3
1294978.8253901.312470075518267.2
1397042.8253941.720058024588624.39999999999
1498810.354240.085141833839046.2
15100506.83964.536210790198399.79999999999


Regression: S.E.(k) = alpha + beta * Mean(k)
alpha-169.383351475298
beta0.0431007414047001
S.D.0.00853695101260972
T-STAT5.0487277414427
p-value0.000222947791597821

\begin{tabular}{lllllllll}
\hline
Regression: S.E.(k) = alpha + beta * Mean(k) \tabularnewline
alpha & -169.383351475298 \tabularnewline
beta & 0.0431007414047001 \tabularnewline
S.D. & 0.00853695101260972 \tabularnewline
T-STAT & 5.0487277414427 \tabularnewline
p-value & 0.000222947791597821 \tabularnewline
\hline
\end{tabular}
%Source: https://freestatistics.org/blog/index.php?pk=287079&T=2

[TABLE]
[ROW][C]Regression: S.E.(k) = alpha + beta * Mean(k)[/C][/ROW]
[ROW][C]alpha[/C][C]-169.383351475298[/C][/ROW]
[ROW][C]beta[/C][C]0.0431007414047001[/C][/ROW]
[ROW][C]S.D.[/C][C]0.00853695101260972[/C][/ROW]
[ROW][C]T-STAT[/C][C]5.0487277414427[/C][/ROW]
[ROW][C]p-value[/C][C]0.000222947791597821[/C][/ROW]
[/TABLE]
Source: https://freestatistics.org/blog/index.php?pk=287079&T=2

Globally Unique Identifier (entire table): ba.freestatistics.org/blog/index.php?pk=287079&T=2

As an alternative you can also use a QR Code:  

The GUIDs for individual cells are displayed in the table below:

Regression: S.E.(k) = alpha + beta * Mean(k)
alpha-169.383351475298
beta0.0431007414047001
S.D.0.00853695101260972
T-STAT5.0487277414427
p-value0.000222947791597821


Regression: ln S.E.(k) = alpha + beta * ln Mean(k)
alpha-3.94527425215613
beta1.06584996094208
S.D.0.211690867224403
T-STAT5.03493596543408
p-value0.000228429616624577
Lambda-0.0658499609420764

\begin{tabular}{lllllllll}
\hline
Regression: ln S.E.(k) = alpha + beta * ln Mean(k) \tabularnewline
alpha & -3.94527425215613 \tabularnewline
beta & 1.06584996094208 \tabularnewline
S.D. & 0.211690867224403 \tabularnewline
T-STAT & 5.03493596543408 \tabularnewline
p-value & 0.000228429616624577 \tabularnewline
Lambda & -0.0658499609420764 \tabularnewline
\hline
\end{tabular}
%Source: https://freestatistics.org/blog/index.php?pk=287079&T=3

[TABLE]
[ROW][C]Regression: ln S.E.(k) = alpha + beta * ln Mean(k)[/C][/ROW]
[ROW][C]alpha[/C][C]-3.94527425215613[/C][/ROW]
[ROW][C]beta[/C][C]1.06584996094208[/C][/ROW]
[ROW][C]S.D.[/C][C]0.211690867224403[/C][/ROW]
[ROW][C]T-STAT[/C][C]5.03493596543408[/C][/ROW]
[ROW][C]p-value[/C][C]0.000228429616624577[/C][/ROW]
[ROW][C]Lambda[/C][C]-0.0658499609420764[/C][/ROW]
[/TABLE]
Source: https://freestatistics.org/blog/index.php?pk=287079&T=3

Globally Unique Identifier (entire table): ba.freestatistics.org/blog/index.php?pk=287079&T=3

As an alternative you can also use a QR Code:  

The GUIDs for individual cells are displayed in the table below:

Regression: ln S.E.(k) = alpha + beta * ln Mean(k)
alpha-3.94527425215613
beta1.06584996094208
S.D.0.211690867224403
T-STAT5.03493596543408
p-value0.000228429616624577
Lambda-0.0658499609420764


Parameters (Session):
par1 = 4 ;
Parameters (R input):
par1 = 4 ;
R code (references can be found in the software module):
par1 <- as.numeric(par1)
(n <- length(x))
(np <- floor(n / par1))
arr <- array(NA,dim=c(par1,np))
j <- 0
k <- 1
for (i in 1:(np*par1))
{
j = j + 1
arr[j,k] <- x[i]
if (j == par1) {
j = 0
k=k+1
}
}
arr
arr.mean <- array(NA,dim=np)
arr.sd <- array(NA,dim=np)
arr.range <- array(NA,dim=np)
for (j in 1:np)
{
arr.mean[j] <- mean(arr[,j],na.rm=TRUE)
arr.sd[j] <- sd(arr[,j],na.rm=TRUE)
arr.range[j] <- max(arr[,j],na.rm=TRUE) - min(arr[,j],na.rm=TRUE)
}
arr.mean
arr.sd
arr.range
(lm1 <- lm(arr.sd~arr.mean))
(lnlm1 <- lm(log(arr.sd)~log(arr.mean)))
(lm2 <- lm(arr.range~arr.mean))
bitmap(file='test1.png')
plot(arr.mean,arr.sd,main='Standard Deviation-Mean Plot',xlab='mean',ylab='standard deviation')
dev.off()
bitmap(file='test2.png')
plot(arr.mean,arr.range,main='Range-Mean Plot',xlab='mean',ylab='range')
dev.off()
load(file='createtable')
a<-table.start()
a<-table.row.start(a)
a<-table.element(a,'Standard Deviation-Mean Plot',4,TRUE)
a<-table.row.end(a)
a<-table.row.start(a)
a<-table.element(a,'Section',header=TRUE)
a<-table.element(a,'Mean',header=TRUE)
a<-table.element(a,'Standard Deviation',header=TRUE)
a<-table.element(a,'Range',header=TRUE)
a<-table.row.end(a)
for (j in 1:np) {
a<-table.row.start(a)
a<-table.element(a,j,header=TRUE)
a<-table.element(a,arr.mean[j])
a<-table.element(a,arr.sd[j] )
a<-table.element(a,arr.range[j] )
a<-table.row.end(a)
}
a<-table.end(a)
table.save(a,file='mytable.tab')
a<-table.start()
a<-table.row.start(a)
a<-table.element(a,'Regression: S.E.(k) = alpha + beta * Mean(k)',2,TRUE)
a<-table.row.end(a)
a<-table.row.start(a)
a<-table.element(a,'alpha',header=TRUE)
a<-table.element(a,lm1$coefficients[[1]])
a<-table.row.end(a)
a<-table.row.start(a)
a<-table.element(a,'beta',header=TRUE)
a<-table.element(a,lm1$coefficients[[2]])
a<-table.row.end(a)
a<-table.row.start(a)
a<-table.element(a,'S.D.',header=TRUE)
a<-table.element(a,summary(lm1)$coefficients[2,2])
a<-table.row.end(a)
a<-table.row.start(a)
a<-table.element(a,'T-STAT',header=TRUE)
a<-table.element(a,summary(lm1)$coefficients[2,3])
a<-table.row.end(a)
a<-table.row.start(a)
a<-table.element(a,'p-value',header=TRUE)
a<-table.element(a,summary(lm1)$coefficients[2,4])
a<-table.row.end(a)
a<-table.end(a)
table.save(a,file='mytable1.tab')
a<-table.start()
a<-table.row.start(a)
a<-table.element(a,'Regression: ln S.E.(k) = alpha + beta * ln Mean(k)',2,TRUE)
a<-table.row.end(a)
a<-table.row.start(a)
a<-table.element(a,'alpha',header=TRUE)
a<-table.element(a,lnlm1$coefficients[[1]])
a<-table.row.end(a)
a<-table.row.start(a)
a<-table.element(a,'beta',header=TRUE)
a<-table.element(a,lnlm1$coefficients[[2]])
a<-table.row.end(a)
a<-table.row.start(a)
a<-table.element(a,'S.D.',header=TRUE)
a<-table.element(a,summary(lnlm1)$coefficients[2,2])
a<-table.row.end(a)
a<-table.row.start(a)
a<-table.element(a,'T-STAT',header=TRUE)
a<-table.element(a,summary(lnlm1)$coefficients[2,3])
a<-table.row.end(a)
a<-table.row.start(a)
a<-table.element(a,'p-value',header=TRUE)
a<-table.element(a,summary(lnlm1)$coefficients[2,4])
a<-table.row.end(a)
a<-table.row.start(a)
a<-table.element(a,'Lambda',header=TRUE)
a<-table.element(a,1-lnlm1$coefficients[[2]])
a<-table.row.end(a)
a<-table.end(a)
table.save(a,file='mytable2.tab')