Free Statistics

of Irreproducible Research!

Author's title

Author*Unverified author*
R Software Modulerwasp_autocorrelation.wasp
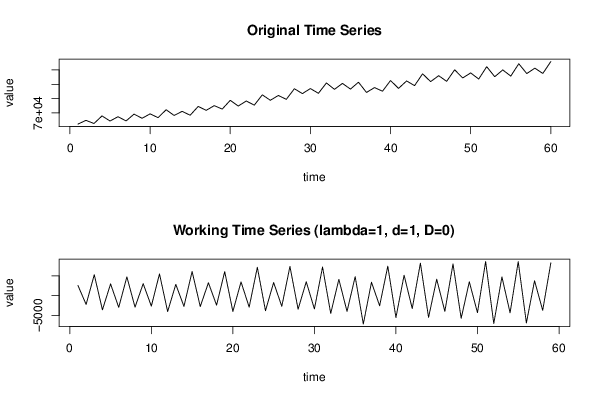
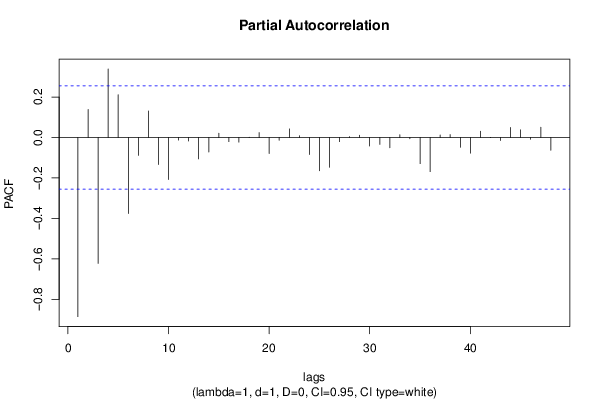
Title produced by software(Partial) Autocorrelation Function
Date of computationFri, 25 Dec 2015 10:11:18 +0000
Cite this page as followsStatistical Computations at FreeStatistics.org, Office for Research Development and Education, URL https://freestatistics.org/blog/index.php?v=date/2015/Dec/25/t1451038474ceyxxly25za1ahh.htm/, Retrieved Fri, 17 May 2024 00:07:43 +0000
Statistical Computations at FreeStatistics.org, Office for Research Development and Education, URL https://freestatistics.org/blog/index.php?pk=287082, Retrieved Fri, 17 May 2024 00:07:43 +0000
QR Codes:

Original text written by user:
IsPrivate?No (this computation is public)
User-defined keywords
Estimated Impact152
Family? (F = Feedback message, R = changed R code, M = changed R Module, P = changed Parameters, D = changed Data)
-       [(Partial) Autocorrelation Function] [] [2015-12-25 10:11:18] [e7bd1b63287b3004f428c98394187272] [Current]
Feedback Forum

Post a new message
Dataseries X:
62239.3
64816.6
62625.3
67923
64363.7
67342
64411.2
69174.5
66290.2
69336.8
66712.2
72225.9
68229.5
71096.3
68407.9
74522.4
71798.4
75074.3
72694.6
78789.4
74814.5
78303.2
75431.6
82600.7
78830.5
82168.1
79493.2
86876.6
83478.5
87003.2
83672.7
90914.2
86448
90577.7
86621.1
91418.5
84275.4
87677.9
85149.6
92600
87111.3
92293.9
89060
97281.6
91812
95980.4
92043.7
100079.2
94384.8
97900.5
93630.8
102255.2
95251.8
100001.8
95689.8
104298
97435.1
101220.2
97537
105834.9


Summary of computational transaction
Raw Inputview raw input (R code)
Raw Outputview raw output of R engine
Computing time1 seconds
R Server'Sir Ronald Aylmer Fisher' @ fisher.wessa.net

\begin{tabular}{lllllllll}
\hline
Summary of computational transaction \tabularnewline
Raw Input & view raw input (R code)  \tabularnewline
Raw Output & view raw output of R engine  \tabularnewline
Computing time & 1 seconds \tabularnewline
R Server & 'Sir Ronald Aylmer Fisher' @ fisher.wessa.net \tabularnewline
\hline
\end{tabular}
%Source: https://freestatistics.org/blog/index.php?pk=287082&T=0

[TABLE]
[ROW][C]Summary of computational transaction[/C][/ROW]
[ROW][C]Raw Input[/C][C]view raw input (R code) [/C][/ROW]
[ROW][C]Raw Output[/C][C]view raw output of R engine [/C][/ROW]
[ROW][C]Computing time[/C][C]1 seconds[/C][/ROW]
[ROW][C]R Server[/C][C]'Sir Ronald Aylmer Fisher' @ fisher.wessa.net[/C][/ROW]
[/TABLE]
Source: https://freestatistics.org/blog/index.php?pk=287082&T=0

Globally Unique Identifier (entire table): ba.freestatistics.org/blog/index.php?pk=287082&T=0

As an alternative you can also use a QR Code:  

The GUIDs for individual cells are displayed in the table below:

Summary of computational transaction
Raw Inputview raw input (R code)
Raw Outputview raw output of R engine
Computing time1 seconds
R Server'Sir Ronald Aylmer Fisher' @ fisher.wessa.net


Autocorrelation Function
Time lag kACF(k)T-STATP-value
1-0.88592-6.80490
20.8146416.25740
3-0.875807-6.72720
40.9140637.02110
5-0.827378-6.35520
60.748445.74890
7-0.803699-6.17330
80.8347766.4120
9-0.760452-5.84110
100.685115.26241e-06
11-0.732908-5.62960
120.7639165.86780
13-0.692446-5.31881e-06
140.6275694.82055e-06
15-0.662884-5.09172e-06
160.6962725.34821e-06
17-0.626598-4.8135e-06
180.5691764.37192.5e-05
19-0.597719-4.59121.2e-05
200.6216774.77526e-06
21-0.561447-4.31263.1e-05
220.5092233.91140.00012
23-0.530902-4.07796.9e-05
240.5456474.19124.7e-05
25-0.510313-3.91980.000117
260.4483693.4440.00053
27-0.461626-3.54580.000387
280.4899583.76340.000194
29-0.445446-3.42150.000568
300.3907793.00160.001966
31-0.399887-3.07160.001609
320.4256073.26920.000901
33-0.381814-2.93280.002388
340.3329372.55730.006569
35-0.346484-2.66140.005005
360.3583312.75240.003924
37-0.318865-2.44920.008652
380.2810122.15850.017484
39-0.285968-2.19660.015997
400.2912772.23730.014527
41-0.256841-1.97280.026603
420.2246761.72580.044812
43-0.223859-1.71950.045384
440.2313691.77720.040347
45-0.198757-1.52670.066092
460.1712081.31510.096787
47-0.171222-1.31520.096769
480.1651791.26880.104754

\begin{tabular}{lllllllll}
\hline
Autocorrelation Function \tabularnewline
Time lag k & ACF(k) & T-STAT & P-value \tabularnewline
1 & -0.88592 & -6.8049 & 0 \tabularnewline
2 & 0.814641 & 6.2574 & 0 \tabularnewline
3 & -0.875807 & -6.7272 & 0 \tabularnewline
4 & 0.914063 & 7.0211 & 0 \tabularnewline
5 & -0.827378 & -6.3552 & 0 \tabularnewline
6 & 0.74844 & 5.7489 & 0 \tabularnewline
7 & -0.803699 & -6.1733 & 0 \tabularnewline
8 & 0.834776 & 6.412 & 0 \tabularnewline
9 & -0.760452 & -5.8411 & 0 \tabularnewline
10 & 0.68511 & 5.2624 & 1e-06 \tabularnewline
11 & -0.732908 & -5.6296 & 0 \tabularnewline
12 & 0.763916 & 5.8678 & 0 \tabularnewline
13 & -0.692446 & -5.3188 & 1e-06 \tabularnewline
14 & 0.627569 & 4.8205 & 5e-06 \tabularnewline
15 & -0.662884 & -5.0917 & 2e-06 \tabularnewline
16 & 0.696272 & 5.3482 & 1e-06 \tabularnewline
17 & -0.626598 & -4.813 & 5e-06 \tabularnewline
18 & 0.569176 & 4.3719 & 2.5e-05 \tabularnewline
19 & -0.597719 & -4.5912 & 1.2e-05 \tabularnewline
20 & 0.621677 & 4.7752 & 6e-06 \tabularnewline
21 & -0.561447 & -4.3126 & 3.1e-05 \tabularnewline
22 & 0.509223 & 3.9114 & 0.00012 \tabularnewline
23 & -0.530902 & -4.0779 & 6.9e-05 \tabularnewline
24 & 0.545647 & 4.1912 & 4.7e-05 \tabularnewline
25 & -0.510313 & -3.9198 & 0.000117 \tabularnewline
26 & 0.448369 & 3.444 & 0.00053 \tabularnewline
27 & -0.461626 & -3.5458 & 0.000387 \tabularnewline
28 & 0.489958 & 3.7634 & 0.000194 \tabularnewline
29 & -0.445446 & -3.4215 & 0.000568 \tabularnewline
30 & 0.390779 & 3.0016 & 0.001966 \tabularnewline
31 & -0.399887 & -3.0716 & 0.001609 \tabularnewline
32 & 0.425607 & 3.2692 & 0.000901 \tabularnewline
33 & -0.381814 & -2.9328 & 0.002388 \tabularnewline
34 & 0.332937 & 2.5573 & 0.006569 \tabularnewline
35 & -0.346484 & -2.6614 & 0.005005 \tabularnewline
36 & 0.358331 & 2.7524 & 0.003924 \tabularnewline
37 & -0.318865 & -2.4492 & 0.008652 \tabularnewline
38 & 0.281012 & 2.1585 & 0.017484 \tabularnewline
39 & -0.285968 & -2.1966 & 0.015997 \tabularnewline
40 & 0.291277 & 2.2373 & 0.014527 \tabularnewline
41 & -0.256841 & -1.9728 & 0.026603 \tabularnewline
42 & 0.224676 & 1.7258 & 0.044812 \tabularnewline
43 & -0.223859 & -1.7195 & 0.045384 \tabularnewline
44 & 0.231369 & 1.7772 & 0.040347 \tabularnewline
45 & -0.198757 & -1.5267 & 0.066092 \tabularnewline
46 & 0.171208 & 1.3151 & 0.096787 \tabularnewline
47 & -0.171222 & -1.3152 & 0.096769 \tabularnewline
48 & 0.165179 & 1.2688 & 0.104754 \tabularnewline
\hline
\end{tabular}
%Source: https://freestatistics.org/blog/index.php?pk=287082&T=1

[TABLE]
[ROW][C]Autocorrelation Function[/C][/ROW]
[ROW][C]Time lag k[/C][C]ACF(k)[/C][C]T-STAT[/C][C]P-value[/C][/ROW]
[ROW][C]1[/C][C]-0.88592[/C][C]-6.8049[/C][C]0[/C][/ROW]
[ROW][C]2[/C][C]0.814641[/C][C]6.2574[/C][C]0[/C][/ROW]
[ROW][C]3[/C][C]-0.875807[/C][C]-6.7272[/C][C]0[/C][/ROW]
[ROW][C]4[/C][C]0.914063[/C][C]7.0211[/C][C]0[/C][/ROW]
[ROW][C]5[/C][C]-0.827378[/C][C]-6.3552[/C][C]0[/C][/ROW]
[ROW][C]6[/C][C]0.74844[/C][C]5.7489[/C][C]0[/C][/ROW]
[ROW][C]7[/C][C]-0.803699[/C][C]-6.1733[/C][C]0[/C][/ROW]
[ROW][C]8[/C][C]0.834776[/C][C]6.412[/C][C]0[/C][/ROW]
[ROW][C]9[/C][C]-0.760452[/C][C]-5.8411[/C][C]0[/C][/ROW]
[ROW][C]10[/C][C]0.68511[/C][C]5.2624[/C][C]1e-06[/C][/ROW]
[ROW][C]11[/C][C]-0.732908[/C][C]-5.6296[/C][C]0[/C][/ROW]
[ROW][C]12[/C][C]0.763916[/C][C]5.8678[/C][C]0[/C][/ROW]
[ROW][C]13[/C][C]-0.692446[/C][C]-5.3188[/C][C]1e-06[/C][/ROW]
[ROW][C]14[/C][C]0.627569[/C][C]4.8205[/C][C]5e-06[/C][/ROW]
[ROW][C]15[/C][C]-0.662884[/C][C]-5.0917[/C][C]2e-06[/C][/ROW]
[ROW][C]16[/C][C]0.696272[/C][C]5.3482[/C][C]1e-06[/C][/ROW]
[ROW][C]17[/C][C]-0.626598[/C][C]-4.813[/C][C]5e-06[/C][/ROW]
[ROW][C]18[/C][C]0.569176[/C][C]4.3719[/C][C]2.5e-05[/C][/ROW]
[ROW][C]19[/C][C]-0.597719[/C][C]-4.5912[/C][C]1.2e-05[/C][/ROW]
[ROW][C]20[/C][C]0.621677[/C][C]4.7752[/C][C]6e-06[/C][/ROW]
[ROW][C]21[/C][C]-0.561447[/C][C]-4.3126[/C][C]3.1e-05[/C][/ROW]
[ROW][C]22[/C][C]0.509223[/C][C]3.9114[/C][C]0.00012[/C][/ROW]
[ROW][C]23[/C][C]-0.530902[/C][C]-4.0779[/C][C]6.9e-05[/C][/ROW]
[ROW][C]24[/C][C]0.545647[/C][C]4.1912[/C][C]4.7e-05[/C][/ROW]
[ROW][C]25[/C][C]-0.510313[/C][C]-3.9198[/C][C]0.000117[/C][/ROW]
[ROW][C]26[/C][C]0.448369[/C][C]3.444[/C][C]0.00053[/C][/ROW]
[ROW][C]27[/C][C]-0.461626[/C][C]-3.5458[/C][C]0.000387[/C][/ROW]
[ROW][C]28[/C][C]0.489958[/C][C]3.7634[/C][C]0.000194[/C][/ROW]
[ROW][C]29[/C][C]-0.445446[/C][C]-3.4215[/C][C]0.000568[/C][/ROW]
[ROW][C]30[/C][C]0.390779[/C][C]3.0016[/C][C]0.001966[/C][/ROW]
[ROW][C]31[/C][C]-0.399887[/C][C]-3.0716[/C][C]0.001609[/C][/ROW]
[ROW][C]32[/C][C]0.425607[/C][C]3.2692[/C][C]0.000901[/C][/ROW]
[ROW][C]33[/C][C]-0.381814[/C][C]-2.9328[/C][C]0.002388[/C][/ROW]
[ROW][C]34[/C][C]0.332937[/C][C]2.5573[/C][C]0.006569[/C][/ROW]
[ROW][C]35[/C][C]-0.346484[/C][C]-2.6614[/C][C]0.005005[/C][/ROW]
[ROW][C]36[/C][C]0.358331[/C][C]2.7524[/C][C]0.003924[/C][/ROW]
[ROW][C]37[/C][C]-0.318865[/C][C]-2.4492[/C][C]0.008652[/C][/ROW]
[ROW][C]38[/C][C]0.281012[/C][C]2.1585[/C][C]0.017484[/C][/ROW]
[ROW][C]39[/C][C]-0.285968[/C][C]-2.1966[/C][C]0.015997[/C][/ROW]
[ROW][C]40[/C][C]0.291277[/C][C]2.2373[/C][C]0.014527[/C][/ROW]
[ROW][C]41[/C][C]-0.256841[/C][C]-1.9728[/C][C]0.026603[/C][/ROW]
[ROW][C]42[/C][C]0.224676[/C][C]1.7258[/C][C]0.044812[/C][/ROW]
[ROW][C]43[/C][C]-0.223859[/C][C]-1.7195[/C][C]0.045384[/C][/ROW]
[ROW][C]44[/C][C]0.231369[/C][C]1.7772[/C][C]0.040347[/C][/ROW]
[ROW][C]45[/C][C]-0.198757[/C][C]-1.5267[/C][C]0.066092[/C][/ROW]
[ROW][C]46[/C][C]0.171208[/C][C]1.3151[/C][C]0.096787[/C][/ROW]
[ROW][C]47[/C][C]-0.171222[/C][C]-1.3152[/C][C]0.096769[/C][/ROW]
[ROW][C]48[/C][C]0.165179[/C][C]1.2688[/C][C]0.104754[/C][/ROW]
[/TABLE]
Source: https://freestatistics.org/blog/index.php?pk=287082&T=1

Globally Unique Identifier (entire table): ba.freestatistics.org/blog/index.php?pk=287082&T=1

As an alternative you can also use a QR Code:  

The GUIDs for individual cells are displayed in the table below:

Autocorrelation Function
Time lag kACF(k)T-STATP-value
1-0.88592-6.80490
20.8146416.25740
3-0.875807-6.72720
40.9140637.02110
5-0.827378-6.35520
60.748445.74890
7-0.803699-6.17330
80.8347766.4120
9-0.760452-5.84110
100.685115.26241e-06
11-0.732908-5.62960
120.7639165.86780
13-0.692446-5.31881e-06
140.6275694.82055e-06
15-0.662884-5.09172e-06
160.6962725.34821e-06
17-0.626598-4.8135e-06
180.5691764.37192.5e-05
19-0.597719-4.59121.2e-05
200.6216774.77526e-06
21-0.561447-4.31263.1e-05
220.5092233.91140.00012
23-0.530902-4.07796.9e-05
240.5456474.19124.7e-05
25-0.510313-3.91980.000117
260.4483693.4440.00053
27-0.461626-3.54580.000387
280.4899583.76340.000194
29-0.445446-3.42150.000568
300.3907793.00160.001966
31-0.399887-3.07160.001609
320.4256073.26920.000901
33-0.381814-2.93280.002388
340.3329372.55730.006569
35-0.346484-2.66140.005005
360.3583312.75240.003924
37-0.318865-2.44920.008652
380.2810122.15850.017484
39-0.285968-2.19660.015997
400.2912772.23730.014527
41-0.256841-1.97280.026603
420.2246761.72580.044812
43-0.223859-1.71950.045384
440.2313691.77720.040347
45-0.198757-1.52670.066092
460.1712081.31510.096787
47-0.171222-1.31520.096769
480.1651791.26880.104754


Partial Autocorrelation Function
Time lag kPACF(k)T-STATP-value
1-0.88592-6.80490
20.1384521.06350.14595
3-0.622513-4.78166e-06
40.3393622.60670.005779
50.2115491.62490.054753
6-0.375933-2.88760.002709
7-0.088196-0.67740.250386
80.1314341.00960.158414
9-0.133111-1.02240.155373
10-0.207588-1.59450.058082
11-0.0126-0.09680.461613
12-0.017281-0.13270.447426
13-0.105707-0.8120.210041
14-0.071219-0.5470.293206
150.021310.16370.435269
16-0.020333-0.15620.438213
17-0.022635-0.17390.431284
180.0018790.01440.494267
190.0245430.18850.42556
20-0.078743-0.60480.273805
21-0.013442-0.10320.459059
220.0428090.32880.371727
230.008970.06890.472652
24-0.083919-0.64460.260844
25-0.164195-1.26120.1061
26-0.147012-1.12920.131687
27-0.020122-0.15460.438847
280.0046990.03610.485665
290.0115250.08850.464879
30-0.041436-0.31830.3757
31-0.033904-0.26040.397724
32-0.050893-0.39090.348633
330.0135570.10410.458708
34-0.00637-0.04890.480571
35-0.129196-0.99240.162534
36-0.168547-1.29460.100246
370.0124220.09540.462154
380.0144710.11120.455936
39-0.04788-0.36780.35718
40-0.077213-0.59310.277695
410.0315230.24210.404758
42-0.000775-0.0060.497634
43-0.014726-0.11310.455161
440.0498140.38260.351685
450.0381620.29310.385226
46-0.008827-0.06780.473087
470.0511040.39250.348038
48-0.062452-0.47970.316605

\begin{tabular}{lllllllll}
\hline
Partial Autocorrelation Function \tabularnewline
Time lag k & PACF(k) & T-STAT & P-value \tabularnewline
1 & -0.88592 & -6.8049 & 0 \tabularnewline
2 & 0.138452 & 1.0635 & 0.14595 \tabularnewline
3 & -0.622513 & -4.7816 & 6e-06 \tabularnewline
4 & 0.339362 & 2.6067 & 0.005779 \tabularnewline
5 & 0.211549 & 1.6249 & 0.054753 \tabularnewline
6 & -0.375933 & -2.8876 & 0.002709 \tabularnewline
7 & -0.088196 & -0.6774 & 0.250386 \tabularnewline
8 & 0.131434 & 1.0096 & 0.158414 \tabularnewline
9 & -0.133111 & -1.0224 & 0.155373 \tabularnewline
10 & -0.207588 & -1.5945 & 0.058082 \tabularnewline
11 & -0.0126 & -0.0968 & 0.461613 \tabularnewline
12 & -0.017281 & -0.1327 & 0.447426 \tabularnewline
13 & -0.105707 & -0.812 & 0.210041 \tabularnewline
14 & -0.071219 & -0.547 & 0.293206 \tabularnewline
15 & 0.02131 & 0.1637 & 0.435269 \tabularnewline
16 & -0.020333 & -0.1562 & 0.438213 \tabularnewline
17 & -0.022635 & -0.1739 & 0.431284 \tabularnewline
18 & 0.001879 & 0.0144 & 0.494267 \tabularnewline
19 & 0.024543 & 0.1885 & 0.42556 \tabularnewline
20 & -0.078743 & -0.6048 & 0.273805 \tabularnewline
21 & -0.013442 & -0.1032 & 0.459059 \tabularnewline
22 & 0.042809 & 0.3288 & 0.371727 \tabularnewline
23 & 0.00897 & 0.0689 & 0.472652 \tabularnewline
24 & -0.083919 & -0.6446 & 0.260844 \tabularnewline
25 & -0.164195 & -1.2612 & 0.1061 \tabularnewline
26 & -0.147012 & -1.1292 & 0.131687 \tabularnewline
27 & -0.020122 & -0.1546 & 0.438847 \tabularnewline
28 & 0.004699 & 0.0361 & 0.485665 \tabularnewline
29 & 0.011525 & 0.0885 & 0.464879 \tabularnewline
30 & -0.041436 & -0.3183 & 0.3757 \tabularnewline
31 & -0.033904 & -0.2604 & 0.397724 \tabularnewline
32 & -0.050893 & -0.3909 & 0.348633 \tabularnewline
33 & 0.013557 & 0.1041 & 0.458708 \tabularnewline
34 & -0.00637 & -0.0489 & 0.480571 \tabularnewline
35 & -0.129196 & -0.9924 & 0.162534 \tabularnewline
36 & -0.168547 & -1.2946 & 0.100246 \tabularnewline
37 & 0.012422 & 0.0954 & 0.462154 \tabularnewline
38 & 0.014471 & 0.1112 & 0.455936 \tabularnewline
39 & -0.04788 & -0.3678 & 0.35718 \tabularnewline
40 & -0.077213 & -0.5931 & 0.277695 \tabularnewline
41 & 0.031523 & 0.2421 & 0.404758 \tabularnewline
42 & -0.000775 & -0.006 & 0.497634 \tabularnewline
43 & -0.014726 & -0.1131 & 0.455161 \tabularnewline
44 & 0.049814 & 0.3826 & 0.351685 \tabularnewline
45 & 0.038162 & 0.2931 & 0.385226 \tabularnewline
46 & -0.008827 & -0.0678 & 0.473087 \tabularnewline
47 & 0.051104 & 0.3925 & 0.348038 \tabularnewline
48 & -0.062452 & -0.4797 & 0.316605 \tabularnewline
\hline
\end{tabular}
%Source: https://freestatistics.org/blog/index.php?pk=287082&T=2

[TABLE]
[ROW][C]Partial Autocorrelation Function[/C][/ROW]
[ROW][C]Time lag k[/C][C]PACF(k)[/C][C]T-STAT[/C][C]P-value[/C][/ROW]
[ROW][C]1[/C][C]-0.88592[/C][C]-6.8049[/C][C]0[/C][/ROW]
[ROW][C]2[/C][C]0.138452[/C][C]1.0635[/C][C]0.14595[/C][/ROW]
[ROW][C]3[/C][C]-0.622513[/C][C]-4.7816[/C][C]6e-06[/C][/ROW]
[ROW][C]4[/C][C]0.339362[/C][C]2.6067[/C][C]0.005779[/C][/ROW]
[ROW][C]5[/C][C]0.211549[/C][C]1.6249[/C][C]0.054753[/C][/ROW]
[ROW][C]6[/C][C]-0.375933[/C][C]-2.8876[/C][C]0.002709[/C][/ROW]
[ROW][C]7[/C][C]-0.088196[/C][C]-0.6774[/C][C]0.250386[/C][/ROW]
[ROW][C]8[/C][C]0.131434[/C][C]1.0096[/C][C]0.158414[/C][/ROW]
[ROW][C]9[/C][C]-0.133111[/C][C]-1.0224[/C][C]0.155373[/C][/ROW]
[ROW][C]10[/C][C]-0.207588[/C][C]-1.5945[/C][C]0.058082[/C][/ROW]
[ROW][C]11[/C][C]-0.0126[/C][C]-0.0968[/C][C]0.461613[/C][/ROW]
[ROW][C]12[/C][C]-0.017281[/C][C]-0.1327[/C][C]0.447426[/C][/ROW]
[ROW][C]13[/C][C]-0.105707[/C][C]-0.812[/C][C]0.210041[/C][/ROW]
[ROW][C]14[/C][C]-0.071219[/C][C]-0.547[/C][C]0.293206[/C][/ROW]
[ROW][C]15[/C][C]0.02131[/C][C]0.1637[/C][C]0.435269[/C][/ROW]
[ROW][C]16[/C][C]-0.020333[/C][C]-0.1562[/C][C]0.438213[/C][/ROW]
[ROW][C]17[/C][C]-0.022635[/C][C]-0.1739[/C][C]0.431284[/C][/ROW]
[ROW][C]18[/C][C]0.001879[/C][C]0.0144[/C][C]0.494267[/C][/ROW]
[ROW][C]19[/C][C]0.024543[/C][C]0.1885[/C][C]0.42556[/C][/ROW]
[ROW][C]20[/C][C]-0.078743[/C][C]-0.6048[/C][C]0.273805[/C][/ROW]
[ROW][C]21[/C][C]-0.013442[/C][C]-0.1032[/C][C]0.459059[/C][/ROW]
[ROW][C]22[/C][C]0.042809[/C][C]0.3288[/C][C]0.371727[/C][/ROW]
[ROW][C]23[/C][C]0.00897[/C][C]0.0689[/C][C]0.472652[/C][/ROW]
[ROW][C]24[/C][C]-0.083919[/C][C]-0.6446[/C][C]0.260844[/C][/ROW]
[ROW][C]25[/C][C]-0.164195[/C][C]-1.2612[/C][C]0.1061[/C][/ROW]
[ROW][C]26[/C][C]-0.147012[/C][C]-1.1292[/C][C]0.131687[/C][/ROW]
[ROW][C]27[/C][C]-0.020122[/C][C]-0.1546[/C][C]0.438847[/C][/ROW]
[ROW][C]28[/C][C]0.004699[/C][C]0.0361[/C][C]0.485665[/C][/ROW]
[ROW][C]29[/C][C]0.011525[/C][C]0.0885[/C][C]0.464879[/C][/ROW]
[ROW][C]30[/C][C]-0.041436[/C][C]-0.3183[/C][C]0.3757[/C][/ROW]
[ROW][C]31[/C][C]-0.033904[/C][C]-0.2604[/C][C]0.397724[/C][/ROW]
[ROW][C]32[/C][C]-0.050893[/C][C]-0.3909[/C][C]0.348633[/C][/ROW]
[ROW][C]33[/C][C]0.013557[/C][C]0.1041[/C][C]0.458708[/C][/ROW]
[ROW][C]34[/C][C]-0.00637[/C][C]-0.0489[/C][C]0.480571[/C][/ROW]
[ROW][C]35[/C][C]-0.129196[/C][C]-0.9924[/C][C]0.162534[/C][/ROW]
[ROW][C]36[/C][C]-0.168547[/C][C]-1.2946[/C][C]0.100246[/C][/ROW]
[ROW][C]37[/C][C]0.012422[/C][C]0.0954[/C][C]0.462154[/C][/ROW]
[ROW][C]38[/C][C]0.014471[/C][C]0.1112[/C][C]0.455936[/C][/ROW]
[ROW][C]39[/C][C]-0.04788[/C][C]-0.3678[/C][C]0.35718[/C][/ROW]
[ROW][C]40[/C][C]-0.077213[/C][C]-0.5931[/C][C]0.277695[/C][/ROW]
[ROW][C]41[/C][C]0.031523[/C][C]0.2421[/C][C]0.404758[/C][/ROW]
[ROW][C]42[/C][C]-0.000775[/C][C]-0.006[/C][C]0.497634[/C][/ROW]
[ROW][C]43[/C][C]-0.014726[/C][C]-0.1131[/C][C]0.455161[/C][/ROW]
[ROW][C]44[/C][C]0.049814[/C][C]0.3826[/C][C]0.351685[/C][/ROW]
[ROW][C]45[/C][C]0.038162[/C][C]0.2931[/C][C]0.385226[/C][/ROW]
[ROW][C]46[/C][C]-0.008827[/C][C]-0.0678[/C][C]0.473087[/C][/ROW]
[ROW][C]47[/C][C]0.051104[/C][C]0.3925[/C][C]0.348038[/C][/ROW]
[ROW][C]48[/C][C]-0.062452[/C][C]-0.4797[/C][C]0.316605[/C][/ROW]
[/TABLE]
Source: https://freestatistics.org/blog/index.php?pk=287082&T=2

Globally Unique Identifier (entire table): ba.freestatistics.org/blog/index.php?pk=287082&T=2

As an alternative you can also use a QR Code:  

The GUIDs for individual cells are displayed in the table below:

Partial Autocorrelation Function
Time lag kPACF(k)T-STATP-value
1-0.88592-6.80490
20.1384521.06350.14595
3-0.622513-4.78166e-06
40.3393622.60670.005779
50.2115491.62490.054753
6-0.375933-2.88760.002709
7-0.088196-0.67740.250386
80.1314341.00960.158414
9-0.133111-1.02240.155373
10-0.207588-1.59450.058082
11-0.0126-0.09680.461613
12-0.017281-0.13270.447426
13-0.105707-0.8120.210041
14-0.071219-0.5470.293206
150.021310.16370.435269
16-0.020333-0.15620.438213
17-0.022635-0.17390.431284
180.0018790.01440.494267
190.0245430.18850.42556
20-0.078743-0.60480.273805
21-0.013442-0.10320.459059
220.0428090.32880.371727
230.008970.06890.472652
24-0.083919-0.64460.260844
25-0.164195-1.26120.1061
26-0.147012-1.12920.131687
27-0.020122-0.15460.438847
280.0046990.03610.485665
290.0115250.08850.464879
30-0.041436-0.31830.3757
31-0.033904-0.26040.397724
32-0.050893-0.39090.348633
330.0135570.10410.458708
34-0.00637-0.04890.480571
35-0.129196-0.99240.162534
36-0.168547-1.29460.100246
370.0124220.09540.462154
380.0144710.11120.455936
39-0.04788-0.36780.35718
40-0.077213-0.59310.277695
410.0315230.24210.404758
42-0.000775-0.0060.497634
43-0.014726-0.11310.455161
440.0498140.38260.351685
450.0381620.29310.385226
46-0.008827-0.06780.473087
470.0511040.39250.348038
48-0.062452-0.47970.316605


Parameters (Session):
par1 = 48 ; par2 = 1 ; par3 = 1 ; par4 = 0 ; par5 = 4 ; par6 = White Noise ; par7 = 0.95 ;
Parameters (R input):
par1 = 48 ; par2 = 1 ; par3 = 1 ; par4 = 0 ; par5 = 4 ; par6 = White Noise ; par7 = 0.95 ; par8 = ;
R code (references can be found in the software module):
par8 <- ''
par7 <- '0.95'
par6 <- 'White Noise'
par5 <- '4'
par4 <- '0'
par3 <- '0'
par2 <- '1'
par1 <- '48'
if (par1 == 'Default') {
par1 = 10*log10(length(x))
} else {
par1 <- as.numeric(par1)
}
par2 <- as.numeric(par2)
par3 <- as.numeric(par3)
par4 <- as.numeric(par4)
par5 <- as.numeric(par5)
if (par6 == 'White Noise') par6 <- 'white' else par6 <- 'ma'
par7 <- as.numeric(par7)
if (par8 != '') par8 <- as.numeric(par8)
x <- na.omit(x)
ox <- x
if (par8 == '') {
if (par2 == 0) {
x <- log(x)
} else {
x <- (x ^ par2 - 1) / par2
}
} else {
x <- log(x,base=par8)
}
if (par3 > 0) x <- diff(x,lag=1,difference=par3)
if (par4 > 0) x <- diff(x,lag=par5,difference=par4)
bitmap(file='picts.png')
op <- par(mfrow=c(2,1))
plot(ox,type='l',main='Original Time Series',xlab='time',ylab='value')
if (par8=='') {
mytitle <- paste('Working Time Series (lambda=',par2,', d=',par3,', D=',par4,')',sep='')
mysub <- paste('(lambda=',par2,', d=',par3,', D=',par4,', CI=', par7, ', CI type=',par6,')',sep='')
} else {
mytitle <- paste('Working Time Series (base=',par8,', d=',par3,', D=',par4,')',sep='')
mysub <- paste('(base=',par8,', d=',par3,', D=',par4,', CI=', par7, ', CI type=',par6,')',sep='')
}
plot(x,type='l', main=mytitle,xlab='time',ylab='value')
par(op)
dev.off()
bitmap(file='pic1.png')
racf <- acf(x, par1, main='Autocorrelation', xlab='time lag', ylab='ACF', ci.type=par6, ci=par7, sub=mysub)
dev.off()
bitmap(file='pic2.png')
rpacf <- pacf(x,par1,main='Partial Autocorrelation',xlab='lags',ylab='PACF',sub=mysub)
dev.off()
(myacf <- c(racf$acf))
(mypacf <- c(rpacf$acf))
lengthx <- length(x)
sqrtn <- sqrt(lengthx)
load(file='createtable')
a<-table.start()
a<-table.row.start(a)
a<-table.element(a,'Autocorrelation Function',4,TRUE)
a<-table.row.end(a)
a<-table.row.start(a)
a<-table.element(a,'Time lag k',header=TRUE)
a<-table.element(a,hyperlink('basics.htm','ACF(k)','click here for more information about the Autocorrelation Function'),header=TRUE)
a<-table.element(a,'T-STAT',header=TRUE)
a<-table.element(a,'P-value',header=TRUE)
a<-table.row.end(a)
for (i in 2:(par1+1)) {
a<-table.row.start(a)
a<-table.element(a,i-1,header=TRUE)
a<-table.element(a,round(myacf[i],6))
mytstat <- myacf[i]*sqrtn
a<-table.element(a,round(mytstat,4))
a<-table.element(a,round(1-pt(abs(mytstat),lengthx),6))
a<-table.row.end(a)
}
a<-table.end(a)
table.save(a,file='mytable.tab')
a<-table.start()
a<-table.row.start(a)
a<-table.element(a,'Partial Autocorrelation Function',4,TRUE)
a<-table.row.end(a)
a<-table.row.start(a)
a<-table.element(a,'Time lag k',header=TRUE)
a<-table.element(a,hyperlink('basics.htm','PACF(k)','click here for more information about the Partial Autocorrelation Function'),header=TRUE)
a<-table.element(a,'T-STAT',header=TRUE)
a<-table.element(a,'P-value',header=TRUE)
a<-table.row.end(a)
for (i in 1:par1) {
a<-table.row.start(a)
a<-table.element(a,i,header=TRUE)
a<-table.element(a,round(mypacf[i],6))
mytstat <- mypacf[i]*sqrtn
a<-table.element(a,round(mytstat,4))
a<-table.element(a,round(1-pt(abs(mytstat),lengthx),6))
a<-table.row.end(a)
}
a<-table.end(a)
table.save(a,file='mytable1.tab')