Free Statistics

of Irreproducible Research!

Author's title

Author*Unverified author*
R Software Modulerwasp_autocorrelation.wasp
Title produced by software(Partial) Autocorrelation Function
Date of computationMon, 28 Dec 2015 21:16:01 +0000
Cite this page as followsStatistical Computations at FreeStatistics.org, Office for Research Development and Education, URL https://freestatistics.org/blog/index.php?v=date/2015/Dec/28/t14513374734i7zw5lu49vazuu.htm/, Retrieved Thu, 16 May 2024 06:25:48 +0000
Statistical Computations at FreeStatistics.org, Office for Research Development and Education, URL https://freestatistics.org/blog/index.php?pk=287146, Retrieved Thu, 16 May 2024 06:25:48 +0000
QR Codes:

Original text written by user:
IsPrivate?No (this computation is public)
User-defined keywords
Estimated Impact154
Family? (F = Feedback message, R = changed R code, M = changed R Module, P = changed Parameters, D = changed Data)
-       [(Partial) Autocorrelation Function] [] [2015-12-28 21:16:01] [d41d8cd98f00b204e9800998ecf8427e] [Current]
Feedback Forum

Post a new message
Dataseries X:
97,41
97,32
97,33
97,38
97,47
97,5
97,5
97,58
97,7
97,9
97,98
98,03
98,03
97,94
98,12
98,19
98,34
98,42
98,43
98,45
98,77
99,24
99,46
99,54
99,55
99,24
99,43
99,47
99,57
99,62
99,64
99,75
99,85
100,28
100,52
100,57
100,57
100,27
100,27
100,18
100,16
100,18
100,18
100,59
100,69
101,06
101,15
101,16
101,16
100,81
100,94
101,13
101,29
101,34
101,35
101,7
102,05
102,48
102,66
102,72
102,73
102,18
102,22
102,37
102,53
102,61
102,62
103
103,17
103,52
103,69
103,73
99,57
99,09
99,14
99,36
99,6
99,65
99,8
100,15
100,45
100,89
101,13
101,17
101,21
101,1
101,17
101,11
101,2
101,15
100,92
101,1
101,22
101,25
101,39
101,43


Summary of computational transaction
Raw Inputview raw input (R code)
Raw Outputview raw output of R engine
Computing time2 seconds
R Server'Sir Ronald Aylmer Fisher' @ fisher.wessa.net

\begin{tabular}{lllllllll}
\hline
Summary of computational transaction \tabularnewline
Raw Input & view raw input (R code)  \tabularnewline
Raw Output & view raw output of R engine  \tabularnewline
Computing time & 2 seconds \tabularnewline
R Server & 'Sir Ronald Aylmer Fisher' @ fisher.wessa.net \tabularnewline
\hline
\end{tabular}
%Source: https://freestatistics.org/blog/index.php?pk=287146&T=0

[TABLE]
[ROW][C]Summary of computational transaction[/C][/ROW]
[ROW][C]Raw Input[/C][C]view raw input (R code) [/C][/ROW]
[ROW][C]Raw Output[/C][C]view raw output of R engine [/C][/ROW]
[ROW][C]Computing time[/C][C]2 seconds[/C][/ROW]
[ROW][C]R Server[/C][C]'Sir Ronald Aylmer Fisher' @ fisher.wessa.net[/C][/ROW]
[/TABLE]
Source: https://freestatistics.org/blog/index.php?pk=287146&T=0

Globally Unique Identifier (entire table): ba.freestatistics.org/blog/index.php?pk=287146&T=0

As an alternative you can also use a QR Code:  

The GUIDs for individual cells are displayed in the table below:

Summary of computational transaction
Raw Inputview raw input (R code)
Raw Outputview raw output of R engine
Computing time2 seconds
R Server'Sir Ronald Aylmer Fisher' @ fisher.wessa.net


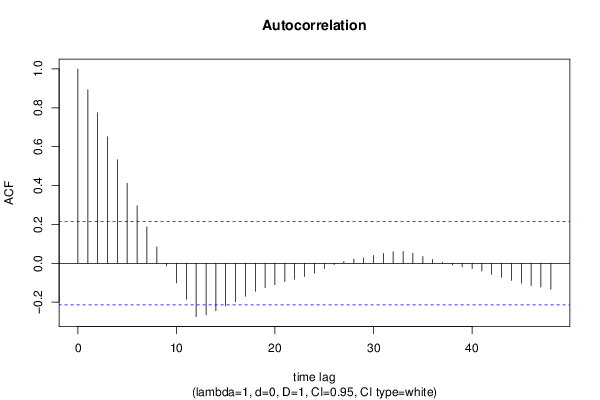
Autocorrelation Function
Time lag kACF(k)T-STATP-value
10.8925998.18080
20.7739347.09320
30.6515755.97180
40.5329084.88422e-06
50.4121413.77730.000148
60.2952922.70640.004118
70.1875261.71870.044676
80.0839430.76940.221921
9-0.013647-0.12510.450382
10-0.100925-0.9250.17881
11-0.185281-1.69810.046593
12-0.274678-2.51750.00686
13-0.264993-2.42870.008643
14-0.243989-2.23620.013995
15-0.219669-2.01330.023643
16-0.198374-1.81810.036305
17-0.169645-1.55480.061874
18-0.144021-1.320.095214
19-0.1252-1.14750.127221
20-0.109778-1.00610.158621
21-0.094147-0.86290.195333
22-0.081479-0.74680.228645
23-0.067495-0.61860.268928
24-0.050584-0.46360.322062
25-0.027342-0.25060.401371
26-0.00622-0.0570.477338
270.0091960.08430.466517
280.0215540.19750.421938
290.0274530.25160.400978
300.0400710.36730.357175
310.0505070.46290.322315
320.0590480.54120.294905
330.0600420.55030.291789
340.0509720.46720.320797
350.0344960.31620.376331
360.019790.18140.428254
370.0049990.04580.481783
38-0.009005-0.08250.467211
39-0.018602-0.17050.432518
40-0.026807-0.24570.403261
41-0.039432-0.36140.359353
42-0.056127-0.51440.304158
43-0.072074-0.66060.255348
44-0.087874-0.80540.211438
45-0.102324-0.93780.175514
46-0.114606-1.05040.148278
47-0.121742-1.11580.133849
48-0.133559-1.22410.112171

\begin{tabular}{lllllllll}
\hline
Autocorrelation Function \tabularnewline
Time lag k & ACF(k) & T-STAT & P-value \tabularnewline
1 & 0.892599 & 8.1808 & 0 \tabularnewline
2 & 0.773934 & 7.0932 & 0 \tabularnewline
3 & 0.651575 & 5.9718 & 0 \tabularnewline
4 & 0.532908 & 4.8842 & 2e-06 \tabularnewline
5 & 0.412141 & 3.7773 & 0.000148 \tabularnewline
6 & 0.295292 & 2.7064 & 0.004118 \tabularnewline
7 & 0.187526 & 1.7187 & 0.044676 \tabularnewline
8 & 0.083943 & 0.7694 & 0.221921 \tabularnewline
9 & -0.013647 & -0.1251 & 0.450382 \tabularnewline
10 & -0.100925 & -0.925 & 0.17881 \tabularnewline
11 & -0.185281 & -1.6981 & 0.046593 \tabularnewline
12 & -0.274678 & -2.5175 & 0.00686 \tabularnewline
13 & -0.264993 & -2.4287 & 0.008643 \tabularnewline
14 & -0.243989 & -2.2362 & 0.013995 \tabularnewline
15 & -0.219669 & -2.0133 & 0.023643 \tabularnewline
16 & -0.198374 & -1.8181 & 0.036305 \tabularnewline
17 & -0.169645 & -1.5548 & 0.061874 \tabularnewline
18 & -0.144021 & -1.32 & 0.095214 \tabularnewline
19 & -0.1252 & -1.1475 & 0.127221 \tabularnewline
20 & -0.109778 & -1.0061 & 0.158621 \tabularnewline
21 & -0.094147 & -0.8629 & 0.195333 \tabularnewline
22 & -0.081479 & -0.7468 & 0.228645 \tabularnewline
23 & -0.067495 & -0.6186 & 0.268928 \tabularnewline
24 & -0.050584 & -0.4636 & 0.322062 \tabularnewline
25 & -0.027342 & -0.2506 & 0.401371 \tabularnewline
26 & -0.00622 & -0.057 & 0.477338 \tabularnewline
27 & 0.009196 & 0.0843 & 0.466517 \tabularnewline
28 & 0.021554 & 0.1975 & 0.421938 \tabularnewline
29 & 0.027453 & 0.2516 & 0.400978 \tabularnewline
30 & 0.040071 & 0.3673 & 0.357175 \tabularnewline
31 & 0.050507 & 0.4629 & 0.322315 \tabularnewline
32 & 0.059048 & 0.5412 & 0.294905 \tabularnewline
33 & 0.060042 & 0.5503 & 0.291789 \tabularnewline
34 & 0.050972 & 0.4672 & 0.320797 \tabularnewline
35 & 0.034496 & 0.3162 & 0.376331 \tabularnewline
36 & 0.01979 & 0.1814 & 0.428254 \tabularnewline
37 & 0.004999 & 0.0458 & 0.481783 \tabularnewline
38 & -0.009005 & -0.0825 & 0.467211 \tabularnewline
39 & -0.018602 & -0.1705 & 0.432518 \tabularnewline
40 & -0.026807 & -0.2457 & 0.403261 \tabularnewline
41 & -0.039432 & -0.3614 & 0.359353 \tabularnewline
42 & -0.056127 & -0.5144 & 0.304158 \tabularnewline
43 & -0.072074 & -0.6606 & 0.255348 \tabularnewline
44 & -0.087874 & -0.8054 & 0.211438 \tabularnewline
45 & -0.102324 & -0.9378 & 0.175514 \tabularnewline
46 & -0.114606 & -1.0504 & 0.148278 \tabularnewline
47 & -0.121742 & -1.1158 & 0.133849 \tabularnewline
48 & -0.133559 & -1.2241 & 0.112171 \tabularnewline
\hline
\end{tabular}
%Source: https://freestatistics.org/blog/index.php?pk=287146&T=1

[TABLE]
[ROW][C]Autocorrelation Function[/C][/ROW]
[ROW][C]Time lag k[/C][C]ACF(k)[/C][C]T-STAT[/C][C]P-value[/C][/ROW]
[ROW][C]1[/C][C]0.892599[/C][C]8.1808[/C][C]0[/C][/ROW]
[ROW][C]2[/C][C]0.773934[/C][C]7.0932[/C][C]0[/C][/ROW]
[ROW][C]3[/C][C]0.651575[/C][C]5.9718[/C][C]0[/C][/ROW]
[ROW][C]4[/C][C]0.532908[/C][C]4.8842[/C][C]2e-06[/C][/ROW]
[ROW][C]5[/C][C]0.412141[/C][C]3.7773[/C][C]0.000148[/C][/ROW]
[ROW][C]6[/C][C]0.295292[/C][C]2.7064[/C][C]0.004118[/C][/ROW]
[ROW][C]7[/C][C]0.187526[/C][C]1.7187[/C][C]0.044676[/C][/ROW]
[ROW][C]8[/C][C]0.083943[/C][C]0.7694[/C][C]0.221921[/C][/ROW]
[ROW][C]9[/C][C]-0.013647[/C][C]-0.1251[/C][C]0.450382[/C][/ROW]
[ROW][C]10[/C][C]-0.100925[/C][C]-0.925[/C][C]0.17881[/C][/ROW]
[ROW][C]11[/C][C]-0.185281[/C][C]-1.6981[/C][C]0.046593[/C][/ROW]
[ROW][C]12[/C][C]-0.274678[/C][C]-2.5175[/C][C]0.00686[/C][/ROW]
[ROW][C]13[/C][C]-0.264993[/C][C]-2.4287[/C][C]0.008643[/C][/ROW]
[ROW][C]14[/C][C]-0.243989[/C][C]-2.2362[/C][C]0.013995[/C][/ROW]
[ROW][C]15[/C][C]-0.219669[/C][C]-2.0133[/C][C]0.023643[/C][/ROW]
[ROW][C]16[/C][C]-0.198374[/C][C]-1.8181[/C][C]0.036305[/C][/ROW]
[ROW][C]17[/C][C]-0.169645[/C][C]-1.5548[/C][C]0.061874[/C][/ROW]
[ROW][C]18[/C][C]-0.144021[/C][C]-1.32[/C][C]0.095214[/C][/ROW]
[ROW][C]19[/C][C]-0.1252[/C][C]-1.1475[/C][C]0.127221[/C][/ROW]
[ROW][C]20[/C][C]-0.109778[/C][C]-1.0061[/C][C]0.158621[/C][/ROW]
[ROW][C]21[/C][C]-0.094147[/C][C]-0.8629[/C][C]0.195333[/C][/ROW]
[ROW][C]22[/C][C]-0.081479[/C][C]-0.7468[/C][C]0.228645[/C][/ROW]
[ROW][C]23[/C][C]-0.067495[/C][C]-0.6186[/C][C]0.268928[/C][/ROW]
[ROW][C]24[/C][C]-0.050584[/C][C]-0.4636[/C][C]0.322062[/C][/ROW]
[ROW][C]25[/C][C]-0.027342[/C][C]-0.2506[/C][C]0.401371[/C][/ROW]
[ROW][C]26[/C][C]-0.00622[/C][C]-0.057[/C][C]0.477338[/C][/ROW]
[ROW][C]27[/C][C]0.009196[/C][C]0.0843[/C][C]0.466517[/C][/ROW]
[ROW][C]28[/C][C]0.021554[/C][C]0.1975[/C][C]0.421938[/C][/ROW]
[ROW][C]29[/C][C]0.027453[/C][C]0.2516[/C][C]0.400978[/C][/ROW]
[ROW][C]30[/C][C]0.040071[/C][C]0.3673[/C][C]0.357175[/C][/ROW]
[ROW][C]31[/C][C]0.050507[/C][C]0.4629[/C][C]0.322315[/C][/ROW]
[ROW][C]32[/C][C]0.059048[/C][C]0.5412[/C][C]0.294905[/C][/ROW]
[ROW][C]33[/C][C]0.060042[/C][C]0.5503[/C][C]0.291789[/C][/ROW]
[ROW][C]34[/C][C]0.050972[/C][C]0.4672[/C][C]0.320797[/C][/ROW]
[ROW][C]35[/C][C]0.034496[/C][C]0.3162[/C][C]0.376331[/C][/ROW]
[ROW][C]36[/C][C]0.01979[/C][C]0.1814[/C][C]0.428254[/C][/ROW]
[ROW][C]37[/C][C]0.004999[/C][C]0.0458[/C][C]0.481783[/C][/ROW]
[ROW][C]38[/C][C]-0.009005[/C][C]-0.0825[/C][C]0.467211[/C][/ROW]
[ROW][C]39[/C][C]-0.018602[/C][C]-0.1705[/C][C]0.432518[/C][/ROW]
[ROW][C]40[/C][C]-0.026807[/C][C]-0.2457[/C][C]0.403261[/C][/ROW]
[ROW][C]41[/C][C]-0.039432[/C][C]-0.3614[/C][C]0.359353[/C][/ROW]
[ROW][C]42[/C][C]-0.056127[/C][C]-0.5144[/C][C]0.304158[/C][/ROW]
[ROW][C]43[/C][C]-0.072074[/C][C]-0.6606[/C][C]0.255348[/C][/ROW]
[ROW][C]44[/C][C]-0.087874[/C][C]-0.8054[/C][C]0.211438[/C][/ROW]
[ROW][C]45[/C][C]-0.102324[/C][C]-0.9378[/C][C]0.175514[/C][/ROW]
[ROW][C]46[/C][C]-0.114606[/C][C]-1.0504[/C][C]0.148278[/C][/ROW]
[ROW][C]47[/C][C]-0.121742[/C][C]-1.1158[/C][C]0.133849[/C][/ROW]
[ROW][C]48[/C][C]-0.133559[/C][C]-1.2241[/C][C]0.112171[/C][/ROW]
[/TABLE]
Source: https://freestatistics.org/blog/index.php?pk=287146&T=1

Globally Unique Identifier (entire table): ba.freestatistics.org/blog/index.php?pk=287146&T=1

As an alternative you can also use a QR Code:  

The GUIDs for individual cells are displayed in the table below:

Autocorrelation Function
Time lag kACF(k)T-STATP-value
10.8925998.18080
20.7739347.09320
30.6515755.97180
40.5329084.88422e-06
50.4121413.77730.000148
60.2952922.70640.004118
70.1875261.71870.044676
80.0839430.76940.221921
9-0.013647-0.12510.450382
10-0.100925-0.9250.17881
11-0.185281-1.69810.046593
12-0.274678-2.51750.00686
13-0.264993-2.42870.008643
14-0.243989-2.23620.013995
15-0.219669-2.01330.023643
16-0.198374-1.81810.036305
17-0.169645-1.55480.061874
18-0.144021-1.320.095214
19-0.1252-1.14750.127221
20-0.109778-1.00610.158621
21-0.094147-0.86290.195333
22-0.081479-0.74680.228645
23-0.067495-0.61860.268928
24-0.050584-0.46360.322062
25-0.027342-0.25060.401371
26-0.00622-0.0570.477338
270.0091960.08430.466517
280.0215540.19750.421938
290.0274530.25160.400978
300.0400710.36730.357175
310.0505070.46290.322315
320.0590480.54120.294905
330.0600420.55030.291789
340.0509720.46720.320797
350.0344960.31620.376331
360.019790.18140.428254
370.0049990.04580.481783
38-0.009005-0.08250.467211
39-0.018602-0.17050.432518
40-0.026807-0.24570.403261
41-0.039432-0.36140.359353
42-0.056127-0.51440.304158
43-0.072074-0.66060.255348
44-0.087874-0.80540.211438
45-0.102324-0.93780.175514
46-0.114606-1.05040.148278
47-0.121742-1.11580.133849
48-0.133559-1.22410.112171


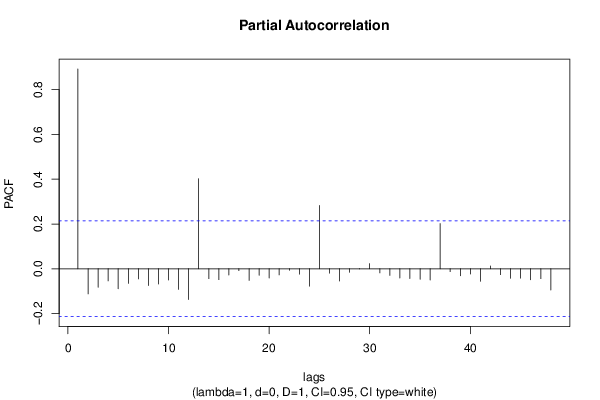
Partial Autocorrelation Function
Time lag kPACF(k)T-STATP-value
10.8925998.18080
2-0.112162-1.0280.153454
3-0.08273-0.75820.225218
4-0.054101-0.49580.31065
5-0.089479-0.82010.207243
6-0.065293-0.59840.275586
7-0.045089-0.41320.340239
8-0.074838-0.68590.247332
9-0.068056-0.62370.267244
10-0.049816-0.45660.324579
11-0.092091-0.8440.200526
12-0.137119-1.25670.10617
130.4018593.68310.000203
14-0.043977-0.40310.343966
15-0.048416-0.44370.329186
16-0.027469-0.25180.40092
17-0.008292-0.0760.469801
18-0.052018-0.47680.317388
19-0.028686-0.26290.396631
20-0.040946-0.37530.354202
21-0.027257-0.24980.401669
22-0.007003-0.06420.474488
23-0.023993-0.21990.413243
24-0.077434-0.70970.239928
250.2829862.59360.005601
26-0.019475-0.17850.429385
27-0.054985-0.50390.307811
28-0.015775-0.14460.442694
29-0.000895-0.00820.496738
300.0230680.21140.416535
31-0.018418-0.16880.433177
32-0.029649-0.27170.393247
33-0.041048-0.37620.353855
34-0.043511-0.39880.345532
35-0.046528-0.42640.335441
36-0.050554-0.46330.322161
370.2018331.84980.033927
38-0.012685-0.11630.453862
39-0.031521-0.28890.386687
40-0.023518-0.21550.414931
41-0.055989-0.51310.304599
420.0127720.11710.453548
43-0.026289-0.24090.405093
44-0.042238-0.38710.349823
45-0.041814-0.38320.351258
46-0.049349-0.45230.326114
47-0.043906-0.40240.344205
48-0.095166-0.87220.192791

\begin{tabular}{lllllllll}
\hline
Partial Autocorrelation Function \tabularnewline
Time lag k & PACF(k) & T-STAT & P-value \tabularnewline
1 & 0.892599 & 8.1808 & 0 \tabularnewline
2 & -0.112162 & -1.028 & 0.153454 \tabularnewline
3 & -0.08273 & -0.7582 & 0.225218 \tabularnewline
4 & -0.054101 & -0.4958 & 0.31065 \tabularnewline
5 & -0.089479 & -0.8201 & 0.207243 \tabularnewline
6 & -0.065293 & -0.5984 & 0.275586 \tabularnewline
7 & -0.045089 & -0.4132 & 0.340239 \tabularnewline
8 & -0.074838 & -0.6859 & 0.247332 \tabularnewline
9 & -0.068056 & -0.6237 & 0.267244 \tabularnewline
10 & -0.049816 & -0.4566 & 0.324579 \tabularnewline
11 & -0.092091 & -0.844 & 0.200526 \tabularnewline
12 & -0.137119 & -1.2567 & 0.10617 \tabularnewline
13 & 0.401859 & 3.6831 & 0.000203 \tabularnewline
14 & -0.043977 & -0.4031 & 0.343966 \tabularnewline
15 & -0.048416 & -0.4437 & 0.329186 \tabularnewline
16 & -0.027469 & -0.2518 & 0.40092 \tabularnewline
17 & -0.008292 & -0.076 & 0.469801 \tabularnewline
18 & -0.052018 & -0.4768 & 0.317388 \tabularnewline
19 & -0.028686 & -0.2629 & 0.396631 \tabularnewline
20 & -0.040946 & -0.3753 & 0.354202 \tabularnewline
21 & -0.027257 & -0.2498 & 0.401669 \tabularnewline
22 & -0.007003 & -0.0642 & 0.474488 \tabularnewline
23 & -0.023993 & -0.2199 & 0.413243 \tabularnewline
24 & -0.077434 & -0.7097 & 0.239928 \tabularnewline
25 & 0.282986 & 2.5936 & 0.005601 \tabularnewline
26 & -0.019475 & -0.1785 & 0.429385 \tabularnewline
27 & -0.054985 & -0.5039 & 0.307811 \tabularnewline
28 & -0.015775 & -0.1446 & 0.442694 \tabularnewline
29 & -0.000895 & -0.0082 & 0.496738 \tabularnewline
30 & 0.023068 & 0.2114 & 0.416535 \tabularnewline
31 & -0.018418 & -0.1688 & 0.433177 \tabularnewline
32 & -0.029649 & -0.2717 & 0.393247 \tabularnewline
33 & -0.041048 & -0.3762 & 0.353855 \tabularnewline
34 & -0.043511 & -0.3988 & 0.345532 \tabularnewline
35 & -0.046528 & -0.4264 & 0.335441 \tabularnewline
36 & -0.050554 & -0.4633 & 0.322161 \tabularnewline
37 & 0.201833 & 1.8498 & 0.033927 \tabularnewline
38 & -0.012685 & -0.1163 & 0.453862 \tabularnewline
39 & -0.031521 & -0.2889 & 0.386687 \tabularnewline
40 & -0.023518 & -0.2155 & 0.414931 \tabularnewline
41 & -0.055989 & -0.5131 & 0.304599 \tabularnewline
42 & 0.012772 & 0.1171 & 0.453548 \tabularnewline
43 & -0.026289 & -0.2409 & 0.405093 \tabularnewline
44 & -0.042238 & -0.3871 & 0.349823 \tabularnewline
45 & -0.041814 & -0.3832 & 0.351258 \tabularnewline
46 & -0.049349 & -0.4523 & 0.326114 \tabularnewline
47 & -0.043906 & -0.4024 & 0.344205 \tabularnewline
48 & -0.095166 & -0.8722 & 0.192791 \tabularnewline
\hline
\end{tabular}
%Source: https://freestatistics.org/blog/index.php?pk=287146&T=2

[TABLE]
[ROW][C]Partial Autocorrelation Function[/C][/ROW]
[ROW][C]Time lag k[/C][C]PACF(k)[/C][C]T-STAT[/C][C]P-value[/C][/ROW]
[ROW][C]1[/C][C]0.892599[/C][C]8.1808[/C][C]0[/C][/ROW]
[ROW][C]2[/C][C]-0.112162[/C][C]-1.028[/C][C]0.153454[/C][/ROW]
[ROW][C]3[/C][C]-0.08273[/C][C]-0.7582[/C][C]0.225218[/C][/ROW]
[ROW][C]4[/C][C]-0.054101[/C][C]-0.4958[/C][C]0.31065[/C][/ROW]
[ROW][C]5[/C][C]-0.089479[/C][C]-0.8201[/C][C]0.207243[/C][/ROW]
[ROW][C]6[/C][C]-0.065293[/C][C]-0.5984[/C][C]0.275586[/C][/ROW]
[ROW][C]7[/C][C]-0.045089[/C][C]-0.4132[/C][C]0.340239[/C][/ROW]
[ROW][C]8[/C][C]-0.074838[/C][C]-0.6859[/C][C]0.247332[/C][/ROW]
[ROW][C]9[/C][C]-0.068056[/C][C]-0.6237[/C][C]0.267244[/C][/ROW]
[ROW][C]10[/C][C]-0.049816[/C][C]-0.4566[/C][C]0.324579[/C][/ROW]
[ROW][C]11[/C][C]-0.092091[/C][C]-0.844[/C][C]0.200526[/C][/ROW]
[ROW][C]12[/C][C]-0.137119[/C][C]-1.2567[/C][C]0.10617[/C][/ROW]
[ROW][C]13[/C][C]0.401859[/C][C]3.6831[/C][C]0.000203[/C][/ROW]
[ROW][C]14[/C][C]-0.043977[/C][C]-0.4031[/C][C]0.343966[/C][/ROW]
[ROW][C]15[/C][C]-0.048416[/C][C]-0.4437[/C][C]0.329186[/C][/ROW]
[ROW][C]16[/C][C]-0.027469[/C][C]-0.2518[/C][C]0.40092[/C][/ROW]
[ROW][C]17[/C][C]-0.008292[/C][C]-0.076[/C][C]0.469801[/C][/ROW]
[ROW][C]18[/C][C]-0.052018[/C][C]-0.4768[/C][C]0.317388[/C][/ROW]
[ROW][C]19[/C][C]-0.028686[/C][C]-0.2629[/C][C]0.396631[/C][/ROW]
[ROW][C]20[/C][C]-0.040946[/C][C]-0.3753[/C][C]0.354202[/C][/ROW]
[ROW][C]21[/C][C]-0.027257[/C][C]-0.2498[/C][C]0.401669[/C][/ROW]
[ROW][C]22[/C][C]-0.007003[/C][C]-0.0642[/C][C]0.474488[/C][/ROW]
[ROW][C]23[/C][C]-0.023993[/C][C]-0.2199[/C][C]0.413243[/C][/ROW]
[ROW][C]24[/C][C]-0.077434[/C][C]-0.7097[/C][C]0.239928[/C][/ROW]
[ROW][C]25[/C][C]0.282986[/C][C]2.5936[/C][C]0.005601[/C][/ROW]
[ROW][C]26[/C][C]-0.019475[/C][C]-0.1785[/C][C]0.429385[/C][/ROW]
[ROW][C]27[/C][C]-0.054985[/C][C]-0.5039[/C][C]0.307811[/C][/ROW]
[ROW][C]28[/C][C]-0.015775[/C][C]-0.1446[/C][C]0.442694[/C][/ROW]
[ROW][C]29[/C][C]-0.000895[/C][C]-0.0082[/C][C]0.496738[/C][/ROW]
[ROW][C]30[/C][C]0.023068[/C][C]0.2114[/C][C]0.416535[/C][/ROW]
[ROW][C]31[/C][C]-0.018418[/C][C]-0.1688[/C][C]0.433177[/C][/ROW]
[ROW][C]32[/C][C]-0.029649[/C][C]-0.2717[/C][C]0.393247[/C][/ROW]
[ROW][C]33[/C][C]-0.041048[/C][C]-0.3762[/C][C]0.353855[/C][/ROW]
[ROW][C]34[/C][C]-0.043511[/C][C]-0.3988[/C][C]0.345532[/C][/ROW]
[ROW][C]35[/C][C]-0.046528[/C][C]-0.4264[/C][C]0.335441[/C][/ROW]
[ROW][C]36[/C][C]-0.050554[/C][C]-0.4633[/C][C]0.322161[/C][/ROW]
[ROW][C]37[/C][C]0.201833[/C][C]1.8498[/C][C]0.033927[/C][/ROW]
[ROW][C]38[/C][C]-0.012685[/C][C]-0.1163[/C][C]0.453862[/C][/ROW]
[ROW][C]39[/C][C]-0.031521[/C][C]-0.2889[/C][C]0.386687[/C][/ROW]
[ROW][C]40[/C][C]-0.023518[/C][C]-0.2155[/C][C]0.414931[/C][/ROW]
[ROW][C]41[/C][C]-0.055989[/C][C]-0.5131[/C][C]0.304599[/C][/ROW]
[ROW][C]42[/C][C]0.012772[/C][C]0.1171[/C][C]0.453548[/C][/ROW]
[ROW][C]43[/C][C]-0.026289[/C][C]-0.2409[/C][C]0.405093[/C][/ROW]
[ROW][C]44[/C][C]-0.042238[/C][C]-0.3871[/C][C]0.349823[/C][/ROW]
[ROW][C]45[/C][C]-0.041814[/C][C]-0.3832[/C][C]0.351258[/C][/ROW]
[ROW][C]46[/C][C]-0.049349[/C][C]-0.4523[/C][C]0.326114[/C][/ROW]
[ROW][C]47[/C][C]-0.043906[/C][C]-0.4024[/C][C]0.344205[/C][/ROW]
[ROW][C]48[/C][C]-0.095166[/C][C]-0.8722[/C][C]0.192791[/C][/ROW]
[/TABLE]
Source: https://freestatistics.org/blog/index.php?pk=287146&T=2

Globally Unique Identifier (entire table): ba.freestatistics.org/blog/index.php?pk=287146&T=2

As an alternative you can also use a QR Code:  

The GUIDs for individual cells are displayed in the table below:

Partial Autocorrelation Function
Time lag kPACF(k)T-STATP-value
10.8925998.18080
2-0.112162-1.0280.153454
3-0.08273-0.75820.225218
4-0.054101-0.49580.31065
5-0.089479-0.82010.207243
6-0.065293-0.59840.275586
7-0.045089-0.41320.340239
8-0.074838-0.68590.247332
9-0.068056-0.62370.267244
10-0.049816-0.45660.324579
11-0.092091-0.8440.200526
12-0.137119-1.25670.10617
130.4018593.68310.000203
14-0.043977-0.40310.343966
15-0.048416-0.44370.329186
16-0.027469-0.25180.40092
17-0.008292-0.0760.469801
18-0.052018-0.47680.317388
19-0.028686-0.26290.396631
20-0.040946-0.37530.354202
21-0.027257-0.24980.401669
22-0.007003-0.06420.474488
23-0.023993-0.21990.413243
24-0.077434-0.70970.239928
250.2829862.59360.005601
26-0.019475-0.17850.429385
27-0.054985-0.50390.307811
28-0.015775-0.14460.442694
29-0.000895-0.00820.496738
300.0230680.21140.416535
31-0.018418-0.16880.433177
32-0.029649-0.27170.393247
33-0.041048-0.37620.353855
34-0.043511-0.39880.345532
35-0.046528-0.42640.335441
36-0.050554-0.46330.322161
370.2018331.84980.033927
38-0.012685-0.11630.453862
39-0.031521-0.28890.386687
40-0.023518-0.21550.414931
41-0.055989-0.51310.304599
420.0127720.11710.453548
43-0.026289-0.24090.405093
44-0.042238-0.38710.349823
45-0.041814-0.38320.351258
46-0.049349-0.45230.326114
47-0.043906-0.40240.344205
48-0.095166-0.87220.192791


Parameters (Session):
par1 = 48 ; par2 = 1 ; par3 = 0 ; par4 = 1 ; par5 = 12 ; par6 = White Noise ; par7 = 0.95 ;
Parameters (R input):
par1 = 48 ; par2 = 1 ; par3 = 0 ; par4 = 1 ; par5 = 12 ; par6 = White Noise ; par7 = 0.95 ; par8 = ;
R code (references can be found in the software module):
if (par1 == 'Default') {
par1 = 10*log10(length(x))
} else {
par1 <- as.numeric(par1)
}
par2 <- as.numeric(par2)
par3 <- as.numeric(par3)
par4 <- as.numeric(par4)
par5 <- as.numeric(par5)
if (par6 == 'White Noise') par6 <- 'white' else par6 <- 'ma'
par7 <- as.numeric(par7)
if (par8 != '') par8 <- as.numeric(par8)
x <- na.omit(x)
ox <- x
if (par8 == '') {
if (par2 == 0) {
x <- log(x)
} else {
x <- (x ^ par2 - 1) / par2
}
} else {
x <- log(x,base=par8)
}
if (par3 > 0) x <- diff(x,lag=1,difference=par3)
if (par4 > 0) x <- diff(x,lag=par5,difference=par4)
bitmap(file='picts.png')
op <- par(mfrow=c(2,1))
plot(ox,type='l',main='Original Time Series',xlab='time',ylab='value')
if (par8=='') {
mytitle <- paste('Working Time Series (lambda=',par2,', d=',par3,', D=',par4,')',sep='')
mysub <- paste('(lambda=',par2,', d=',par3,', D=',par4,', CI=', par7, ', CI type=',par6,')',sep='')
} else {
mytitle <- paste('Working Time Series (base=',par8,', d=',par3,', D=',par4,')',sep='')
mysub <- paste('(base=',par8,', d=',par3,', D=',par4,', CI=', par7, ', CI type=',par6,')',sep='')
}
plot(x,type='l', main=mytitle,xlab='time',ylab='value')
par(op)
dev.off()
bitmap(file='pic1.png')
racf <- acf(x, par1, main='Autocorrelation', xlab='time lag', ylab='ACF', ci.type=par6, ci=par7, sub=mysub)
dev.off()
bitmap(file='pic2.png')
rpacf <- pacf(x,par1,main='Partial Autocorrelation',xlab='lags',ylab='PACF',sub=mysub)
dev.off()
(myacf <- c(racf$acf))
(mypacf <- c(rpacf$acf))
lengthx <- length(x)
sqrtn <- sqrt(lengthx)
load(file='createtable')
a<-table.start()
a<-table.row.start(a)
a<-table.element(a,'Autocorrelation Function',4,TRUE)
a<-table.row.end(a)
a<-table.row.start(a)
a<-table.element(a,'Time lag k',header=TRUE)
a<-table.element(a,hyperlink('basics.htm','ACF(k)','click here for more information about the Autocorrelation Function'),header=TRUE)
a<-table.element(a,'T-STAT',header=TRUE)
a<-table.element(a,'P-value',header=TRUE)
a<-table.row.end(a)
for (i in 2:(par1+1)) {
a<-table.row.start(a)
a<-table.element(a,i-1,header=TRUE)
a<-table.element(a,round(myacf[i],6))
mytstat <- myacf[i]*sqrtn
a<-table.element(a,round(mytstat,4))
a<-table.element(a,round(1-pt(abs(mytstat),lengthx),6))
a<-table.row.end(a)
}
a<-table.end(a)
table.save(a,file='mytable.tab')
a<-table.start()
a<-table.row.start(a)
a<-table.element(a,'Partial Autocorrelation Function',4,TRUE)
a<-table.row.end(a)
a<-table.row.start(a)
a<-table.element(a,'Time lag k',header=TRUE)
a<-table.element(a,hyperlink('basics.htm','PACF(k)','click here for more information about the Partial Autocorrelation Function'),header=TRUE)
a<-table.element(a,'T-STAT',header=TRUE)
a<-table.element(a,'P-value',header=TRUE)
a<-table.row.end(a)
for (i in 1:par1) {
a<-table.row.start(a)
a<-table.element(a,i,header=TRUE)
a<-table.element(a,round(mypacf[i],6))
mytstat <- mypacf[i]*sqrtn
a<-table.element(a,round(mytstat,4))
a<-table.element(a,round(1-pt(abs(mytstat),lengthx),6))
a<-table.row.end(a)
}
a<-table.end(a)
table.save(a,file='mytable1.tab')