Free Statistics
of Irreproducible Research!
Description of Statistical Computation | |||||||||||||||||||||||||||||||||||||||
|---|---|---|---|---|---|---|---|---|---|---|---|---|---|---|---|---|---|---|---|---|---|---|---|---|---|---|---|---|---|---|---|---|---|---|---|---|---|---|---|
| Author's title | |||||||||||||||||||||||||||||||||||||||
| Author | *The author of this computation has been verified* | ||||||||||||||||||||||||||||||||||||||
| R Software Module | rwasp_fitdistrnorm.wasp | ||||||||||||||||||||||||||||||||||||||
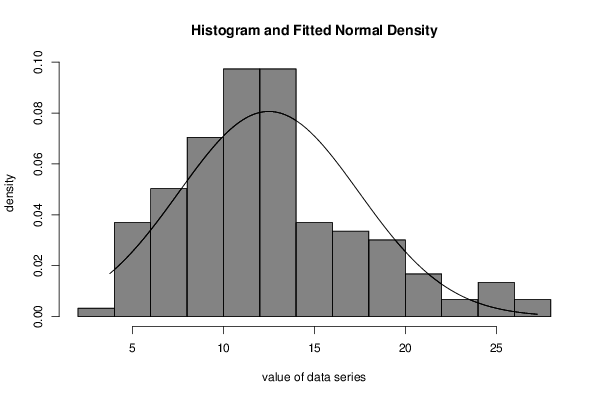
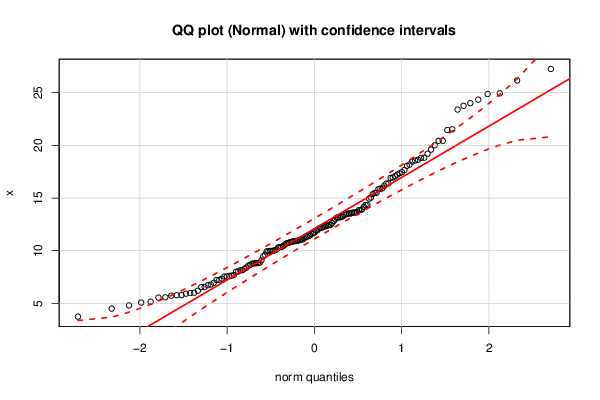
| Title produced by software | ML Fitting and QQ Plot- Normal Distribution | ||||||||||||||||||||||||||||||||||||||
| Date of computation | Thu, 31 Dec 2015 08:53:36 +0000 | ||||||||||||||||||||||||||||||||||||||
| Cite this page as follows | Statistical Computations at FreeStatistics.org, Office for Research Development and Education, URL https://freestatistics.org/blog/index.php?v=date/2015/Dec/31/t1451552066mekbhtu8rgffcaz.htm/, Retrieved Thu, 16 May 2024 09:37:43 +0000 | ||||||||||||||||||||||||||||||||||||||
| Statistical Computations at FreeStatistics.org, Office for Research Development and Education, URL https://freestatistics.org/blog/index.php?pk=287226, Retrieved Thu, 16 May 2024 09:37:43 +0000 | |||||||||||||||||||||||||||||||||||||||
| QR Codes: | |||||||||||||||||||||||||||||||||||||||
|
| |||||||||||||||||||||||||||||||||||||||
| Original text written by user: | |||||||||||||||||||||||||||||||||||||||
| IsPrivate? | No (this computation is public) | ||||||||||||||||||||||||||||||||||||||
| User-defined keywords | |||||||||||||||||||||||||||||||||||||||
| Estimated Impact | 180 | ||||||||||||||||||||||||||||||||||||||
Tree of Dependent Computations | |||||||||||||||||||||||||||||||||||||||
| Family? (F = Feedback message, R = changed R code, M = changed R Module, P = changed Parameters, D = changed Data) | |||||||||||||||||||||||||||||||||||||||
| - [ML Fitting and QQ Plot- Normal Distribution] [] [2015-12-31 08:53:36] [85088361cc0f17e8ae42c599c79c3ce4] [Current] | |||||||||||||||||||||||||||||||||||||||
| Feedback Forum | |||||||||||||||||||||||||||||||||||||||
Post a new message | |||||||||||||||||||||||||||||||||||||||
Dataset | |||||||||||||||||||||||||||||||||||||||
| Dataseries X: | |||||||||||||||||||||||||||||||||||||||
23.39891534 18.63114362 24.00129749 24.33538561 6.95482788 12.18191325 11.89725912 17.45817011 15.49730749 9.960904775 16.94420457 13.6069243 18.05578654 8.777212905 23.75095371 10.31207143 11.07382298 10.7287512 10.06054204 16.39177569 9.614206768 6.792412037 11.0365405 15.92092122 9.089997025 9.93350091 6.553551371 18.80488254 16.91677505 7.343347313 5.922881844 12.26159859 7.235097614 12.47194813 5.785021967 18.56666722 7.548414035 11.45270984 11.30990807 6.013265179 5.580306869 13.92859886 10.91947325 9.457567421 12.43574602 12.09653498 6.543827211 16.16201855 10.54940303 8.662311013 13.87415811 9.953881414 13.45731439 16.38102028 8.031509898 15.04389651 24.93893615 26.16128085 19.59722658 13.24903804 11.71539707 13.53636755 17.22290005 18.82828296 7.63856443 12.39385729 13.39879327 10.90695462 20.43530049 13.85424103 10.12430535 12.30901011 10.68267685 18.17481666 13.6455429 8.293191638 15.48548613 13.13829908 5.165947023 14.16079 7.686606567 15.84446181 14.35449417 19.20850347 8.592434347 13.64796282 5.985492502 11.59232165 7.611839599 5.730280063 10.8538071 10.3257791 3.745127595 8.832104486 15.89283095 10.92540952 12.3806472 12.81077899 18.46291621 15.37330663 14.94089764 8.803524171 8.407980358 11.93612717 6.732044502 5.083866982 11.32737544 13.22646389 10.3614717 24.87354175 17.6590915 11.18118681 8.159995546 10.96346593 21.45471171 13.61758714 10.76204676 13.50971361 8.859111182 4.810963284 7.222062831 13.16355922 11.70148635 20.42865622 13.5356216 17.35043175 8.814912113 8.150653972 4.509165267 5.552187288 12.97798644 20.00705654 8.00470952 10.43162045 13.16061471 12.61937991 11.06433482 27.25073699 21.52164253 17.0676557 11.38675693 7.547566198 12.16023988 9.994669174 6.204025092 10.82881846 9.987451096 14.33804186 5.786691871 | |||||||||||||||||||||||||||||||||||||||
Tables (Output of Computation) | |||||||||||||||||||||||||||||||||||||||
| |||||||||||||||||||||||||||||||||||||||
Figures (Output of Computation) | |||||||||||||||||||||||||||||||||||||||
Input Parameters & R Code | |||||||||||||||||||||||||||||||||||||||
| Parameters (Session): | |||||||||||||||||||||||||||||||||||||||
| par1 = 8 ; par2 = 0 ; | |||||||||||||||||||||||||||||||||||||||
| Parameters (R input): | |||||||||||||||||||||||||||||||||||||||
| par1 = 8 ; par2 = 0 ; | |||||||||||||||||||||||||||||||||||||||
| R code (references can be found in the software module): | |||||||||||||||||||||||||||||||||||||||
par2 <- '0' | |||||||||||||||||||||||||||||||||||||||