\begin{tabular}{lllllllll}
\hline
Summary of computational transaction \tabularnewline
Raw Input & view raw input (R code)  \tabularnewline
Raw Output & view raw output of R engine  \tabularnewline
Computing time & 1 seconds \tabularnewline
R Server & 'Gertrude Mary Cox' @ cox.wessa.net \tabularnewline
\hline
\end{tabular}
%Source: https://freestatistics.org/blog/index.php?pk=280804&T=0
[TABLE]
[ROW][C]Summary of computational transaction[/C][/ROW]
[ROW][C]Raw Input[/C][C]view raw input (R code) [/C][/ROW]
[ROW][C]Raw Output[/C][C]view raw output of R engine [/C][/ROW]
[ROW][C]Computing time[/C][C]1 seconds[/C][/ROW]
[ROW][C]R Server[/C][C]'Gertrude Mary Cox' @ cox.wessa.net[/C][/ROW]
[/TABLE]
Source: https://freestatistics.org/blog/index.php?pk=280804&T=0
If you paste this QR Code into your document, anyone with a smartphone or tablet will be able to scan it and view this table in a browser.
If you paste this QR Code into your document, anyone with a smartphone or tablet will be able to scan it and view this table in a browser.
If you paste this QR Code into your document, anyone with a smartphone or tablet will be able to scan it and view this table in a browser.
If you paste this QR Code into your document, anyone with a smartphone or tablet will be able to scan it and view this table in a browser.
If you paste this QR Code into your document, anyone with a smartphone or tablet will be able to scan it and view this table in a browser.
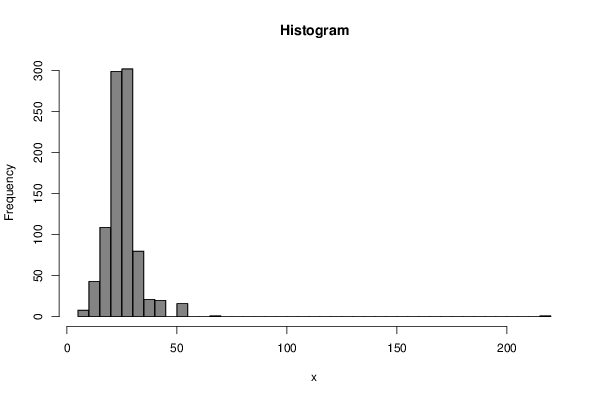
| Frequency Table (Histogram) | | Bins | Midpoint | Abs. Frequency | Rel. Frequency | Cumul. Rel. Freq. | Density | | [5,10[ | 7.5 | 8 | 0.008889 | 0.008889 | 0.001778 | | [10,15[ | 12.5 | 43 | 0.047778 | 0.056667 | 0.009556 | | [15,20[ | 17.5 | 109 | 0.121111 | 0.177778 | 0.024222 | | [20,25[ | 22.5 | 299 | 0.332222 | 0.51 | 0.066444 | | [25,30[ | 27.5 | 302 | 0.335556 | 0.845556 | 0.067111 | | [30,35[ | 32.5 | 80 | 0.088889 | 0.934444 | 0.017778 | | [35,40[ | 37.5 | 21 | 0.023333 | 0.957778 | 0.004667 | | [40,45[ | 42.5 | 20 | 0.022222 | 0.98 | 0.004444 | | [45,50[ | 47.5 | 0 | 0 | 0.98 | 0 | | [50,55[ | 52.5 | 16 | 0.017778 | 0.997778 | 0.003556 | | [55,60[ | 57.5 | 0 | 0 | 0.997778 | 0 | | [60,65[ | 62.5 | 0 | 0 | 0.997778 | 0 | | [65,70[ | 67.5 | 1 | 0.001111 | 0.998889 | 0.000222 | | [70,75[ | 72.5 | 0 | 0 | 0.998889 | 0 | | [75,80[ | 77.5 | 0 | 0 | 0.998889 | 0 | | [80,85[ | 82.5 | 0 | 0 | 0.998889 | 0 | | [85,90[ | 87.5 | 0 | 0 | 0.998889 | 0 | | [90,95[ | 92.5 | 0 | 0 | 0.998889 | 0 | | [95,100[ | 97.5 | 0 | 0 | 0.998889 | 0 | | [100,105[ | 102.5 | 0 | 0 | 0.998889 | 0 | | [105,110[ | 107.5 | 0 | 0 | 0.998889 | 0 | | [110,115[ | 112.5 | 0 | 0 | 0.998889 | 0 | | [115,120[ | 117.5 | 0 | 0 | 0.998889 | 0 | | [120,125[ | 122.5 | 0 | 0 | 0.998889 | 0 | | [125,130[ | 127.5 | 0 | 0 | 0.998889 | 0 | | [130,135[ | 132.5 | 0 | 0 | 0.998889 | 0 | | [135,140[ | 137.5 | 0 | 0 | 0.998889 | 0 | | [140,145[ | 142.5 | 0 | 0 | 0.998889 | 0 | | [145,150[ | 147.5 | 0 | 0 | 0.998889 | 0 | | [150,155[ | 152.5 | 0 | 0 | 0.998889 | 0 | | [155,160[ | 157.5 | 0 | 0 | 0.998889 | 0 | | [160,165[ | 162.5 | 0 | 0 | 0.998889 | 0 | | [165,170[ | 167.5 | 0 | 0 | 0.998889 | 0 | | [170,175[ | 172.5 | 0 | 0 | 0.998889 | 0 | | [175,180[ | 177.5 | 0 | 0 | 0.998889 | 0 | | [180,185[ | 182.5 | 0 | 0 | 0.998889 | 0 | | [185,190[ | 187.5 | 0 | 0 | 0.998889 | 0 | | [190,195[ | 192.5 | 0 | 0 | 0.998889 | 0 | | [195,200[ | 197.5 | 0 | 0 | 0.998889 | 0 | | [200,205[ | 202.5 | 0 | 0 | 0.998889 | 0 | | [205,210[ | 207.5 | 0 | 0 | 0.998889 | 0 | | [210,215[ | 212.5 | 0 | 0 | 0.998889 | 0 | | [215,220] | 217.5 | 1 | 0.001111 | 1 | 0.000222 |
\begin{tabular}{lllllllll}
\hline
Frequency Table (Histogram) \tabularnewline
Bins & Midpoint & Abs. Frequency & Rel. Frequency & Cumul. Rel. Freq. & Density \tabularnewline
[5,10[ & 7.5 & 8 & 0.008889 & 0.008889 & 0.001778 \tabularnewline
[10,15[ & 12.5 & 43 & 0.047778 & 0.056667 & 0.009556 \tabularnewline
[15,20[ & 17.5 & 109 & 0.121111 & 0.177778 & 0.024222 \tabularnewline
[20,25[ & 22.5 & 299 & 0.332222 & 0.51 & 0.066444 \tabularnewline
[25,30[ & 27.5 & 302 & 0.335556 & 0.845556 & 0.067111 \tabularnewline
[30,35[ & 32.5 & 80 & 0.088889 & 0.934444 & 0.017778 \tabularnewline
[35,40[ & 37.5 & 21 & 0.023333 & 0.957778 & 0.004667 \tabularnewline
[40,45[ & 42.5 & 20 & 0.022222 & 0.98 & 0.004444 \tabularnewline
[45,50[ & 47.5 & 0 & 0 & 0.98 & 0 \tabularnewline
[50,55[ & 52.5 & 16 & 0.017778 & 0.997778 & 0.003556 \tabularnewline
[55,60[ & 57.5 & 0 & 0 & 0.997778 & 0 \tabularnewline
[60,65[ & 62.5 & 0 & 0 & 0.997778 & 0 \tabularnewline
[65,70[ & 67.5 & 1 & 0.001111 & 0.998889 & 0.000222 \tabularnewline
[70,75[ & 72.5 & 0 & 0 & 0.998889 & 0 \tabularnewline
[75,80[ & 77.5 & 0 & 0 & 0.998889 & 0 \tabularnewline
[80,85[ & 82.5 & 0 & 0 & 0.998889 & 0 \tabularnewline
[85,90[ & 87.5 & 0 & 0 & 0.998889 & 0 \tabularnewline
[90,95[ & 92.5 & 0 & 0 & 0.998889 & 0 \tabularnewline
[95,100[ & 97.5 & 0 & 0 & 0.998889 & 0 \tabularnewline
[100,105[ & 102.5 & 0 & 0 & 0.998889 & 0 \tabularnewline
[105,110[ & 107.5 & 0 & 0 & 0.998889 & 0 \tabularnewline
[110,115[ & 112.5 & 0 & 0 & 0.998889 & 0 \tabularnewline
[115,120[ & 117.5 & 0 & 0 & 0.998889 & 0 \tabularnewline
[120,125[ & 122.5 & 0 & 0 & 0.998889 & 0 \tabularnewline
[125,130[ & 127.5 & 0 & 0 & 0.998889 & 0 \tabularnewline
[130,135[ & 132.5 & 0 & 0 & 0.998889 & 0 \tabularnewline
[135,140[ & 137.5 & 0 & 0 & 0.998889 & 0 \tabularnewline
[140,145[ & 142.5 & 0 & 0 & 0.998889 & 0 \tabularnewline
[145,150[ & 147.5 & 0 & 0 & 0.998889 & 0 \tabularnewline
[150,155[ & 152.5 & 0 & 0 & 0.998889 & 0 \tabularnewline
[155,160[ & 157.5 & 0 & 0 & 0.998889 & 0 \tabularnewline
[160,165[ & 162.5 & 0 & 0 & 0.998889 & 0 \tabularnewline
[165,170[ & 167.5 & 0 & 0 & 0.998889 & 0 \tabularnewline
[170,175[ & 172.5 & 0 & 0 & 0.998889 & 0 \tabularnewline
[175,180[ & 177.5 & 0 & 0 & 0.998889 & 0 \tabularnewline
[180,185[ & 182.5 & 0 & 0 & 0.998889 & 0 \tabularnewline
[185,190[ & 187.5 & 0 & 0 & 0.998889 & 0 \tabularnewline
[190,195[ & 192.5 & 0 & 0 & 0.998889 & 0 \tabularnewline
[195,200[ & 197.5 & 0 & 0 & 0.998889 & 0 \tabularnewline
[200,205[ & 202.5 & 0 & 0 & 0.998889 & 0 \tabularnewline
[205,210[ & 207.5 & 0 & 0 & 0.998889 & 0 \tabularnewline
[210,215[ & 212.5 & 0 & 0 & 0.998889 & 0 \tabularnewline
[215,220] & 217.5 & 1 & 0.001111 & 1 & 0.000222 \tabularnewline
\hline
\end{tabular}
%Source: https://freestatistics.org/blog/index.php?pk=280804&T=1
[TABLE]
[ROW][C]Frequency Table (Histogram)[/C][/ROW]
[ROW][C]Bins[/C][C]Midpoint[/C][C]Abs. Frequency[/C][C]Rel. Frequency[/C][C]Cumul. Rel. Freq.[/C][C]Density[/C][/ROW]
[ROW][C][5,10[[/C][C]7.5[/C][C]8[/C][C]0.008889[/C][C]0.008889[/C][C]0.001778[/C][/ROW]
[ROW][C][10,15[[/C][C]12.5[/C][C]43[/C][C]0.047778[/C][C]0.056667[/C][C]0.009556[/C][/ROW]
[ROW][C][15,20[[/C][C]17.5[/C][C]109[/C][C]0.121111[/C][C]0.177778[/C][C]0.024222[/C][/ROW]
[ROW][C][20,25[[/C][C]22.5[/C][C]299[/C][C]0.332222[/C][C]0.51[/C][C]0.066444[/C][/ROW]
[ROW][C][25,30[[/C][C]27.5[/C][C]302[/C][C]0.335556[/C][C]0.845556[/C][C]0.067111[/C][/ROW]
[ROW][C][30,35[[/C][C]32.5[/C][C]80[/C][C]0.088889[/C][C]0.934444[/C][C]0.017778[/C][/ROW]
[ROW][C][35,40[[/C][C]37.5[/C][C]21[/C][C]0.023333[/C][C]0.957778[/C][C]0.004667[/C][/ROW]
[ROW][C][40,45[[/C][C]42.5[/C][C]20[/C][C]0.022222[/C][C]0.98[/C][C]0.004444[/C][/ROW]
[ROW][C][45,50[[/C][C]47.5[/C][C]0[/C][C]0[/C][C]0.98[/C][C]0[/C][/ROW]
[ROW][C][50,55[[/C][C]52.5[/C][C]16[/C][C]0.017778[/C][C]0.997778[/C][C]0.003556[/C][/ROW]
[ROW][C][55,60[[/C][C]57.5[/C][C]0[/C][C]0[/C][C]0.997778[/C][C]0[/C][/ROW]
[ROW][C][60,65[[/C][C]62.5[/C][C]0[/C][C]0[/C][C]0.997778[/C][C]0[/C][/ROW]
[ROW][C][65,70[[/C][C]67.5[/C][C]1[/C][C]0.001111[/C][C]0.998889[/C][C]0.000222[/C][/ROW]
[ROW][C][70,75[[/C][C]72.5[/C][C]0[/C][C]0[/C][C]0.998889[/C][C]0[/C][/ROW]
[ROW][C][75,80[[/C][C]77.5[/C][C]0[/C][C]0[/C][C]0.998889[/C][C]0[/C][/ROW]
[ROW][C][80,85[[/C][C]82.5[/C][C]0[/C][C]0[/C][C]0.998889[/C][C]0[/C][/ROW]
[ROW][C][85,90[[/C][C]87.5[/C][C]0[/C][C]0[/C][C]0.998889[/C][C]0[/C][/ROW]
[ROW][C][90,95[[/C][C]92.5[/C][C]0[/C][C]0[/C][C]0.998889[/C][C]0[/C][/ROW]
[ROW][C][95,100[[/C][C]97.5[/C][C]0[/C][C]0[/C][C]0.998889[/C][C]0[/C][/ROW]
[ROW][C][100,105[[/C][C]102.5[/C][C]0[/C][C]0[/C][C]0.998889[/C][C]0[/C][/ROW]
[ROW][C][105,110[[/C][C]107.5[/C][C]0[/C][C]0[/C][C]0.998889[/C][C]0[/C][/ROW]
[ROW][C][110,115[[/C][C]112.5[/C][C]0[/C][C]0[/C][C]0.998889[/C][C]0[/C][/ROW]
[ROW][C][115,120[[/C][C]117.5[/C][C]0[/C][C]0[/C][C]0.998889[/C][C]0[/C][/ROW]
[ROW][C][120,125[[/C][C]122.5[/C][C]0[/C][C]0[/C][C]0.998889[/C][C]0[/C][/ROW]
[ROW][C][125,130[[/C][C]127.5[/C][C]0[/C][C]0[/C][C]0.998889[/C][C]0[/C][/ROW]
[ROW][C][130,135[[/C][C]132.5[/C][C]0[/C][C]0[/C][C]0.998889[/C][C]0[/C][/ROW]
[ROW][C][135,140[[/C][C]137.5[/C][C]0[/C][C]0[/C][C]0.998889[/C][C]0[/C][/ROW]
[ROW][C][140,145[[/C][C]142.5[/C][C]0[/C][C]0[/C][C]0.998889[/C][C]0[/C][/ROW]
[ROW][C][145,150[[/C][C]147.5[/C][C]0[/C][C]0[/C][C]0.998889[/C][C]0[/C][/ROW]
[ROW][C][150,155[[/C][C]152.5[/C][C]0[/C][C]0[/C][C]0.998889[/C][C]0[/C][/ROW]
[ROW][C][155,160[[/C][C]157.5[/C][C]0[/C][C]0[/C][C]0.998889[/C][C]0[/C][/ROW]
[ROW][C][160,165[[/C][C]162.5[/C][C]0[/C][C]0[/C][C]0.998889[/C][C]0[/C][/ROW]
[ROW][C][165,170[[/C][C]167.5[/C][C]0[/C][C]0[/C][C]0.998889[/C][C]0[/C][/ROW]
[ROW][C][170,175[[/C][C]172.5[/C][C]0[/C][C]0[/C][C]0.998889[/C][C]0[/C][/ROW]
[ROW][C][175,180[[/C][C]177.5[/C][C]0[/C][C]0[/C][C]0.998889[/C][C]0[/C][/ROW]
[ROW][C][180,185[[/C][C]182.5[/C][C]0[/C][C]0[/C][C]0.998889[/C][C]0[/C][/ROW]
[ROW][C][185,190[[/C][C]187.5[/C][C]0[/C][C]0[/C][C]0.998889[/C][C]0[/C][/ROW]
[ROW][C][190,195[[/C][C]192.5[/C][C]0[/C][C]0[/C][C]0.998889[/C][C]0[/C][/ROW]
[ROW][C][195,200[[/C][C]197.5[/C][C]0[/C][C]0[/C][C]0.998889[/C][C]0[/C][/ROW]
[ROW][C][200,205[[/C][C]202.5[/C][C]0[/C][C]0[/C][C]0.998889[/C][C]0[/C][/ROW]
[ROW][C][205,210[[/C][C]207.5[/C][C]0[/C][C]0[/C][C]0.998889[/C][C]0[/C][/ROW]
[ROW][C][210,215[[/C][C]212.5[/C][C]0[/C][C]0[/C][C]0.998889[/C][C]0[/C][/ROW]
[ROW][C][215,220][/C][C]217.5[/C][C]1[/C][C]0.001111[/C][C]1[/C][C]0.000222[/C][/ROW]
[/TABLE]
Source: https://freestatistics.org/blog/index.php?pk=280804&T=1
Globally Unique Identifier (entire table): ba.freestatistics.org/blog/index.php?pk=280804&T=1
As an alternative you can also use a QR Code:
The GUIDs for individual cells are displayed in the table below:
| Frequency Table (Histogram) | | Bins | Midpoint | Abs. Frequency | Rel. Frequency | Cumul. Rel. Freq. | Density | | [5,10[ | 7.5 | 8 | 0.008889 | 0.008889 | 0.001778 | | [10,15[ | 12.5 | 43 | 0.047778 | 0.056667 | 0.009556 | | [15,20[ | 17.5 | 109 | 0.121111 | 0.177778 | 0.024222 | | [20,25[ | 22.5 | 299 | 0.332222 | 0.51 | 0.066444 | | [25,30[ | 27.5 | 302 | 0.335556 | 0.845556 | 0.067111 | | [30,35[ | 32.5 | 80 | 0.088889 | 0.934444 | 0.017778 | | [35,40[ | 37.5 | 21 | 0.023333 | 0.957778 | 0.004667 | | [40,45[ | 42.5 | 20 | 0.022222 | 0.98 | 0.004444 | | [45,50[ | 47.5 | 0 | 0 | 0.98 | 0 | | [50,55[ | 52.5 | 16 | 0.017778 | 0.997778 | 0.003556 | | [55,60[ | 57.5 | 0 | 0 | 0.997778 | 0 | | [60,65[ | 62.5 | 0 | 0 | 0.997778 | 0 | | [65,70[ | 67.5 | 1 | 0.001111 | 0.998889 | 0.000222 | | [70,75[ | 72.5 | 0 | 0 | 0.998889 | 0 | | [75,80[ | 77.5 | 0 | 0 | 0.998889 | 0 | | [80,85[ | 82.5 | 0 | 0 | 0.998889 | 0 | | [85,90[ | 87.5 | 0 | 0 | 0.998889 | 0 | | [90,95[ | 92.5 | 0 | 0 | 0.998889 | 0 | | [95,100[ | 97.5 | 0 | 0 | 0.998889 | 0 | | [100,105[ | 102.5 | 0 | 0 | 0.998889 | 0 | | [105,110[ | 107.5 | 0 | 0 | 0.998889 | 0 | | [110,115[ | 112.5 | 0 | 0 | 0.998889 | 0 | | [115,120[ | 117.5 | 0 | 0 | 0.998889 | 0 | | [120,125[ | 122.5 | 0 | 0 | 0.998889 | 0 | | [125,130[ | 127.5 | 0 | 0 | 0.998889 | 0 | | [130,135[ | 132.5 | 0 | 0 | 0.998889 | 0 | | [135,140[ | 137.5 | 0 | 0 | 0.998889 | 0 | | [140,145[ | 142.5 | 0 | 0 | 0.998889 | 0 | | [145,150[ | 147.5 | 0 | 0 | 0.998889 | 0 | | [150,155[ | 152.5 | 0 | 0 | 0.998889 | 0 | | [155,160[ | 157.5 | 0 | 0 | 0.998889 | 0 | | [160,165[ | 162.5 | 0 | 0 | 0.998889 | 0 | | [165,170[ | 167.5 | 0 | 0 | 0.998889 | 0 | | [170,175[ | 172.5 | 0 | 0 | 0.998889 | 0 | | [175,180[ | 177.5 | 0 | 0 | 0.998889 | 0 | | [180,185[ | 182.5 | 0 | 0 | 0.998889 | 0 | | [185,190[ | 187.5 | 0 | 0 | 0.998889 | 0 | | [190,195[ | 192.5 | 0 | 0 | 0.998889 | 0 | | [195,200[ | 197.5 | 0 | 0 | 0.998889 | 0 | | [200,205[ | 202.5 | 0 | 0 | 0.998889 | 0 | | [205,210[ | 207.5 | 0 | 0 | 0.998889 | 0 | | [210,215[ | 212.5 | 0 | 0 | 0.998889 | 0 | | [215,220] | 217.5 | 1 | 0.001111 | 1 | 0.000222 |
If you paste this QR Code into your document, anyone with a smartphone or tablet will be able to scan it and view this table in a browser.
If you paste this QR Code into your document, anyone with a smartphone or tablet will be able to scan it and view this table in a browser.
If you paste this QR Code into your document, anyone with a smartphone or tablet will be able to scan it and view this table in a browser.
If you paste this QR Code into your document, anyone with a smartphone or tablet will be able to scan it and view this table in a browser.
If you paste this QR Code into your document, anyone with a smartphone or tablet will be able to scan it and view this table in a browser.
|