Free Statistics
of Irreproducible Research!
Description of Statistical Computation | |||||||||||||||||||||||||||||||||||||||||
|---|---|---|---|---|---|---|---|---|---|---|---|---|---|---|---|---|---|---|---|---|---|---|---|---|---|---|---|---|---|---|---|---|---|---|---|---|---|---|---|---|---|
| Author's title | |||||||||||||||||||||||||||||||||||||||||
| Author | *Unverified author* | ||||||||||||||||||||||||||||||||||||||||
| R Software Module | rwasp_univariatedataseries.wasp | ||||||||||||||||||||||||||||||||||||||||
| Title produced by software | Univariate Data Series | ||||||||||||||||||||||||||||||||||||||||
| Date of computation | Fri, 02 Oct 2015 14:17:17 +0100 | ||||||||||||||||||||||||||||||||||||||||
| Cite this page as follows | Statistical Computations at FreeStatistics.org, Office for Research Development and Education, URL https://freestatistics.org/blog/index.php?v=date/2015/Oct/02/t1443791857106pk2y3jp7u2v7.htm/, Retrieved Tue, 14 May 2024 14:27:38 +0000 | ||||||||||||||||||||||||||||||||||||||||
| Statistical Computations at FreeStatistics.org, Office for Research Development and Education, URL https://freestatistics.org/blog/index.php?pk=281104, Retrieved Tue, 14 May 2024 14:27:38 +0000 | |||||||||||||||||||||||||||||||||||||||||
| QR Codes: | |||||||||||||||||||||||||||||||||||||||||
|
| |||||||||||||||||||||||||||||||||||||||||
| Original text written by user: | |||||||||||||||||||||||||||||||||||||||||
| IsPrivate? | No (this computation is public) | ||||||||||||||||||||||||||||||||||||||||
| User-defined keywords | |||||||||||||||||||||||||||||||||||||||||
| Estimated Impact | 75 | ||||||||||||||||||||||||||||||||||||||||
Tree of Dependent Computations | |||||||||||||||||||||||||||||||||||||||||
| Family? (F = Feedback message, R = changed R code, M = changed R Module, P = changed Parameters, D = changed Data) | |||||||||||||||||||||||||||||||||||||||||
| - [Univariate Data Series] [Consumptieprijsin...] [2015-10-02 12:00:01] [9a9e8da277f220390e943650176db0bb] - R PD [Univariate Data Series] [Consumptieprijsin...] [2015-10-02 12:21:50] [9a9e8da277f220390e943650176db0bb] - P [Univariate Data Series] [Consumptieprijsin...] [2015-10-02 13:17:17] [25948359fd1b125334369436fee15348] [Current] | |||||||||||||||||||||||||||||||||||||||||
| Feedback Forum | |||||||||||||||||||||||||||||||||||||||||
Post a new message | |||||||||||||||||||||||||||||||||||||||||
Dataset | |||||||||||||||||||||||||||||||||||||||||
| Dataseries X: | |||||||||||||||||||||||||||||||||||||||||
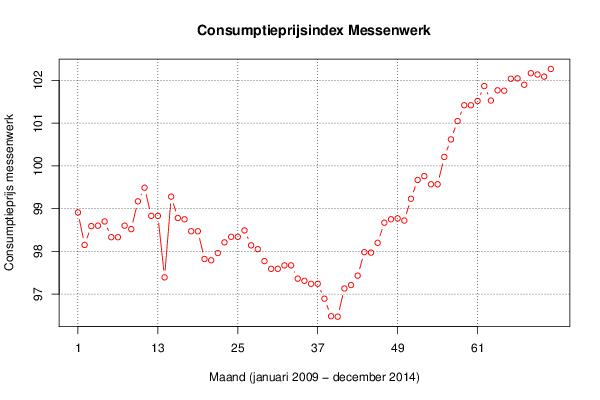
98.91 98.15 98.59 98.6 98.7 98.33 98.33 98.6 98.52 99.17 99.49 98.83 98.83 97.39 99.28 98.78 98.75 98.47 98.47 97.82 97.79 97.96 98.21 98.34 98.34 98.49 98.14 98.05 97.77 97.59 97.59 97.67 97.67 97.36 97.31 97.24 97.24 96.89 96.48 96.47 97.13 97.21 97.43 97.98 97.97 98.2 98.67 98.75 98.77 98.72 99.23 99.67 99.76 99.57 99.57 100.21 100.62 101.05 101.42 101.42 101.52 101.87 101.53 101.77 101.76 102.04 102.05 101.9 102.17 102.14 102.09 102.27 | |||||||||||||||||||||||||||||||||||||||||
Tables (Output of Computation) | |||||||||||||||||||||||||||||||||||||||||
| |||||||||||||||||||||||||||||||||||||||||
Figures (Output of Computation) | |||||||||||||||||||||||||||||||||||||||||
Input Parameters & R Code | |||||||||||||||||||||||||||||||||||||||||
| Parameters (Session): | |||||||||||||||||||||||||||||||||||||||||
| par1 = Consumptieprijsindex Messenwerk ; par2 = nbb ; par3 = Prijsschommeling van messenwerk van begin 2009 tot en met einde 2014 ; par4 = 12 ; | |||||||||||||||||||||||||||||||||||||||||
| Parameters (R input): | |||||||||||||||||||||||||||||||||||||||||
| par1 = Consumptieprijsindex Messenwerk ; par2 = nbb ; par3 = Prijsschommeling van messenwerk van begin 2009 tot en met einde 2014 ; par4 = 12 ; | |||||||||||||||||||||||||||||||||||||||||
| R code (references can be found in the software module): | |||||||||||||||||||||||||||||||||||||||||
if (par4 != 'No season') { | |||||||||||||||||||||||||||||||||||||||||