Free Statistics
of Irreproducible Research!
Description of Statistical Computation | |||||||||||||||||||||||||||||||||||||||||
|---|---|---|---|---|---|---|---|---|---|---|---|---|---|---|---|---|---|---|---|---|---|---|---|---|---|---|---|---|---|---|---|---|---|---|---|---|---|---|---|---|---|
| Author's title | |||||||||||||||||||||||||||||||||||||||||
| Author | *Unverified author* | ||||||||||||||||||||||||||||||||||||||||
| R Software Module | rwasp_univariatedataseries.wasp | ||||||||||||||||||||||||||||||||||||||||
| Title produced by software | Univariate Data Series | ||||||||||||||||||||||||||||||||||||||||
| Date of computation | Fri, 02 Oct 2015 14:56:12 +0100 | ||||||||||||||||||||||||||||||||||||||||
| Cite this page as follows | Statistical Computations at FreeStatistics.org, Office for Research Development and Education, URL https://freestatistics.org/blog/index.php?v=date/2015/Oct/02/t14437943427ofqw7o2p0vxyd6.htm/, Retrieved Tue, 14 May 2024 07:13:48 +0000 | ||||||||||||||||||||||||||||||||||||||||
| Statistical Computations at FreeStatistics.org, Office for Research Development and Education, URL https://freestatistics.org/blog/index.php?pk=281113, Retrieved Tue, 14 May 2024 07:13:48 +0000 | |||||||||||||||||||||||||||||||||||||||||
| QR Codes: | |||||||||||||||||||||||||||||||||||||||||
|
| |||||||||||||||||||||||||||||||||||||||||
| Original text written by user: | |||||||||||||||||||||||||||||||||||||||||
| IsPrivate? | No (this computation is public) | ||||||||||||||||||||||||||||||||||||||||
| User-defined keywords | |||||||||||||||||||||||||||||||||||||||||
| Estimated Impact | 58 | ||||||||||||||||||||||||||||||||||||||||
Tree of Dependent Computations | |||||||||||||||||||||||||||||||||||||||||
| Family? (F = Feedback message, R = changed R code, M = changed R Module, P = changed Parameters, D = changed Data) | |||||||||||||||||||||||||||||||||||||||||
| - [Univariate Data Series] [] [2015-10-02 13:56:12] [45f7fcffe569af381f5269bedb4e9f14] [Current] - RMP [Histogram] [] [2015-10-02 15:23:02] [aedbd10380ada0b74299befa64490024] - RMP [Kernel Density Estimation] [] [2015-10-02 15:32:25] [aedbd10380ada0b74299befa64490024] | |||||||||||||||||||||||||||||||||||||||||
| Feedback Forum | |||||||||||||||||||||||||||||||||||||||||
Post a new message | |||||||||||||||||||||||||||||||||||||||||
Dataset | |||||||||||||||||||||||||||||||||||||||||
| Dataseries X: | |||||||||||||||||||||||||||||||||||||||||
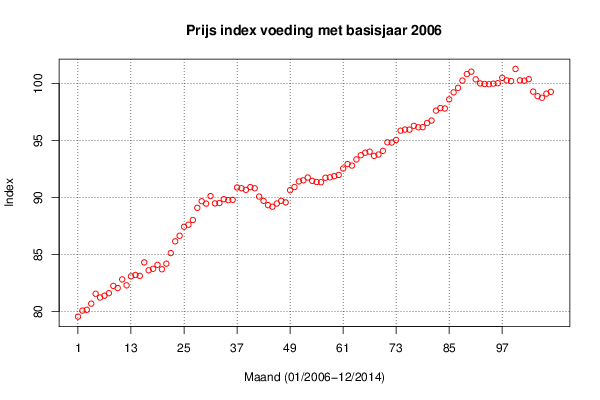
79.55 80.08 80.15 80.69 81.56 81.23 81.39 81.61 82.25 82.06 82.82 82.3 83.09 83.21 83.13 84.31 83.62 83.75 84.1 83.71 84.2 85.13 86.16 86.65 87.44 87.62 88.03 89.1 89.68 89.47 90.13 89.49 89.52 89.86 89.77 89.8 90.89 90.82 90.68 90.92 90.82 90.09 89.71 89.34 89.2 89.48 89.72 89.58 90.65 90.93 91.42 91.52 91.76 91.47 91.37 91.35 91.74 91.78 91.88 91.99 92.55 92.94 92.81 93.35 93.72 93.94 94.03 93.66 93.78 94.1 94.85 94.83 95.06 95.87 95.97 95.96 96.3 96.17 96.18 96.55 96.76 97.63 97.86 97.82 98.62 99.24 99.63 100.27 100.84 101.05 100.38 100.02 99.97 99.95 100 100.04 100.51 100.29 100.22 101.29 100.29 100.26 100.39 99.3 98.9 98.76 99.12 99.28 | |||||||||||||||||||||||||||||||||||||||||
Tables (Output of Computation) | |||||||||||||||||||||||||||||||||||||||||
| |||||||||||||||||||||||||||||||||||||||||
Figures (Output of Computation) | |||||||||||||||||||||||||||||||||||||||||
Input Parameters & R Code | |||||||||||||||||||||||||||||||||||||||||
| Parameters (Session): | |||||||||||||||||||||||||||||||||||||||||
| par1 = Consumptieprijs index van voeding ; par2 = nbb ; par3 = De grafiek laat zien hoe de prijs indexen evolueren over de verschillende maanden en jaren ; par4 = 12 ; | |||||||||||||||||||||||||||||||||||||||||
| Parameters (R input): | |||||||||||||||||||||||||||||||||||||||||
| par1 = Consumptieprijs index van voeding ; par2 = nbb ; par3 = De grafiek laat zien hoe de prijs indexen evolueren over de verschillende maanden en jaren ; par4 = 12 ; | |||||||||||||||||||||||||||||||||||||||||
| R code (references can be found in the software module): | |||||||||||||||||||||||||||||||||||||||||
par4 <- '12' | |||||||||||||||||||||||||||||||||||||||||