Free Statistics
of Irreproducible Research!
Description of Statistical Computation | |||||||||||||||||||||||||||||||||||||||||
|---|---|---|---|---|---|---|---|---|---|---|---|---|---|---|---|---|---|---|---|---|---|---|---|---|---|---|---|---|---|---|---|---|---|---|---|---|---|---|---|---|---|
| Author's title | |||||||||||||||||||||||||||||||||||||||||
| Author | *Unverified author* | ||||||||||||||||||||||||||||||||||||||||
| R Software Module | rwasp_univariatedataseries.wasp | ||||||||||||||||||||||||||||||||||||||||
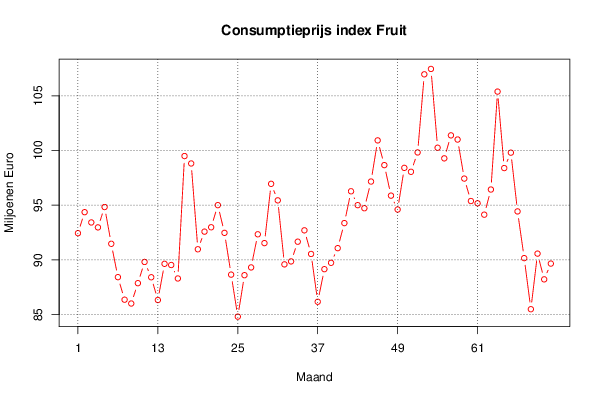
| Title produced by software | Univariate Data Series | ||||||||||||||||||||||||||||||||||||||||
| Date of computation | Fri, 02 Oct 2015 21:20:26 +0100 | ||||||||||||||||||||||||||||||||||||||||
| Cite this page as follows | Statistical Computations at FreeStatistics.org, Office for Research Development and Education, URL https://freestatistics.org/blog/index.php?v=date/2015/Oct/02/t14438174018mqu29wknurbatp.htm/, Retrieved Tue, 14 May 2024 08:03:21 +0000 | ||||||||||||||||||||||||||||||||||||||||
| Statistical Computations at FreeStatistics.org, Office for Research Development and Education, URL https://freestatistics.org/blog/index.php?pk=281200, Retrieved Tue, 14 May 2024 08:03:21 +0000 | |||||||||||||||||||||||||||||||||||||||||
| QR Codes: | |||||||||||||||||||||||||||||||||||||||||
|
| |||||||||||||||||||||||||||||||||||||||||
| Original text written by user: | |||||||||||||||||||||||||||||||||||||||||
| IsPrivate? | No (this computation is public) | ||||||||||||||||||||||||||||||||||||||||
| User-defined keywords | |||||||||||||||||||||||||||||||||||||||||
| Estimated Impact | 112 | ||||||||||||||||||||||||||||||||||||||||
Tree of Dependent Computations | |||||||||||||||||||||||||||||||||||||||||
| Family? (F = Feedback message, R = changed R code, M = changed R Module, P = changed Parameters, D = changed Data) | |||||||||||||||||||||||||||||||||||||||||
| - [Univariate Data Series] [] [2015-10-02 20:20:26] [7e1e09e1787c74b32ad6066a9a323b17] [Current] - RMP [Kernel Density Estimation] [] [2015-10-03 07:26:40] [102949d3707834b83d58a354234a805f] - RMP [Kernel Density Estimation] [] [2015-10-10 10:13:37] [102949d3707834b83d58a354234a805f] - RMPD [Notched Boxplots] [] [2015-10-10 10:37:04] [102949d3707834b83d58a354234a805f] - RMP [Notched Boxplots] [] [2015-10-10 10:46:38] [102949d3707834b83d58a354234a805f] - RMPD [Harrell-Davis Quantiles] [] [2015-10-10 11:42:42] [102949d3707834b83d58a354234a805f] - RMPD [Harrell-Davis Quantiles] [] [2015-10-10 11:47:19] [102949d3707834b83d58a354234a805f] - RMPD [Harrell-Davis Quantiles] [] [2015-10-10 11:50:09] [102949d3707834b83d58a354234a805f] - RMP [Harrell-Davis Quantiles] [] [2015-10-10 11:56:16] [102949d3707834b83d58a354234a805f] - RMP [Harrell-Davis Quantiles] [] [2015-10-10 11:58:53] [102949d3707834b83d58a354234a805f] - RMPD [Central Tendency] [] [2015-10-10 12:13:35] [102949d3707834b83d58a354234a805f] - RMPD [Mean versus Median] [] [2015-10-10 12:17:48] [102949d3707834b83d58a354234a805f] - RMP [Central Tendency] [] [2015-10-10 12:21:18] [102949d3707834b83d58a354234a805f] - RMP [Mean versus Median] [] [2015-10-10 12:24:19] [102949d3707834b83d58a354234a805f] - RMP [Mean Plot] [] [2015-10-16 07:49:41] [102949d3707834b83d58a354234a805f] - RMP [(Partial) Autocorrelation Function] [] [2015-10-23 18:42:46] [102949d3707834b83d58a354234a805f] - RMP [Mean Plot] [] [2015-10-23 18:45:20] [102949d3707834b83d58a354234a805f] - RMP [(Partial) Autocorrelation Function] [] [2015-10-23 18:47:59] [102949d3707834b83d58a354234a805f] | |||||||||||||||||||||||||||||||||||||||||
| Feedback Forum | |||||||||||||||||||||||||||||||||||||||||
Post a new message | |||||||||||||||||||||||||||||||||||||||||
Dataset | |||||||||||||||||||||||||||||||||||||||||
| Dataseries X: | |||||||||||||||||||||||||||||||||||||||||
92.44 94.36 93.42 92.97 94.83 91.47 88.42 86.36 86.01 87.87 89.81 88.41 86.33 89.64 89.53 88.3 99.49 98.81 90.97 92.58 92.98 95 92.47 88.65 84.81 88.6 89.31 92.34 91.53 96.95 95.44 89.59 89.86 91.66 92.7 90.54 86.17 89.15 89.73 91.07 93.36 96.27 95 94.72 97.16 100.92 98.66 95.87 94.6 98.41 98.05 99.82 106.96 107.45 100.25 99.28 101.38 101 97.43 95.38 95.17 94.13 96.43 105.38 98.39 99.8 94.43 90.16 85.49 90.57 88.22 89.66 | |||||||||||||||||||||||||||||||||||||||||
Tables (Output of Computation) | |||||||||||||||||||||||||||||||||||||||||
| |||||||||||||||||||||||||||||||||||||||||
Figures (Output of Computation) | |||||||||||||||||||||||||||||||||||||||||
Input Parameters & R Code | |||||||||||||||||||||||||||||||||||||||||
| Parameters (Session): | |||||||||||||||||||||||||||||||||||||||||
| par1 = Consumptieprijsindex fruit ; par2 = NBB stat ; par3 = Deze cijferreeks gaat over de consumptieprijsindex van fruit in Belgi� door de jaren heen ; par4 = 12 ; | |||||||||||||||||||||||||||||||||||||||||
| Parameters (R input): | |||||||||||||||||||||||||||||||||||||||||
| par1 = Consumptieprijsindex fruit ; par2 = NBB stat ; par3 = Deze cijferreeks gaat over de consumptieprijsindex van fruit in Belgi� door de jaren heen ; par4 = 12 ; | |||||||||||||||||||||||||||||||||||||||||
| R code (references can be found in the software module): | |||||||||||||||||||||||||||||||||||||||||
par4 <- '12' | |||||||||||||||||||||||||||||||||||||||||