Free Statistics
of Irreproducible Research!
Description of Statistical Computation | |||||||||||||||||||||||||||||||||||||||||
|---|---|---|---|---|---|---|---|---|---|---|---|---|---|---|---|---|---|---|---|---|---|---|---|---|---|---|---|---|---|---|---|---|---|---|---|---|---|---|---|---|---|
| Author's title | |||||||||||||||||||||||||||||||||||||||||
| Author | *Unverified author* | ||||||||||||||||||||||||||||||||||||||||
| R Software Module | rwasp_univariatedataseries.wasp | ||||||||||||||||||||||||||||||||||||||||
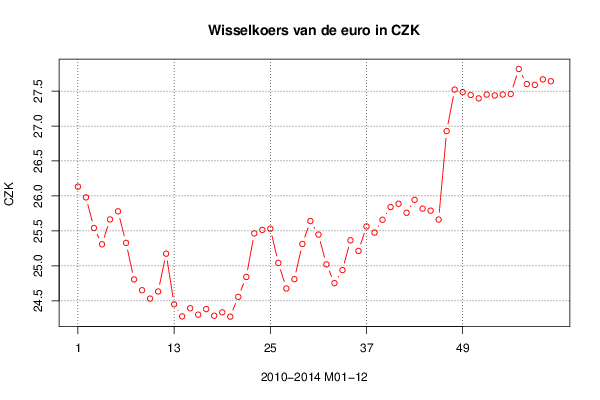
| Title produced by software | Univariate Data Series | ||||||||||||||||||||||||||||||||||||||||
| Date of computation | Fri, 09 Oct 2015 14:15:45 +0100 | ||||||||||||||||||||||||||||||||||||||||
| Cite this page as follows | Statistical Computations at FreeStatistics.org, Office for Research Development and Education, URL https://freestatistics.org/blog/index.php?v=date/2015/Oct/09/t1444396862rc2x0zhbi6pijvr.htm/, Retrieved Tue, 14 May 2024 18:54:12 +0000 | ||||||||||||||||||||||||||||||||||||||||
| Statistical Computations at FreeStatistics.org, Office for Research Development and Education, URL https://freestatistics.org/blog/index.php?pk=281896, Retrieved Tue, 14 May 2024 18:54:12 +0000 | |||||||||||||||||||||||||||||||||||||||||
| QR Codes: | |||||||||||||||||||||||||||||||||||||||||
|
| |||||||||||||||||||||||||||||||||||||||||
| Original text written by user: | |||||||||||||||||||||||||||||||||||||||||
| IsPrivate? | No (this computation is public) | ||||||||||||||||||||||||||||||||||||||||
| User-defined keywords | |||||||||||||||||||||||||||||||||||||||||
| Estimated Impact | 82 | ||||||||||||||||||||||||||||||||||||||||
Tree of Dependent Computations | |||||||||||||||||||||||||||||||||||||||||
| Family? (F = Feedback message, R = changed R code, M = changed R Module, P = changed Parameters, D = changed Data) | |||||||||||||||||||||||||||||||||||||||||
| - [Univariate Data Series] [Datareeks - Wisse...] [2015-10-09 13:15:45] [3f1a7081c5450f075552d8bc3f139f2c] [Current] - RMP [Histogram] [Histogram - Wisse...] [2015-10-09 17:25:20] [b78554c675fd79077ee7678381a14583] - RMP [Kernel Density Estimation] [Density - Wisselk...] [2015-10-09 17:27:49] [b78554c675fd79077ee7678381a14583] | |||||||||||||||||||||||||||||||||||||||||
| Feedback Forum | |||||||||||||||||||||||||||||||||||||||||
Post a new message | |||||||||||||||||||||||||||||||||||||||||
Dataset | |||||||||||||||||||||||||||||||||||||||||
| Dataseries X: | |||||||||||||||||||||||||||||||||||||||||
26.133 25.979 25.541 25.308 25.663 25.78 25.328 24.806 24.651 24.531 24.633 25.174 24.449 24.277 24.393 24.301 24.381 24.286 24.335 24.273 24.556 24.841 25.464 25.514 25.531 25.042 24.676 24.809 25.313 25.64 25.447 25.021 24.752 24.939 25.365 25.214 25.563 25.475 25.659 25.841 25.888 25.759 25.944 25.818 25.789 25.662 26.927 27.521 27.485 27.444 27.395 27.45 27.437 27.45 27.458 27.816 27.599 27.588 27.667 27.64 | |||||||||||||||||||||||||||||||||||||||||
Tables (Output of Computation) | |||||||||||||||||||||||||||||||||||||||||
| |||||||||||||||||||||||||||||||||||||||||
Figures (Output of Computation) | |||||||||||||||||||||||||||||||||||||||||
Input Parameters & R Code | |||||||||||||||||||||||||||||||||||||||||
| Parameters (Session): | |||||||||||||||||||||||||||||||||||||||||
| par1 = Wisselkoers van de euro in CZK ; par2 = http://stat.nbb.be/Index.aspx?DataSetCode=EXR&lang=nl# ; par3 = De wisselkoers van de euro in CZK van Januari 2010 tot December 2014 ; par4 = 12 ; | |||||||||||||||||||||||||||||||||||||||||
| Parameters (R input): | |||||||||||||||||||||||||||||||||||||||||
| par1 = Wisselkoers van de euro in CZK ; par2 = http://stat.nbb.be/Index.aspx?DataSetCode=EXR&lang=nl# ; par3 = De wisselkoers van de euro in CZK van Januari 2010 tot December 2014 ; par4 = 12 ; | |||||||||||||||||||||||||||||||||||||||||
| R code (references can be found in the software module): | |||||||||||||||||||||||||||||||||||||||||
par4 <- '12' | |||||||||||||||||||||||||||||||||||||||||