Free Statistics

of Irreproducible Research!

Author's title

Author*Unverified author*
R Software Modulerwasp_centraltendency.wasp
Title produced by softwareCentral Tendency
Date of computationSat, 10 Oct 2015 16:26:20 +0100
Cite this page as followsStatistical Computations at FreeStatistics.org, Office for Research Development and Education, URL https://freestatistics.org/blog/index.php?v=date/2015/Oct/10/t1444490813jcsy6dik02gqmd3.htm/, Retrieved Tue, 14 May 2024 14:55:19 +0000
Statistical Computations at FreeStatistics.org, Office for Research Development and Education, URL https://freestatistics.org/blog/index.php?pk=282213, Retrieved Tue, 14 May 2024 14:55:19 +0000
QR Codes:

Original text written by user:
IsPrivate?No (this computation is public)
User-defined keywords
Estimated Impact87
Family? (F = Feedback message, R = changed R code, M = changed R Module, P = changed Parameters, D = changed Data)
-       [Central Tendency] [Opdracht 5 centra...] [2015-10-10 15:26:20] [bcb0da8ff6be95621a49a67fe6a7b572] [Current]
Feedback Forum

Post a new message
Dataseries X:
2754542000
2899512000
2928886000
3011252000
2932895000
3069307000
2863923000
2585491000
2993900000
3023542000
2491370000
2341705000
2126472000
2196705000
2368313000
2285174000
2163877000
2299241000
2275643000
2163091000
2416149000
2434553000
2281937000
2440464000
2255745000
2389872000
2863148000
2623516000
2558136000
2898129000
2537720000
2543469000
2779739000
2884779000
2711624000
2817771000
2884477000
3058996000
3285298000
2879617000
3220416000
3144280000
2940811000
2986507000
3153720000
2995806000
2990242000
2879837000
2848699000
3138385000
3532447000
3121872000
3309250000
3215022000
2966778000
3010284000
3083824000
3257727000
3180374000
3036414000
2966714000
3067677000
3339789000
3299861000
3193328000
3181266000
3193356000
2898282000
2929524000
3217311000
3126249000
3131083000
3008058000
2868318000
3207495000
3109336000
3070725000
2989963000
3287552000
2835238000
3368961000
3291689000
3008536000
2974109000


Summary of computational transaction
Raw Inputview raw input (R code)
Raw Outputview raw output of R engine
Computing time2 seconds
R Server'George Udny Yule' @ yule.wessa.net

\begin{tabular}{lllllllll}
\hline
Summary of computational transaction \tabularnewline
Raw Input & view raw input (R code)  \tabularnewline
Raw Output & view raw output of R engine  \tabularnewline
Computing time & 2 seconds \tabularnewline
R Server & 'George Udny Yule' @ yule.wessa.net \tabularnewline
\hline
\end{tabular}
%Source: https://freestatistics.org/blog/index.php?pk=282213&T=0

[TABLE]
[ROW][C]Summary of computational transaction[/C][/ROW]
[ROW][C]Raw Input[/C][C]view raw input (R code) [/C][/ROW]
[ROW][C]Raw Output[/C][C]view raw output of R engine [/C][/ROW]
[ROW][C]Computing time[/C][C]2 seconds[/C][/ROW]
[ROW][C]R Server[/C][C]'George Udny Yule' @ yule.wessa.net[/C][/ROW]
[/TABLE]
Source: https://freestatistics.org/blog/index.php?pk=282213&T=0

Globally Unique Identifier (entire table): ba.freestatistics.org/blog/index.php?pk=282213&T=0

As an alternative you can also use a QR Code:  

The GUIDs for individual cells are displayed in the table below:

Summary of computational transaction
Raw Inputview raw input (R code)
Raw Outputview raw output of R engine
Computing time2 seconds
R Server'George Udny Yule' @ yule.wessa.net


Central Tendency - Ungrouped Data
MeasureValueS.E.Value/S.E.
Arithmetic Mean2879727321.4285736926129.214566377.9861681330142
Geometric Mean2858754395.72021
Harmonic Mean2836438864.24533
Quadratic Mean2899310811.95862
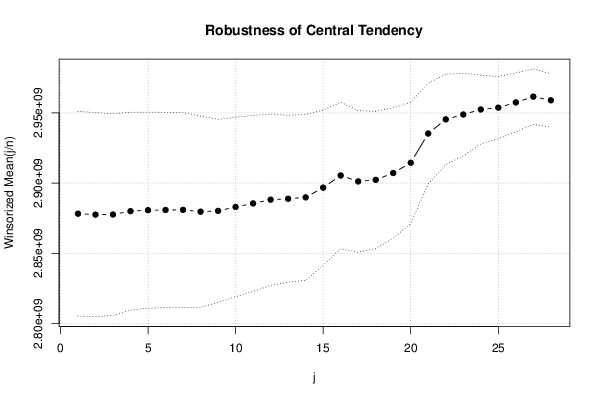
Winsorized Mean ( 1 / 28 )287821700036455639.309312178.9512145317062
Winsorized Mean ( 2 / 28 )2877541142.8571436341663.866699379.1802255783314
Winsorized Mean ( 3 / 28 )2877622892.8571435906420.225468480.1422941854853
Winsorized Mean ( 4 / 28 )2879987226.1904835220378.081817281.7704801322759
Winsorized Mean ( 5 / 28 )2880685202.3809534900770.65357882.5393006639992
Winsorized Mean ( 6 / 28 )2880839273.8095234765375.463510682.8651851274619
Winsorized Mean ( 7 / 28 )2880921190.4761934683038.82872183.0642667934419
Winsorized Mean ( 8 / 28 )2879635095.238134046652.44663284.5790962783174
Winsorized Mean ( 9 / 28 )2880187202.3809532607441.609125688.3291377749457
Winsorized Mean ( 10 / 28 )2882985178.5714331938196.989194490.267624673579
Winsorized Mean ( 11 / 28 )2885508630.9523831357389.436868192.0200527777284
Winsorized Mean ( 12 / 28 )2888187202.3809530514177.266685494.6506660539787
Winsorized Mean ( 13 / 28 )2888847261.9047629713310.634225797.2240117389411
Winsorized Mean ( 14 / 28 )2889827761.9047629531689.668033997.8551445714537
Winsorized Mean ( 15 / 28 )2896764190.4761927626913.756446104.85297836789
Winsorized Mean ( 16 / 28 )2905422857.1428626074280.3527424111.428688264345
Winsorized Mean ( 17 / 28 )2901192083.3333325207492.5079642115.092450485375
Winsorized Mean ( 18 / 28 )2902312154.761924429232.4063551118.804885331022
Winsorized Mean ( 19 / 28 )2907166202.3809523228175.2824397125.156891018415
Winsorized Mean ( 20 / 28 )2914481202.3809521525368.2728658135.397507045436
Winsorized Mean ( 21 / 28 )2935299702.3809517911705.1560797163.876061871454
Winsorized Mean ( 22 / 28 )2945393773.8095216112612.8920107182.800505017406
Winsorized Mean ( 23 / 28 )2948860476.1904814688757.6723334200.756288719006
Winsorized Mean ( 24 / 28 )2952437619.0476212261987.3016233240.779699605199
Winsorized Mean ( 25 / 28 )2953737619.0476211083038.07373266.509742130079
Winsorized Mean ( 26 / 28 )2957465214.2857110498343.259333281.707802958007
Winsorized Mean ( 27 / 28 )2961585607.142869861303.19717968300.323957992679
Winsorized Mean ( 28 / 28 )2958950273.809529458144.59010364312.846800513662
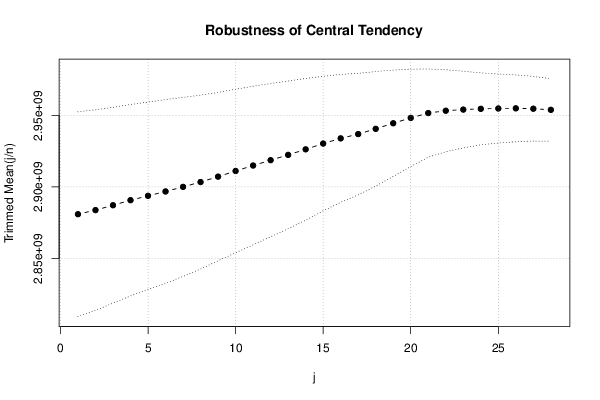
Trimmed Mean ( 1 / 28 )2880953365.8536635800801.853829380.4717552868304
Trimmed Mean ( 2 / 28 )288382655035038170.816173182.3052825768196
Trimmed Mean ( 3 / 28 )288721100034216829.843472284.3798508864729
Trimmed Mean ( 4 / 28 )2890743460.5263233445188.50154786.4322669430493
Trimmed Mean ( 5 / 28 )2893795905.4054132780049.417337688.2791806858855
Trimmed Mean ( 6 / 28 )2896855069.4444432087987.218516190.2784911286938
Trimmed Mean ( 7 / 28 )2900058228.5714331300413.210993892.6523943636894
Trimmed Mean ( 8 / 28 )2903435352.9411830379368.246313395.5726047164763
Trimmed Mean ( 9 / 28 )2907221757.5757629420352.692642498.8166861202454
Trimmed Mean ( 10 / 28 )2911164296.87528584086.292931101.845630713582
Trimmed Mean ( 11 / 28 )2914982112.9032327714971.6392726105.177163839224
Trimmed Mean ( 12 / 28 )2918733283.3333326778119.9484064108.996945601741
Trimmed Mean ( 13 / 28 )2922419879.3103425806161.878646113.245041748288
Trimmed Mean ( 14 / 28 )2926293642.8571424767728.178164118.149457302146
Trimmed Mean ( 15 / 28 )2930345407.4074123504701.7115498124.670606050171
Trimmed Mean ( 16 / 28 )2933961846.1538522350824.1357629131.268620267979
Trimmed Mean ( 17 / 28 )293695844021253147.0854757138.189343356453
Trimmed Mean ( 18 / 28 )2940640270.8333320019777.9435352146.886757641732
Trimmed Mean ( 19 / 28 )2944528630.4347818594470.8671771158.355064334337
Trimmed Mean ( 20 / 28 )294828275017028192.5731342173.141261900666
Trimmed Mean ( 21 / 28 )2951662904.761915415910.932281191.46860135142
Trimmed Mean ( 22 / 28 )295329922514345278.6701305205.872558694123
Trimmed Mean ( 23 / 28 )2954093552.6315813416475.7232187220.184019527512
Trimmed Mean ( 24 / 28 )2954624444.4444412553779.1104148235.357370753262
Trimmed Mean ( 25 / 28 )2954849558.8235312058590.3555181245.041043082732
Trimmed Mean ( 26 / 28 )2954966312.511683627.4699999252.915143014229
Trimmed Mean ( 27 / 28 )295469720011297766.3584699261.529324138029
Trimmed Mean ( 28 / 28 )2953931821.4285710903878.5348754270.906523030369
Median2966746000
Midrange2829459500
Midmean - Weighted Average at Xnp2944031581.39535
Midmean - Weighted Average at X(n+1)p2951662904.7619
Midmean - Empirical Distribution Function2944031581.39535
Midmean - Empirical Distribution Function - Averaging2951662904.7619
Midmean - Empirical Distribution Function - Interpolation2951662904.7619
Midmean - Closest Observation2944031581.39535
Midmean - True Basic - Statistics Graphics Toolkit2951662904.7619
Midmean - MS Excel (old versions)2948282750
Number of observations84

\begin{tabular}{lllllllll}
\hline
Central Tendency - Ungrouped Data \tabularnewline
Measure & Value & S.E. & Value/S.E. \tabularnewline
Arithmetic Mean & 2879727321.42857 & 36926129.2145663 & 77.9861681330142 \tabularnewline
Geometric Mean & 2858754395.72021 &  &  \tabularnewline
Harmonic Mean & 2836438864.24533 &  &  \tabularnewline
Quadratic Mean & 2899310811.95862 &  &  \tabularnewline
Winsorized Mean ( 1 / 28 ) & 2878217000 & 36455639.3093121 & 78.9512145317062 \tabularnewline
Winsorized Mean ( 2 / 28 ) & 2877541142.85714 & 36341663.8666993 & 79.1802255783314 \tabularnewline
Winsorized Mean ( 3 / 28 ) & 2877622892.85714 & 35906420.2254684 & 80.1422941854853 \tabularnewline
Winsorized Mean ( 4 / 28 ) & 2879987226.19048 & 35220378.0818172 & 81.7704801322759 \tabularnewline
Winsorized Mean ( 5 / 28 ) & 2880685202.38095 & 34900770.653578 & 82.5393006639992 \tabularnewline
Winsorized Mean ( 6 / 28 ) & 2880839273.80952 & 34765375.4635106 & 82.8651851274619 \tabularnewline
Winsorized Mean ( 7 / 28 ) & 2880921190.47619 & 34683038.828721 & 83.0642667934419 \tabularnewline
Winsorized Mean ( 8 / 28 ) & 2879635095.2381 & 34046652.446632 & 84.5790962783174 \tabularnewline
Winsorized Mean ( 9 / 28 ) & 2880187202.38095 & 32607441.6091256 & 88.3291377749457 \tabularnewline
Winsorized Mean ( 10 / 28 ) & 2882985178.57143 & 31938196.9891944 & 90.267624673579 \tabularnewline
Winsorized Mean ( 11 / 28 ) & 2885508630.95238 & 31357389.4368681 & 92.0200527777284 \tabularnewline
Winsorized Mean ( 12 / 28 ) & 2888187202.38095 & 30514177.2666854 & 94.6506660539787 \tabularnewline
Winsorized Mean ( 13 / 28 ) & 2888847261.90476 & 29713310.6342257 & 97.2240117389411 \tabularnewline
Winsorized Mean ( 14 / 28 ) & 2889827761.90476 & 29531689.6680339 & 97.8551445714537 \tabularnewline
Winsorized Mean ( 15 / 28 ) & 2896764190.47619 & 27626913.756446 & 104.85297836789 \tabularnewline
Winsorized Mean ( 16 / 28 ) & 2905422857.14286 & 26074280.3527424 & 111.428688264345 \tabularnewline
Winsorized Mean ( 17 / 28 ) & 2901192083.33333 & 25207492.5079642 & 115.092450485375 \tabularnewline
Winsorized Mean ( 18 / 28 ) & 2902312154.7619 & 24429232.4063551 & 118.804885331022 \tabularnewline
Winsorized Mean ( 19 / 28 ) & 2907166202.38095 & 23228175.2824397 & 125.156891018415 \tabularnewline
Winsorized Mean ( 20 / 28 ) & 2914481202.38095 & 21525368.2728658 & 135.397507045436 \tabularnewline
Winsorized Mean ( 21 / 28 ) & 2935299702.38095 & 17911705.1560797 & 163.876061871454 \tabularnewline
Winsorized Mean ( 22 / 28 ) & 2945393773.80952 & 16112612.8920107 & 182.800505017406 \tabularnewline
Winsorized Mean ( 23 / 28 ) & 2948860476.19048 & 14688757.6723334 & 200.756288719006 \tabularnewline
Winsorized Mean ( 24 / 28 ) & 2952437619.04762 & 12261987.3016233 & 240.779699605199 \tabularnewline
Winsorized Mean ( 25 / 28 ) & 2953737619.04762 & 11083038.07373 & 266.509742130079 \tabularnewline
Winsorized Mean ( 26 / 28 ) & 2957465214.28571 & 10498343.259333 & 281.707802958007 \tabularnewline
Winsorized Mean ( 27 / 28 ) & 2961585607.14286 & 9861303.19717968 & 300.323957992679 \tabularnewline
Winsorized Mean ( 28 / 28 ) & 2958950273.80952 & 9458144.59010364 & 312.846800513662 \tabularnewline
Trimmed Mean ( 1 / 28 ) & 2880953365.85366 & 35800801.8538293 & 80.4717552868304 \tabularnewline
Trimmed Mean ( 2 / 28 ) & 2883826550 & 35038170.8161731 & 82.3052825768196 \tabularnewline
Trimmed Mean ( 3 / 28 ) & 2887211000 & 34216829.8434722 & 84.3798508864729 \tabularnewline
Trimmed Mean ( 4 / 28 ) & 2890743460.52632 & 33445188.501547 & 86.4322669430493 \tabularnewline
Trimmed Mean ( 5 / 28 ) & 2893795905.40541 & 32780049.4173376 & 88.2791806858855 \tabularnewline
Trimmed Mean ( 6 / 28 ) & 2896855069.44444 & 32087987.2185161 & 90.2784911286938 \tabularnewline
Trimmed Mean ( 7 / 28 ) & 2900058228.57143 & 31300413.2109938 & 92.6523943636894 \tabularnewline
Trimmed Mean ( 8 / 28 ) & 2903435352.94118 & 30379368.2463133 & 95.5726047164763 \tabularnewline
Trimmed Mean ( 9 / 28 ) & 2907221757.57576 & 29420352.6926424 & 98.8166861202454 \tabularnewline
Trimmed Mean ( 10 / 28 ) & 2911164296.875 & 28584086.292931 & 101.845630713582 \tabularnewline
Trimmed Mean ( 11 / 28 ) & 2914982112.90323 & 27714971.6392726 & 105.177163839224 \tabularnewline
Trimmed Mean ( 12 / 28 ) & 2918733283.33333 & 26778119.9484064 & 108.996945601741 \tabularnewline
Trimmed Mean ( 13 / 28 ) & 2922419879.31034 & 25806161.878646 & 113.245041748288 \tabularnewline
Trimmed Mean ( 14 / 28 ) & 2926293642.85714 & 24767728.178164 & 118.149457302146 \tabularnewline
Trimmed Mean ( 15 / 28 ) & 2930345407.40741 & 23504701.7115498 & 124.670606050171 \tabularnewline
Trimmed Mean ( 16 / 28 ) & 2933961846.15385 & 22350824.1357629 & 131.268620267979 \tabularnewline
Trimmed Mean ( 17 / 28 ) & 2936958440 & 21253147.0854757 & 138.189343356453 \tabularnewline
Trimmed Mean ( 18 / 28 ) & 2940640270.83333 & 20019777.9435352 & 146.886757641732 \tabularnewline
Trimmed Mean ( 19 / 28 ) & 2944528630.43478 & 18594470.8671771 & 158.355064334337 \tabularnewline
Trimmed Mean ( 20 / 28 ) & 2948282750 & 17028192.5731342 & 173.141261900666 \tabularnewline
Trimmed Mean ( 21 / 28 ) & 2951662904.7619 & 15415910.932281 & 191.46860135142 \tabularnewline
Trimmed Mean ( 22 / 28 ) & 2953299225 & 14345278.6701305 & 205.872558694123 \tabularnewline
Trimmed Mean ( 23 / 28 ) & 2954093552.63158 & 13416475.7232187 & 220.184019527512 \tabularnewline
Trimmed Mean ( 24 / 28 ) & 2954624444.44444 & 12553779.1104148 & 235.357370753262 \tabularnewline
Trimmed Mean ( 25 / 28 ) & 2954849558.82353 & 12058590.3555181 & 245.041043082732 \tabularnewline
Trimmed Mean ( 26 / 28 ) & 2954966312.5 & 11683627.4699999 & 252.915143014229 \tabularnewline
Trimmed Mean ( 27 / 28 ) & 2954697200 & 11297766.3584699 & 261.529324138029 \tabularnewline
Trimmed Mean ( 28 / 28 ) & 2953931821.42857 & 10903878.5348754 & 270.906523030369 \tabularnewline
Median & 2966746000 &  &  \tabularnewline
Midrange & 2829459500 &  &  \tabularnewline
Midmean - Weighted Average at Xnp & 2944031581.39535 &  &  \tabularnewline
Midmean - Weighted Average at X(n+1)p & 2951662904.7619 &  &  \tabularnewline
Midmean - Empirical Distribution Function & 2944031581.39535 &  &  \tabularnewline
Midmean - Empirical Distribution Function - Averaging & 2951662904.7619 &  &  \tabularnewline
Midmean - Empirical Distribution Function - Interpolation & 2951662904.7619 &  &  \tabularnewline
Midmean - Closest Observation & 2944031581.39535 &  &  \tabularnewline
Midmean - True Basic - Statistics Graphics Toolkit & 2951662904.7619 &  &  \tabularnewline
Midmean - MS Excel (old versions) & 2948282750 &  &  \tabularnewline
Number of observations & 84 &  &  \tabularnewline
\hline
\end{tabular}
%Source: https://freestatistics.org/blog/index.php?pk=282213&T=1

[TABLE]
[ROW][C]Central Tendency - Ungrouped Data[/C][/ROW]
[ROW][C]Measure[/C][C]Value[/C][C]S.E.[/C][C]Value/S.E.[/C][/ROW]
[ROW][C]Arithmetic Mean[/C][C]2879727321.42857[/C][C]36926129.2145663[/C][C]77.9861681330142[/C][/ROW]
[ROW][C]Geometric Mean[/C][C]2858754395.72021[/C][C][/C][C][/C][/ROW]
[ROW][C]Harmonic Mean[/C][C]2836438864.24533[/C][C][/C][C][/C][/ROW]
[ROW][C]Quadratic Mean[/C][C]2899310811.95862[/C][C][/C][C][/C][/ROW]
[ROW][C]Winsorized Mean ( 1 / 28 )[/C][C]2878217000[/C][C]36455639.3093121[/C][C]78.9512145317062[/C][/ROW]
[ROW][C]Winsorized Mean ( 2 / 28 )[/C][C]2877541142.85714[/C][C]36341663.8666993[/C][C]79.1802255783314[/C][/ROW]
[ROW][C]Winsorized Mean ( 3 / 28 )[/C][C]2877622892.85714[/C][C]35906420.2254684[/C][C]80.1422941854853[/C][/ROW]
[ROW][C]Winsorized Mean ( 4 / 28 )[/C][C]2879987226.19048[/C][C]35220378.0818172[/C][C]81.7704801322759[/C][/ROW]
[ROW][C]Winsorized Mean ( 5 / 28 )[/C][C]2880685202.38095[/C][C]34900770.653578[/C][C]82.5393006639992[/C][/ROW]
[ROW][C]Winsorized Mean ( 6 / 28 )[/C][C]2880839273.80952[/C][C]34765375.4635106[/C][C]82.8651851274619[/C][/ROW]
[ROW][C]Winsorized Mean ( 7 / 28 )[/C][C]2880921190.47619[/C][C]34683038.828721[/C][C]83.0642667934419[/C][/ROW]
[ROW][C]Winsorized Mean ( 8 / 28 )[/C][C]2879635095.2381[/C][C]34046652.446632[/C][C]84.5790962783174[/C][/ROW]
[ROW][C]Winsorized Mean ( 9 / 28 )[/C][C]2880187202.38095[/C][C]32607441.6091256[/C][C]88.3291377749457[/C][/ROW]
[ROW][C]Winsorized Mean ( 10 / 28 )[/C][C]2882985178.57143[/C][C]31938196.9891944[/C][C]90.267624673579[/C][/ROW]
[ROW][C]Winsorized Mean ( 11 / 28 )[/C][C]2885508630.95238[/C][C]31357389.4368681[/C][C]92.0200527777284[/C][/ROW]
[ROW][C]Winsorized Mean ( 12 / 28 )[/C][C]2888187202.38095[/C][C]30514177.2666854[/C][C]94.6506660539787[/C][/ROW]
[ROW][C]Winsorized Mean ( 13 / 28 )[/C][C]2888847261.90476[/C][C]29713310.6342257[/C][C]97.2240117389411[/C][/ROW]
[ROW][C]Winsorized Mean ( 14 / 28 )[/C][C]2889827761.90476[/C][C]29531689.6680339[/C][C]97.8551445714537[/C][/ROW]
[ROW][C]Winsorized Mean ( 15 / 28 )[/C][C]2896764190.47619[/C][C]27626913.756446[/C][C]104.85297836789[/C][/ROW]
[ROW][C]Winsorized Mean ( 16 / 28 )[/C][C]2905422857.14286[/C][C]26074280.3527424[/C][C]111.428688264345[/C][/ROW]
[ROW][C]Winsorized Mean ( 17 / 28 )[/C][C]2901192083.33333[/C][C]25207492.5079642[/C][C]115.092450485375[/C][/ROW]
[ROW][C]Winsorized Mean ( 18 / 28 )[/C][C]2902312154.7619[/C][C]24429232.4063551[/C][C]118.804885331022[/C][/ROW]
[ROW][C]Winsorized Mean ( 19 / 28 )[/C][C]2907166202.38095[/C][C]23228175.2824397[/C][C]125.156891018415[/C][/ROW]
[ROW][C]Winsorized Mean ( 20 / 28 )[/C][C]2914481202.38095[/C][C]21525368.2728658[/C][C]135.397507045436[/C][/ROW]
[ROW][C]Winsorized Mean ( 21 / 28 )[/C][C]2935299702.38095[/C][C]17911705.1560797[/C][C]163.876061871454[/C][/ROW]
[ROW][C]Winsorized Mean ( 22 / 28 )[/C][C]2945393773.80952[/C][C]16112612.8920107[/C][C]182.800505017406[/C][/ROW]
[ROW][C]Winsorized Mean ( 23 / 28 )[/C][C]2948860476.19048[/C][C]14688757.6723334[/C][C]200.756288719006[/C][/ROW]
[ROW][C]Winsorized Mean ( 24 / 28 )[/C][C]2952437619.04762[/C][C]12261987.3016233[/C][C]240.779699605199[/C][/ROW]
[ROW][C]Winsorized Mean ( 25 / 28 )[/C][C]2953737619.04762[/C][C]11083038.07373[/C][C]266.509742130079[/C][/ROW]
[ROW][C]Winsorized Mean ( 26 / 28 )[/C][C]2957465214.28571[/C][C]10498343.259333[/C][C]281.707802958007[/C][/ROW]
[ROW][C]Winsorized Mean ( 27 / 28 )[/C][C]2961585607.14286[/C][C]9861303.19717968[/C][C]300.323957992679[/C][/ROW]
[ROW][C]Winsorized Mean ( 28 / 28 )[/C][C]2958950273.80952[/C][C]9458144.59010364[/C][C]312.846800513662[/C][/ROW]
[ROW][C]Trimmed Mean ( 1 / 28 )[/C][C]2880953365.85366[/C][C]35800801.8538293[/C][C]80.4717552868304[/C][/ROW]
[ROW][C]Trimmed Mean ( 2 / 28 )[/C][C]2883826550[/C][C]35038170.8161731[/C][C]82.3052825768196[/C][/ROW]
[ROW][C]Trimmed Mean ( 3 / 28 )[/C][C]2887211000[/C][C]34216829.8434722[/C][C]84.3798508864729[/C][/ROW]
[ROW][C]Trimmed Mean ( 4 / 28 )[/C][C]2890743460.52632[/C][C]33445188.501547[/C][C]86.4322669430493[/C][/ROW]
[ROW][C]Trimmed Mean ( 5 / 28 )[/C][C]2893795905.40541[/C][C]32780049.4173376[/C][C]88.2791806858855[/C][/ROW]
[ROW][C]Trimmed Mean ( 6 / 28 )[/C][C]2896855069.44444[/C][C]32087987.2185161[/C][C]90.2784911286938[/C][/ROW]
[ROW][C]Trimmed Mean ( 7 / 28 )[/C][C]2900058228.57143[/C][C]31300413.2109938[/C][C]92.6523943636894[/C][/ROW]
[ROW][C]Trimmed Mean ( 8 / 28 )[/C][C]2903435352.94118[/C][C]30379368.2463133[/C][C]95.5726047164763[/C][/ROW]
[ROW][C]Trimmed Mean ( 9 / 28 )[/C][C]2907221757.57576[/C][C]29420352.6926424[/C][C]98.8166861202454[/C][/ROW]
[ROW][C]Trimmed Mean ( 10 / 28 )[/C][C]2911164296.875[/C][C]28584086.292931[/C][C]101.845630713582[/C][/ROW]
[ROW][C]Trimmed Mean ( 11 / 28 )[/C][C]2914982112.90323[/C][C]27714971.6392726[/C][C]105.177163839224[/C][/ROW]
[ROW][C]Trimmed Mean ( 12 / 28 )[/C][C]2918733283.33333[/C][C]26778119.9484064[/C][C]108.996945601741[/C][/ROW]
[ROW][C]Trimmed Mean ( 13 / 28 )[/C][C]2922419879.31034[/C][C]25806161.878646[/C][C]113.245041748288[/C][/ROW]
[ROW][C]Trimmed Mean ( 14 / 28 )[/C][C]2926293642.85714[/C][C]24767728.178164[/C][C]118.149457302146[/C][/ROW]
[ROW][C]Trimmed Mean ( 15 / 28 )[/C][C]2930345407.40741[/C][C]23504701.7115498[/C][C]124.670606050171[/C][/ROW]
[ROW][C]Trimmed Mean ( 16 / 28 )[/C][C]2933961846.15385[/C][C]22350824.1357629[/C][C]131.268620267979[/C][/ROW]
[ROW][C]Trimmed Mean ( 17 / 28 )[/C][C]2936958440[/C][C]21253147.0854757[/C][C]138.189343356453[/C][/ROW]
[ROW][C]Trimmed Mean ( 18 / 28 )[/C][C]2940640270.83333[/C][C]20019777.9435352[/C][C]146.886757641732[/C][/ROW]
[ROW][C]Trimmed Mean ( 19 / 28 )[/C][C]2944528630.43478[/C][C]18594470.8671771[/C][C]158.355064334337[/C][/ROW]
[ROW][C]Trimmed Mean ( 20 / 28 )[/C][C]2948282750[/C][C]17028192.5731342[/C][C]173.141261900666[/C][/ROW]
[ROW][C]Trimmed Mean ( 21 / 28 )[/C][C]2951662904.7619[/C][C]15415910.932281[/C][C]191.46860135142[/C][/ROW]
[ROW][C]Trimmed Mean ( 22 / 28 )[/C][C]2953299225[/C][C]14345278.6701305[/C][C]205.872558694123[/C][/ROW]
[ROW][C]Trimmed Mean ( 23 / 28 )[/C][C]2954093552.63158[/C][C]13416475.7232187[/C][C]220.184019527512[/C][/ROW]
[ROW][C]Trimmed Mean ( 24 / 28 )[/C][C]2954624444.44444[/C][C]12553779.1104148[/C][C]235.357370753262[/C][/ROW]
[ROW][C]Trimmed Mean ( 25 / 28 )[/C][C]2954849558.82353[/C][C]12058590.3555181[/C][C]245.041043082732[/C][/ROW]
[ROW][C]Trimmed Mean ( 26 / 28 )[/C][C]2954966312.5[/C][C]11683627.4699999[/C][C]252.915143014229[/C][/ROW]
[ROW][C]Trimmed Mean ( 27 / 28 )[/C][C]2954697200[/C][C]11297766.3584699[/C][C]261.529324138029[/C][/ROW]
[ROW][C]Trimmed Mean ( 28 / 28 )[/C][C]2953931821.42857[/C][C]10903878.5348754[/C][C]270.906523030369[/C][/ROW]
[ROW][C]Median[/C][C]2966746000[/C][C][/C][C][/C][/ROW]
[ROW][C]Midrange[/C][C]2829459500[/C][C][/C][C][/C][/ROW]
[ROW][C]Midmean - Weighted Average at Xnp[/C][C]2944031581.39535[/C][C][/C][C][/C][/ROW]
[ROW][C]Midmean - Weighted Average at X(n+1)p[/C][C]2951662904.7619[/C][C][/C][C][/C][/ROW]
[ROW][C]Midmean - Empirical Distribution Function[/C][C]2944031581.39535[/C][C][/C][C][/C][/ROW]
[ROW][C]Midmean - Empirical Distribution Function - Averaging[/C][C]2951662904.7619[/C][C][/C][C][/C][/ROW]
[ROW][C]Midmean - Empirical Distribution Function - Interpolation[/C][C]2951662904.7619[/C][C][/C][C][/C][/ROW]
[ROW][C]Midmean - Closest Observation[/C][C]2944031581.39535[/C][C][/C][C][/C][/ROW]
[ROW][C]Midmean - True Basic - Statistics Graphics Toolkit[/C][C]2951662904.7619[/C][C][/C][C][/C][/ROW]
[ROW][C]Midmean - MS Excel (old versions)[/C][C]2948282750[/C][C][/C][C][/C][/ROW]
[ROW][C]Number of observations[/C][C]84[/C][C][/C][C][/C][/ROW]
[/TABLE]
Source: https://freestatistics.org/blog/index.php?pk=282213&T=1

Globally Unique Identifier (entire table): ba.freestatistics.org/blog/index.php?pk=282213&T=1

As an alternative you can also use a QR Code:  

The GUIDs for individual cells are displayed in the table below:

Central Tendency - Ungrouped Data
MeasureValueS.E.Value/S.E.
Arithmetic Mean2879727321.4285736926129.214566377.9861681330142
Geometric Mean2858754395.72021
Harmonic Mean2836438864.24533
Quadratic Mean2899310811.95862
Winsorized Mean ( 1 / 28 )287821700036455639.309312178.9512145317062
Winsorized Mean ( 2 / 28 )2877541142.8571436341663.866699379.1802255783314
Winsorized Mean ( 3 / 28 )2877622892.8571435906420.225468480.1422941854853
Winsorized Mean ( 4 / 28 )2879987226.1904835220378.081817281.7704801322759
Winsorized Mean ( 5 / 28 )2880685202.3809534900770.65357882.5393006639992
Winsorized Mean ( 6 / 28 )2880839273.8095234765375.463510682.8651851274619
Winsorized Mean ( 7 / 28 )2880921190.4761934683038.82872183.0642667934419
Winsorized Mean ( 8 / 28 )2879635095.238134046652.44663284.5790962783174
Winsorized Mean ( 9 / 28 )2880187202.3809532607441.609125688.3291377749457
Winsorized Mean ( 10 / 28 )2882985178.5714331938196.989194490.267624673579
Winsorized Mean ( 11 / 28 )2885508630.9523831357389.436868192.0200527777284
Winsorized Mean ( 12 / 28 )2888187202.3809530514177.266685494.6506660539787
Winsorized Mean ( 13 / 28 )2888847261.9047629713310.634225797.2240117389411
Winsorized Mean ( 14 / 28 )2889827761.9047629531689.668033997.8551445714537
Winsorized Mean ( 15 / 28 )2896764190.4761927626913.756446104.85297836789
Winsorized Mean ( 16 / 28 )2905422857.1428626074280.3527424111.428688264345
Winsorized Mean ( 17 / 28 )2901192083.3333325207492.5079642115.092450485375
Winsorized Mean ( 18 / 28 )2902312154.761924429232.4063551118.804885331022
Winsorized Mean ( 19 / 28 )2907166202.3809523228175.2824397125.156891018415
Winsorized Mean ( 20 / 28 )2914481202.3809521525368.2728658135.397507045436
Winsorized Mean ( 21 / 28 )2935299702.3809517911705.1560797163.876061871454
Winsorized Mean ( 22 / 28 )2945393773.8095216112612.8920107182.800505017406
Winsorized Mean ( 23 / 28 )2948860476.1904814688757.6723334200.756288719006
Winsorized Mean ( 24 / 28 )2952437619.0476212261987.3016233240.779699605199
Winsorized Mean ( 25 / 28 )2953737619.0476211083038.07373266.509742130079
Winsorized Mean ( 26 / 28 )2957465214.2857110498343.259333281.707802958007
Winsorized Mean ( 27 / 28 )2961585607.142869861303.19717968300.323957992679
Winsorized Mean ( 28 / 28 )2958950273.809529458144.59010364312.846800513662
Trimmed Mean ( 1 / 28 )2880953365.8536635800801.853829380.4717552868304
Trimmed Mean ( 2 / 28 )288382655035038170.816173182.3052825768196
Trimmed Mean ( 3 / 28 )288721100034216829.843472284.3798508864729
Trimmed Mean ( 4 / 28 )2890743460.5263233445188.50154786.4322669430493
Trimmed Mean ( 5 / 28 )2893795905.4054132780049.417337688.2791806858855
Trimmed Mean ( 6 / 28 )2896855069.4444432087987.218516190.2784911286938
Trimmed Mean ( 7 / 28 )2900058228.5714331300413.210993892.6523943636894
Trimmed Mean ( 8 / 28 )2903435352.9411830379368.246313395.5726047164763
Trimmed Mean ( 9 / 28 )2907221757.5757629420352.692642498.8166861202454
Trimmed Mean ( 10 / 28 )2911164296.87528584086.292931101.845630713582
Trimmed Mean ( 11 / 28 )2914982112.9032327714971.6392726105.177163839224
Trimmed Mean ( 12 / 28 )2918733283.3333326778119.9484064108.996945601741
Trimmed Mean ( 13 / 28 )2922419879.3103425806161.878646113.245041748288
Trimmed Mean ( 14 / 28 )2926293642.8571424767728.178164118.149457302146
Trimmed Mean ( 15 / 28 )2930345407.4074123504701.7115498124.670606050171
Trimmed Mean ( 16 / 28 )2933961846.1538522350824.1357629131.268620267979
Trimmed Mean ( 17 / 28 )293695844021253147.0854757138.189343356453
Trimmed Mean ( 18 / 28 )2940640270.8333320019777.9435352146.886757641732
Trimmed Mean ( 19 / 28 )2944528630.4347818594470.8671771158.355064334337
Trimmed Mean ( 20 / 28 )294828275017028192.5731342173.141261900666
Trimmed Mean ( 21 / 28 )2951662904.761915415910.932281191.46860135142
Trimmed Mean ( 22 / 28 )295329922514345278.6701305205.872558694123
Trimmed Mean ( 23 / 28 )2954093552.6315813416475.7232187220.184019527512
Trimmed Mean ( 24 / 28 )2954624444.4444412553779.1104148235.357370753262
Trimmed Mean ( 25 / 28 )2954849558.8235312058590.3555181245.041043082732
Trimmed Mean ( 26 / 28 )2954966312.511683627.4699999252.915143014229
Trimmed Mean ( 27 / 28 )295469720011297766.3584699261.529324138029
Trimmed Mean ( 28 / 28 )2953931821.4285710903878.5348754270.906523030369
Median2966746000
Midrange2829459500
Midmean - Weighted Average at Xnp2944031581.39535
Midmean - Weighted Average at X(n+1)p2951662904.7619
Midmean - Empirical Distribution Function2944031581.39535
Midmean - Empirical Distribution Function - Averaging2951662904.7619
Midmean - Empirical Distribution Function - Interpolation2951662904.7619
Midmean - Closest Observation2944031581.39535
Midmean - True Basic - Statistics Graphics Toolkit2951662904.7619
Midmean - MS Excel (old versions)2948282750
Number of observations84


Parameters (Session):
Parameters (R input):
R code (references can be found in the software module):
geomean <- function(x) {
return(exp(mean(log(x))))
}
harmean <- function(x) {
return(1/mean(1/x))
}
quamean <- function(x) {
return(sqrt(mean(x*x)))
}
winmean <- function(x) {
x <-sort(x[!is.na(x)])
n<-length(x)
denom <- 3
nodenom <- n/denom
if (nodenom>40) denom <- n/40
sqrtn = sqrt(n)
roundnodenom = floor(nodenom)
win <- array(NA,dim=c(roundnodenom,2))
for (j in 1:roundnodenom) {
win[j,1] <- (j*x[j+1]+sum(x[(j+1):(n-j)])+j*x[n-j])/n
win[j,2] <- sd(c(rep(x[j+1],j),x[(j+1):(n-j)],rep(x[n-j],j)))/sqrtn
}
return(win)
}
trimean <- function(x) {
x <-sort(x[!is.na(x)])
n<-length(x)
denom <- 3
nodenom <- n/denom
if (nodenom>40) denom <- n/40
sqrtn = sqrt(n)
roundnodenom = floor(nodenom)
tri <- array(NA,dim=c(roundnodenom,2))
for (j in 1:roundnodenom) {
tri[j,1] <- mean(x,trim=j/n)
tri[j,2] <- sd(x[(j+1):(n-j)]) / sqrt(n-j*2)
}
return(tri)
}
midrange <- function(x) {
return((max(x)+min(x))/2)
}
q1 <- function(data,n,p,i,f) {
np <- n*p;
i <<- floor(np)
f <<- np - i
qvalue <- (1-f)*data[i] + f*data[i+1]
}
q2 <- function(data,n,p,i,f) {
np <- (n+1)*p
i <<- floor(np)
f <<- np - i
qvalue <- (1-f)*data[i] + f*data[i+1]
}
q3 <- function(data,n,p,i,f) {
np <- n*p
i <<- floor(np)
f <<- np - i
if (f==0) {
qvalue <- data[i]
} else {
qvalue <- data[i+1]
}
}
q4 <- function(data,n,p,i,f) {
np <- n*p
i <<- floor(np)
f <<- np - i
if (f==0) {
qvalue <- (data[i]+data[i+1])/2
} else {
qvalue <- data[i+1]
}
}
q5 <- function(data,n,p,i,f) {
np <- (n-1)*p
i <<- floor(np)
f <<- np - i
if (f==0) {
qvalue <- data[i+1]
} else {
qvalue <- data[i+1] + f*(data[i+2]-data[i+1])
}
}
q6 <- function(data,n,p,i,f) {
np <- n*p+0.5
i <<- floor(np)
f <<- np - i
qvalue <- data[i]
}
q7 <- function(data,n,p,i,f) {
np <- (n+1)*p
i <<- floor(np)
f <<- np - i
if (f==0) {
qvalue <- data[i]
} else {
qvalue <- f*data[i] + (1-f)*data[i+1]
}
}
q8 <- function(data,n,p,i,f) {
np <- (n+1)*p
i <<- floor(np)
f <<- np - i
if (f==0) {
qvalue <- data[i]
} else {
if (f == 0.5) {
qvalue <- (data[i]+data[i+1])/2
} else {
if (f < 0.5) {
qvalue <- data[i]
} else {
qvalue <- data[i+1]
}
}
}
}
midmean <- function(x,def) {
x <-sort(x[!is.na(x)])
n<-length(x)
if (def==1) {
qvalue1 <- q1(x,n,0.25,i,f)
qvalue3 <- q1(x,n,0.75,i,f)
}
if (def==2) {
qvalue1 <- q2(x,n,0.25,i,f)
qvalue3 <- q2(x,n,0.75,i,f)
}
if (def==3) {
qvalue1 <- q3(x,n,0.25,i,f)
qvalue3 <- q3(x,n,0.75,i,f)
}
if (def==4) {
qvalue1 <- q4(x,n,0.25,i,f)
qvalue3 <- q4(x,n,0.75,i,f)
}
if (def==5) {
qvalue1 <- q5(x,n,0.25,i,f)
qvalue3 <- q5(x,n,0.75,i,f)
}
if (def==6) {
qvalue1 <- q6(x,n,0.25,i,f)
qvalue3 <- q6(x,n,0.75,i,f)
}
if (def==7) {
qvalue1 <- q7(x,n,0.25,i,f)
qvalue3 <- q7(x,n,0.75,i,f)
}
if (def==8) {
qvalue1 <- q8(x,n,0.25,i,f)
qvalue3 <- q8(x,n,0.75,i,f)
}
midm <- 0
myn <- 0
roundno4 <- round(n/4)
round3no4 <- round(3*n/4)
for (i in 1:n) {
if ((x[i]>=qvalue1) & (x[i]<=qvalue3)){
midm = midm + x[i]
myn = myn + 1
}
}
midm = midm / myn
return(midm)
}
(arm <- mean(x))
sqrtn <- sqrt(length(x))
(armse <- sd(x) / sqrtn)
(armose <- arm / armse)
(geo <- geomean(x))
(har <- harmean(x))
(qua <- quamean(x))
(win <- winmean(x))
(tri <- trimean(x))
(midr <- midrange(x))
midm <- array(NA,dim=8)
for (j in 1:8) midm[j] <- midmean(x,j)
midm
bitmap(file='test1.png')
lb <- win[,1] - 2*win[,2]
ub <- win[,1] + 2*win[,2]
if ((ylimmin == '') | (ylimmax == '')) plot(win[,1],type='b',main=main, xlab='j', pch=19, ylab='Winsorized Mean(j/n)', ylim=c(min(lb),max(ub))) else plot(win[,1],type='l',main=main, xlab='j', pch=19, ylab='Winsorized Mean(j/n)', ylim=c(ylimmin,ylimmax))
lines(ub,lty=3)
lines(lb,lty=3)
grid()
dev.off()
bitmap(file='test2.png')
lb <- tri[,1] - 2*tri[,2]
ub <- tri[,1] + 2*tri[,2]
if ((ylimmin == '') | (ylimmax == '')) plot(tri[,1],type='b',main=main, xlab='j', pch=19, ylab='Trimmed Mean(j/n)', ylim=c(min(lb),max(ub))) else plot(tri[,1],type='l',main=main, xlab='j', pch=19, ylab='Trimmed Mean(j/n)', ylim=c(ylimmin,ylimmax))
lines(ub,lty=3)
lines(lb,lty=3)
grid()
dev.off()
load(file='createtable')
a<-table.start()
a<-table.row.start(a)
a<-table.element(a,'Central Tendency - Ungrouped Data',4,TRUE)
a<-table.row.end(a)
a<-table.row.start(a)
a<-table.element(a,'Measure',header=TRUE)
a<-table.element(a,'Value',header=TRUE)
a<-table.element(a,'S.E.',header=TRUE)
a<-table.element(a,'Value/S.E.',header=TRUE)
a<-table.row.end(a)
a<-table.row.start(a)
a<-table.element(a,hyperlink('arithmetic_mean.htm', 'Arithmetic Mean', 'click to view the definition of the Arithmetic Mean'),header=TRUE)
a<-table.element(a,arm)
a<-table.element(a,hyperlink('arithmetic_mean_standard_error.htm', armse, 'click to view the definition of the Standard Error of the Arithmetic Mean'))
a<-table.element(a,armose)
a<-table.row.end(a)
a<-table.row.start(a)
a<-table.element(a,hyperlink('geometric_mean.htm', 'Geometric Mean', 'click to view the definition of the Geometric Mean'),header=TRUE)
a<-table.element(a,geo)
a<-table.element(a,'')
a<-table.row.end(a)
a<-table.row.start(a)
a<-table.element(a,hyperlink('harmonic_mean.htm', 'Harmonic Mean', 'click to view the definition of the Harmonic Mean'),header=TRUE)
a<-table.element(a,har)
a<-table.element(a,'')
a<-table.row.end(a)
a<-table.row.start(a)
a<-table.element(a,hyperlink('quadratic_mean.htm', 'Quadratic Mean', 'click to view the definition of the Quadratic Mean'),header=TRUE)
a<-table.element(a,qua)
a<-table.element(a,'')
a<-table.row.end(a)
for (j in 1:length(win[,1])) {
a<-table.row.start(a)
mylabel <- paste('Winsorized Mean (',j)
mylabel <- paste(mylabel,'/')
mylabel <- paste(mylabel,length(win[,1]))
mylabel <- paste(mylabel,')')
a<-table.element(a,hyperlink('winsorized_mean.htm', mylabel, 'click to view the definition of the Winsorized Mean'),header=TRUE)
a<-table.element(a,win[j,1])
a<-table.element(a,win[j,2])
a<-table.element(a,win[j,1]/win[j,2])
a<-table.row.end(a)
}
for (j in 1:length(tri[,1])) {
a<-table.row.start(a)
mylabel <- paste('Trimmed Mean (',j)
mylabel <- paste(mylabel,'/')
mylabel <- paste(mylabel,length(tri[,1]))
mylabel <- paste(mylabel,')')
a<-table.element(a,hyperlink('arithmetic_mean.htm', mylabel, 'click to view the definition of the Trimmed Mean'),header=TRUE)
a<-table.element(a,tri[j,1])
a<-table.element(a,tri[j,2])
a<-table.element(a,tri[j,1]/tri[j,2])
a<-table.row.end(a)
}
a<-table.row.start(a)
a<-table.element(a,hyperlink('median_1.htm', 'Median', 'click to view the definition of the Median'),header=TRUE)
a<-table.element(a,median(x))
a<-table.element(a,'')
a<-table.row.end(a)
a<-table.row.start(a)
a<-table.element(a,hyperlink('midrange.htm', 'Midrange', 'click to view the definition of the Midrange'),header=TRUE)
a<-table.element(a,midr)
a<-table.element(a,'')
a<-table.row.end(a)
a<-table.row.start(a)
mymid <- hyperlink('midmean.htm', 'Midmean', 'click to view the definition of the Midmean')
mylabel <- paste(mymid,hyperlink('method_1.htm','Weighted Average at Xnp',''),sep=' - ')
a<-table.element(a,mylabel,header=TRUE)
a<-table.element(a,midm[1])
a<-table.element(a,'')
a<-table.row.end(a)
a<-table.row.start(a)
mymid <- hyperlink('midmean.htm', 'Midmean', 'click to view the definition of the Midmean')
mylabel <- paste(mymid,hyperlink('method_2.htm','Weighted Average at X(n+1)p',''),sep=' - ')
a<-table.element(a,mylabel,header=TRUE)
a<-table.element(a,midm[2])
a<-table.element(a,'')
a<-table.row.end(a)
a<-table.row.start(a)
mymid <- hyperlink('midmean.htm', 'Midmean', 'click to view the definition of the Midmean')
mylabel <- paste(mymid,hyperlink('method_3.htm','Empirical Distribution Function',''),sep=' - ')
a<-table.element(a,mylabel,header=TRUE)
a<-table.element(a,midm[3])
a<-table.element(a,'')
a<-table.row.end(a)
a<-table.row.start(a)
mymid <- hyperlink('midmean.htm', 'Midmean', 'click to view the definition of the Midmean')
mylabel <- paste(mymid,hyperlink('method_4.htm','Empirical Distribution Function - Averaging',''),sep=' - ')
a<-table.element(a,mylabel,header=TRUE)
a<-table.element(a,midm[4])
a<-table.element(a,'')
a<-table.row.end(a)
a<-table.row.start(a)
mymid <- hyperlink('midmean.htm', 'Midmean', 'click to view the definition of the Midmean')
mylabel <- paste(mymid,hyperlink('method_5.htm','Empirical Distribution Function - Interpolation',''),sep=' - ')
a<-table.element(a,mylabel,header=TRUE)
a<-table.element(a,midm[5])
a<-table.element(a,'')
a<-table.row.end(a)
a<-table.row.start(a)
mymid <- hyperlink('midmean.htm', 'Midmean', 'click to view the definition of the Midmean')
mylabel <- paste(mymid,hyperlink('method_6.htm','Closest Observation',''),sep=' - ')
a<-table.element(a,mylabel,header=TRUE)
a<-table.element(a,midm[6])
a<-table.element(a,'')
a<-table.row.end(a)
a<-table.row.start(a)
mymid <- hyperlink('midmean.htm', 'Midmean', 'click to view the definition of the Midmean')
mylabel <- paste(mymid,hyperlink('method_7.htm','True Basic - Statistics Graphics Toolkit',''),sep=' - ')
a<-table.element(a,mylabel,header=TRUE)
a<-table.element(a,midm[7])
a<-table.element(a,'')
a<-table.row.end(a)
a<-table.row.start(a)
mymid <- hyperlink('midmean.htm', 'Midmean', 'click to view the definition of the Midmean')
mylabel <- paste(mymid,hyperlink('method_8.htm','MS Excel (old versions)',''),sep=' - ')
a<-table.element(a,mylabel,header=TRUE)
a<-table.element(a,midm[8])
a<-table.element(a,'')
a<-table.row.end(a)
a<-table.row.start(a)
a<-table.element(a,'Number of observations',header=TRUE)
a<-table.element(a,length(x))
a<-table.element(a,'')
a<-table.row.end(a)
a<-table.end(a)
table.save(a,file='mytable.tab')