Free Statistics
of Irreproducible Research!
Description of Statistical Computation | |||||||||||||||||||||||||||||||||||||||
|---|---|---|---|---|---|---|---|---|---|---|---|---|---|---|---|---|---|---|---|---|---|---|---|---|---|---|---|---|---|---|---|---|---|---|---|---|---|---|---|
| Author's title | |||||||||||||||||||||||||||||||||||||||
| Author | *The author of this computation has been verified* | ||||||||||||||||||||||||||||||||||||||
| R Software Module | rwasp_fitdistrnorm.wasp | ||||||||||||||||||||||||||||||||||||||
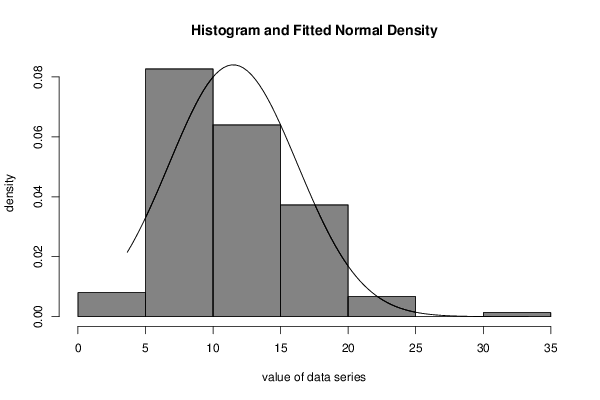
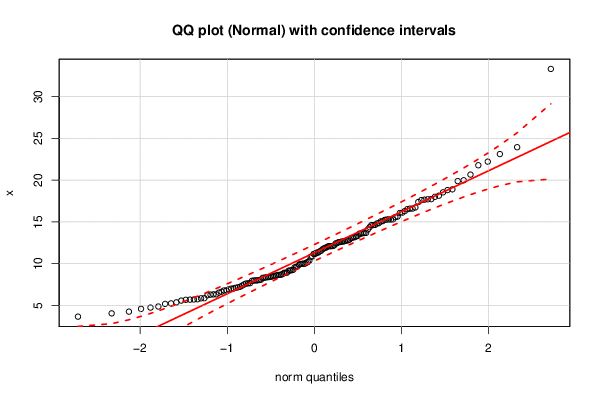
| Title produced by software | ML Fitting and QQ Plot- Normal Distribution | ||||||||||||||||||||||||||||||||||||||
| Date of computation | Tue, 13 Oct 2015 15:11:32 +0100 | ||||||||||||||||||||||||||||||||||||||
| Cite this page as follows | Statistical Computations at FreeStatistics.org, Office for Research Development and Education, URL https://freestatistics.org/blog/index.php?v=date/2015/Oct/13/t1444745501ikzthpirjtjmtg3.htm/, Retrieved Tue, 14 May 2024 10:35:20 +0000 | ||||||||||||||||||||||||||||||||||||||
| Statistical Computations at FreeStatistics.org, Office for Research Development and Education, URL https://freestatistics.org/blog/index.php?pk=282358, Retrieved Tue, 14 May 2024 10:35:20 +0000 | |||||||||||||||||||||||||||||||||||||||
| QR Codes: | |||||||||||||||||||||||||||||||||||||||
|
| |||||||||||||||||||||||||||||||||||||||
| Original text written by user: | |||||||||||||||||||||||||||||||||||||||
| IsPrivate? | No (this computation is public) | ||||||||||||||||||||||||||||||||||||||
| User-defined keywords | |||||||||||||||||||||||||||||||||||||||
| Estimated Impact | 106 | ||||||||||||||||||||||||||||||||||||||
Tree of Dependent Computations | |||||||||||||||||||||||||||||||||||||||
| Family? (F = Feedback message, R = changed R code, M = changed R Module, P = changed Parameters, D = changed Data) | |||||||||||||||||||||||||||||||||||||||
| - [ML Fitting and QQ Plot- Normal Distribution] [] [2015-10-13 14:11:32] [85e7a66a1e5d24b56c3cf5eab9332807] [Current] | |||||||||||||||||||||||||||||||||||||||
| Feedback Forum | |||||||||||||||||||||||||||||||||||||||
Post a new message | |||||||||||||||||||||||||||||||||||||||
Dataset | |||||||||||||||||||||||||||||||||||||||
| Dataseries X: | |||||||||||||||||||||||||||||||||||||||
7.999311932 17.66072601 7.939614125 7.222427315 13.68493387 5.735709263 16.52022443 8.366068806 16.60066603 5.17611957 12.70560238 10.82757292 11.31729798 15.56557197 16.58759666 12.45935682 7.989708192 7.664694569 8.488614253 10.85943494 12.10136037 8.442744981 6.524777071 12.10453923 11.82586586 5.847332819 18.13868595 16.73262013 13.64878206 7.027546553 14.36099535 12.7884523 8.037999075 12.64663534 17.71054964 5.685701881 18.00427557 6.282796661 6.32013194 13.12033773 9.148088107 9.984658524 11.71186642 7.639565459 11.89647001 11.45238568 14.81183409 9.953169982 15.29445996 5.363784843 14.087736 7.110255206 14.84893093 17.60888482 11.16425484 14.62384779 13.31731353 12.89063323 6.318166528 8.644669319 17.37942452 15.28108882 12.64803899 13.6657977 11.96922272 18.53981263 8.398966814 15.3111066 4.736225125 8.643581134 12.0922447 6.214822935 13.16402154 6.785850907 8.893800576 12.41913234 23.94611303 7.620505459 33.32182164 12.77477964 13.06681662 7.00010666 9.181633076 5.707758557 8.083271204 15.64433274 7.5092413 15.05920824 13.58582741 16.06534232 7.978077318 9.889893309 6.636005135 12.58996711 9.697573377 5.239045106 8.376795021 16.29525041 9.601750707 8.303275554 22.21747337 10.18535467 9.256050789 18.89897404 21.78540513 19.98962254 4.250807167 8.309596157 10.00278295 5.669118802 11.16801398 5.858931689 12.0865324 4.863555019 23.12477423 10.11561636 8.903390146 14.63929559 19.89135131 11.53633693 16.10968452 17.72863451 18.80801192 8.924505103 7.364991448 15.09144501 20.66387027 8.518215248 7.161385687 4.04395717 8.674297454 12.59079233 6.791671221 12.19509418 15.23355223 10.35523179 9.990867563 8.576610641 8.734489947 13.59743933 9.540257745 3.650038425 13.24579076 14.6126061 15.29890533 9.213758964 6.915453713 5.573812801 4.580522752 11.31004599 | |||||||||||||||||||||||||||||||||||||||
Tables (Output of Computation) | |||||||||||||||||||||||||||||||||||||||
| |||||||||||||||||||||||||||||||||||||||
Figures (Output of Computation) | |||||||||||||||||||||||||||||||||||||||
Input Parameters & R Code | |||||||||||||||||||||||||||||||||||||||
| Parameters (Session): | |||||||||||||||||||||||||||||||||||||||
| par1 = 8 ; par2 = 0 ; | |||||||||||||||||||||||||||||||||||||||
| Parameters (R input): | |||||||||||||||||||||||||||||||||||||||
| par1 = 8 ; par2 = 0 ; | |||||||||||||||||||||||||||||||||||||||
| R code (references can be found in the software module): | |||||||||||||||||||||||||||||||||||||||
library(MASS) | |||||||||||||||||||||||||||||||||||||||