Free Statistics
of Irreproducible Research!
Description of Statistical Computation | |||||||||||||||||||||||||||||||||||||||
|---|---|---|---|---|---|---|---|---|---|---|---|---|---|---|---|---|---|---|---|---|---|---|---|---|---|---|---|---|---|---|---|---|---|---|---|---|---|---|---|
| Author's title | |||||||||||||||||||||||||||||||||||||||
| Author | *The author of this computation has been verified* | ||||||||||||||||||||||||||||||||||||||
| R Software Module | rwasp_fitdistrnorm.wasp | ||||||||||||||||||||||||||||||||||||||
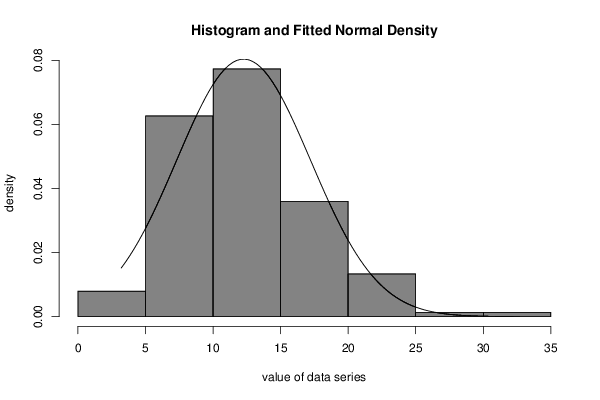
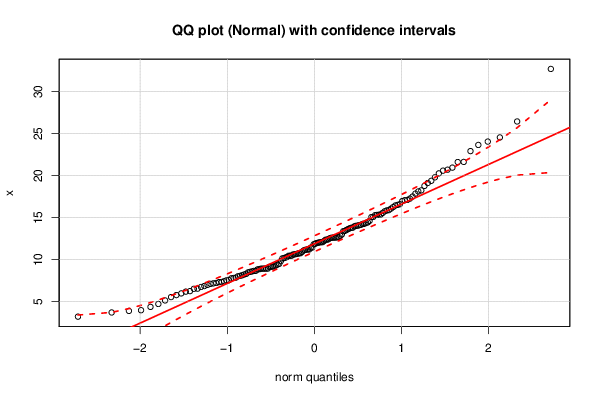
| Title produced by software | ML Fitting and QQ Plot- Normal Distribution | ||||||||||||||||||||||||||||||||||||||
| Date of computation | Tue, 13 Oct 2015 15:52:02 +0100 | ||||||||||||||||||||||||||||||||||||||
| Cite this page as follows | Statistical Computations at FreeStatistics.org, Office for Research Development and Education, URL https://freestatistics.org/blog/index.php?v=date/2015/Oct/13/t1444747975zy2ed0o59ug7m88.htm/, Retrieved Tue, 14 May 2024 06:49:30 +0000 | ||||||||||||||||||||||||||||||||||||||
| Statistical Computations at FreeStatistics.org, Office for Research Development and Education, URL https://freestatistics.org/blog/index.php?pk=282368, Retrieved Tue, 14 May 2024 06:49:30 +0000 | |||||||||||||||||||||||||||||||||||||||
| QR Codes: | |||||||||||||||||||||||||||||||||||||||
|
| |||||||||||||||||||||||||||||||||||||||
| Original text written by user: | |||||||||||||||||||||||||||||||||||||||
| IsPrivate? | No (this computation is public) | ||||||||||||||||||||||||||||||||||||||
| User-defined keywords | |||||||||||||||||||||||||||||||||||||||
| Estimated Impact | 125 | ||||||||||||||||||||||||||||||||||||||
Tree of Dependent Computations | |||||||||||||||||||||||||||||||||||||||
| Family? (F = Feedback message, R = changed R code, M = changed R Module, P = changed Parameters, D = changed Data) | |||||||||||||||||||||||||||||||||||||||
| - [ML Fitting and QQ Plot- Normal Distribution] [Hoofdstuk 3: Task...] [2015-10-13 14:52:02] [fdcee98729d8ae773847ef0dab21bb59] [Current] | |||||||||||||||||||||||||||||||||||||||
| Feedback Forum | |||||||||||||||||||||||||||||||||||||||
Post a new message | |||||||||||||||||||||||||||||||||||||||
Dataset | |||||||||||||||||||||||||||||||||||||||
| Dataseries X: | |||||||||||||||||||||||||||||||||||||||
15.07581435 21.61509186 20.95022547 8.645714182 32.70290465 7.5484963 3.967338 18.11141135 12.62413573 5.970316376 10.91115418 7.328521555 6.850200364 10.30512567 6.73480923 10.4539558 9.819114251 26.44833319 15.74874431 12.06622829 9.190160284 8.921940139 12.00219284 14.24374843 6.533832162 10.44834099 12.34844137 10.65804358 12.68961692 11.1419476 13.78540248 10.75807457 17.50436659 8.129942379 16.06305424 10.1743717 5.53257199 4.712234351 18.77191032 9.169024125 24.05332884 12.40783811 8.001447712 21.62976574 12.83600672 12.62527065 23.65173118 15.88755642 20.58807446 11.06528956 11.2079553 10.62327579 12.37468036 16.51230183 9.410509134 13.79463558 5.771586296 8.926107962 14.60989777 15.31298133 17.25894284 11.43159561 13.71780818 7.766223802 15.05793287 15.35958664 8.912656654 5.13087588 19.79625857 6.985437536 10.45654325 19.37916349 19.11694824 18.23712085 16.24595127 11.95447578 3.882709399 8.852709532 14.09685098 14.01978125 8.533015267 16.44133804 13.95693982 11.42784987 8.91437201 13.52397046 4.361672975 12.59572998 16.96483352 6.518663411 10.60419398 14.42758133 15.28304291 8.926073538 13.38203667 13.62869438 11.18467224 12.53723704 8.582326846 14.37362657 8.056916025 8.290735773 17.85062872 17.06868686 12.18871174 9.495104043 17.09883349 11.20109792 10.70877759 6.179038154 9.327615836 7.80305258 8.820351187 10.23905006 7.169439055 16.59516233 12.06984055 9.13472127 15.55795218 10.14109416 6.242139334 8.224853118 12.60622737 14.1365388 11.81188197 14.03083775 9.142359347 22.91750172 12.98246257 20.26485457 10.74163475 12.65351885 11.89484611 13.40926083 24.54670159 15.34082049 7.103684474 14.25241641 12.05294218 7.312433048 8.476252364 7.420293294 20.70065821 7.211882117 15.85130798 3.699491766 3.20080084 8.653003285 7.526084243 7.841069924 | |||||||||||||||||||||||||||||||||||||||
Tables (Output of Computation) | |||||||||||||||||||||||||||||||||||||||
| |||||||||||||||||||||||||||||||||||||||
Figures (Output of Computation) | |||||||||||||||||||||||||||||||||||||||
Input Parameters & R Code | |||||||||||||||||||||||||||||||||||||||
| Parameters (Session): | |||||||||||||||||||||||||||||||||||||||
| par1 = 8 ; par2 = 0 ; | |||||||||||||||||||||||||||||||||||||||
| Parameters (R input): | |||||||||||||||||||||||||||||||||||||||
| par1 = 8 ; par2 = 0 ; | |||||||||||||||||||||||||||||||||||||||
| R code (references can be found in the software module): | |||||||||||||||||||||||||||||||||||||||
library(MASS) | |||||||||||||||||||||||||||||||||||||||