Free Statistics
of Irreproducible Research!
Description of Statistical Computation | |||||||||||||||||||||||||||||||||||||||
|---|---|---|---|---|---|---|---|---|---|---|---|---|---|---|---|---|---|---|---|---|---|---|---|---|---|---|---|---|---|---|---|---|---|---|---|---|---|---|---|
| Author's title | |||||||||||||||||||||||||||||||||||||||
| Author | *The author of this computation has been verified* | ||||||||||||||||||||||||||||||||||||||
| R Software Module | rwasp_fitdistrnorm.wasp | ||||||||||||||||||||||||||||||||||||||
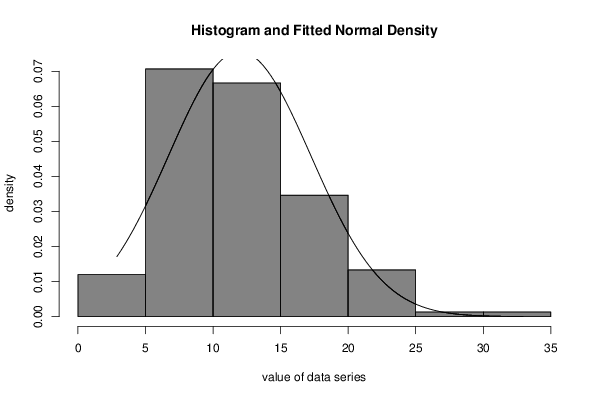
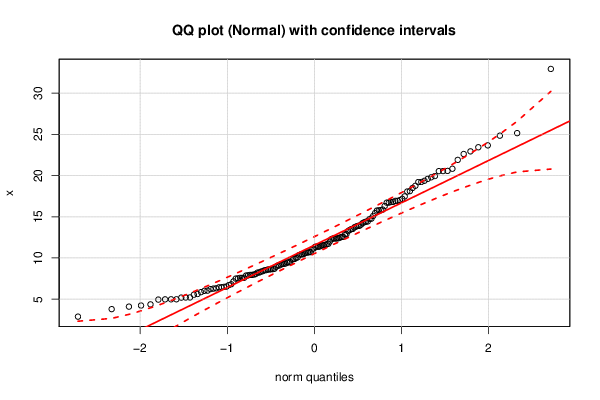
| Title produced by software | ML Fitting and QQ Plot- Normal Distribution | ||||||||||||||||||||||||||||||||||||||
| Date of computation | Tue, 13 Oct 2015 15:54:07 +0100 | ||||||||||||||||||||||||||||||||||||||
| Cite this page as follows | Statistical Computations at FreeStatistics.org, Office for Research Development and Education, URL https://freestatistics.org/blog/index.php?v=date/2015/Oct/13/t14447481025zdma3lmrpntmzl.htm/, Retrieved Wed, 02 Jul 2025 03:09:52 +0000 | ||||||||||||||||||||||||||||||||||||||
| Statistical Computations at FreeStatistics.org, Office for Research Development and Education, URL https://freestatistics.org/blog/index.php?pk=282370, Retrieved Wed, 02 Jul 2025 03:09:52 +0000 | |||||||||||||||||||||||||||||||||||||||
| QR Codes: | |||||||||||||||||||||||||||||||||||||||
|
| |||||||||||||||||||||||||||||||||||||||
| Original text written by user: | |||||||||||||||||||||||||||||||||||||||
| IsPrivate? | No (this computation is public) | ||||||||||||||||||||||||||||||||||||||
| User-defined keywords | |||||||||||||||||||||||||||||||||||||||
| Estimated Impact | 200 | ||||||||||||||||||||||||||||||||||||||
Tree of Dependent Computations | |||||||||||||||||||||||||||||||||||||||
| Family? (F = Feedback message, R = changed R code, M = changed R Module, P = changed Parameters, D = changed Data) | |||||||||||||||||||||||||||||||||||||||
| - [ML Fitting and QQ Plot- Normal Distribution] [Hoofdstuk 3: Task...] [2015-10-13 14:54:07] [fdcee98729d8ae773847ef0dab21bb59] [Current] | |||||||||||||||||||||||||||||||||||||||
| Feedback Forum | |||||||||||||||||||||||||||||||||||||||
Post a new message | |||||||||||||||||||||||||||||||||||||||
Dataset | |||||||||||||||||||||||||||||||||||||||
| Dataseries X: | |||||||||||||||||||||||||||||||||||||||
19.21558777 7.948034001 7.584584334 11.67528444 11.3795466 19.79877522 14.04664226 24.84564083 11.99062239 13.8881481 7.585704929 12.54906794 23.66969576 6.719388369 8.528876866 20.56953341 23.44267801 19.60500213 11.37472575 19.94743657 18.11724837 4.949104637 22.9454581 10.33969596 16.80342245 8.04681879 4.979395404 18.50310893 6.010926759 7.592789304 16.72059817 8.339488651 6.493750789 18.06777905 11.3772961 12.36996109 8.604536859 10.41646954 20.54449531 2.879364983 11.54594012 13.7201622 12.37829589 11.55766427 6.452594758 12.3756003 22.62175386 32.94735334 15.11128873 5.54072143 10.45956988 11.48256402 12.86493956 10.58493886 7.522564268 11.12629441 9.506726272 11.35894441 7.944559533 14.41455042 7.986704462 17.48404107 8.506028176 8.237112268 12.2709479 5.190393092 4.987862011 8.638718903 7.873083639 16.94441214 13.53309471 7.88854705 15.44233649 6.534451505 21.90895615 16.79376369 8.655232778 20.83452891 4.98438001 5.629279374 6.035797316 8.217806152 9.329142744 19.37269867 14.77231738 16.92882663 14.34617412 7.4965778 25.15665091 10.72418265 6.815243176 13.89446768 15.78023933 10.65095385 13.80304333 6.221803005 16.72017735 20.55314651 14.44057633 15.75570172 8.607021934 14.74083338 6.318869806 12.41045097 5.203505477 12.49980816 6.28076921 5.212021605 6.432562733 9.084920352 10.0132622 4.095107838 7.154322288 17.18618803 16.303433 8.39976384 9.301452449 9.211039448 9.468324368 19.22658843 13.26104265 3.791715115 12.35102388 9.879638715 10.70158986 9.806719776 9.265922662 13.49795285 5.858336324 8.689987426 9.458992715 12.88359236 9.859687773 4.231154371 4.370803026 17.02547414 18.76475393 11.71592733 10.07316809 15.79839934 10.67029007 15.87341325 9.073165566 12.55653975 13.39003363 11.05078286 8.927773163 10.43239507 11.59013458 14.23300019 | |||||||||||||||||||||||||||||||||||||||
Tables (Output of Computation) | |||||||||||||||||||||||||||||||||||||||
| |||||||||||||||||||||||||||||||||||||||
Figures (Output of Computation) | |||||||||||||||||||||||||||||||||||||||
Input Parameters & R Code | |||||||||||||||||||||||||||||||||||||||
| Parameters (Session): | |||||||||||||||||||||||||||||||||||||||
| par1 = 8 ; par2 = 0 ; | |||||||||||||||||||||||||||||||||||||||
| Parameters (R input): | |||||||||||||||||||||||||||||||||||||||
| par1 = 8 ; par2 = 0 ; | |||||||||||||||||||||||||||||||||||||||
| R code (references can be found in the software module): | |||||||||||||||||||||||||||||||||||||||
library(MASS) | |||||||||||||||||||||||||||||||||||||||