Free Statistics

of Irreproducible Research!

Author's title

Author*Unverified author*
R Software Modulerwasp_centraltendency.wasp
Title produced by softwareCentral Tendency
Date of computationSun, 18 Oct 2015 15:49:26 +0100
Cite this page as followsStatistical Computations at FreeStatistics.org, Office for Research Development and Education, URL https://freestatistics.org/blog/index.php?v=date/2015/Oct/18/t14451797968r3qtcbfb0ruyl8.htm/, Retrieved Tue, 14 May 2024 04:24:52 +0000
Statistical Computations at FreeStatistics.org, Office for Research Development and Education, URL https://freestatistics.org/blog/index.php?pk=282610, Retrieved Tue, 14 May 2024 04:24:52 +0000
QR Codes:

Original text written by user:
IsPrivate?No (this computation is public)
User-defined keywords
Estimated Impact149
Family? (F = Feedback message, R = changed R code, M = changed R Module, P = changed Parameters, D = changed Data)
-       [Central Tendency] [Centrummaten eige...] [2015-10-18 14:49:26] [4cb864837b76d57ed1be196f412f1dd6] [Current]
Feedback Forum

Post a new message
Dataseries X:
1795
1756
2237
1960
1829
2524
2077
2366
2185
2098
1836
1863
2044
2136
2931
3263
3328
3570
2313
1623
1316
1507
1419
1660
1790
1733
2086
1814
2241
1943
1773
2143
2087
1805
1913
2296
2500
2210
2526
2249
2024
2091
2045
1882
1831
1964
1763
1688
2149
1823
2094
2145
1791
1996
2097
1796
1963
2042
1746
2210
2949
3093
3718
3024
1522
1502
1373
1607
1768
1622
1447
1768


Summary of computational transaction
Raw Inputview raw input (R code)
Raw Outputview raw output of R engine
Computing time1 seconds
R Server'George Udny Yule' @ yule.wessa.net

\begin{tabular}{lllllllll}
\hline
Summary of computational transaction \tabularnewline
Raw Input & view raw input (R code)  \tabularnewline
Raw Output & view raw output of R engine  \tabularnewline
Computing time & 1 seconds \tabularnewline
R Server & 'George Udny Yule' @ yule.wessa.net \tabularnewline
\hline
\end{tabular}
%Source: https://freestatistics.org/blog/index.php?pk=282610&T=0

[TABLE]
[ROW][C]Summary of computational transaction[/C][/ROW]
[ROW][C]Raw Input[/C][C]view raw input (R code) [/C][/ROW]
[ROW][C]Raw Output[/C][C]view raw output of R engine [/C][/ROW]
[ROW][C]Computing time[/C][C]1 seconds[/C][/ROW]
[ROW][C]R Server[/C][C]'George Udny Yule' @ yule.wessa.net[/C][/ROW]
[/TABLE]
Source: https://freestatistics.org/blog/index.php?pk=282610&T=0

Globally Unique Identifier (entire table): ba.freestatistics.org/blog/index.php?pk=282610&T=0

As an alternative you can also use a QR Code:  

The GUIDs for individual cells are displayed in the table below:

Summary of computational transaction
Raw Inputview raw input (R code)
Raw Outputview raw output of R engine
Computing time1 seconds
R Server'George Udny Yule' @ yule.wessa.net


Central Tendency - Ungrouped Data
MeasureValueS.E.Value/S.E.
Arithmetic Mean2073.3055555555658.773771999044435.2760335952109
Geometric Mean2022.20104312585
Harmonic Mean1977.44584540601
Quadratic Mean2131.632056013
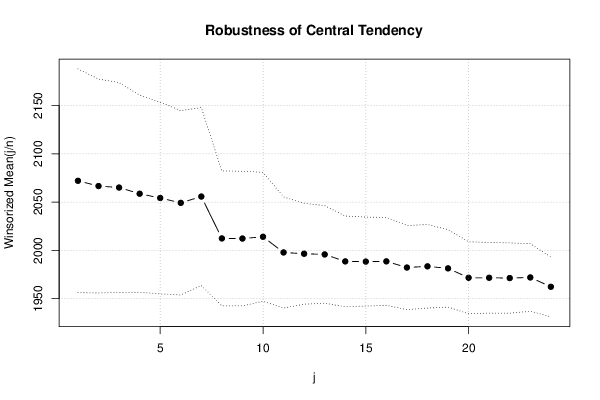
Winsorized Mean ( 1 / 24 )2072.0416666666757.854413759973235.8147552106079
Winsorized Mean ( 2 / 24 )2066.5972222222255.332123055525937.3489594850425
Winsorized Mean ( 3 / 24 )2065.0555555555654.286587688412338.0398850524243
Winsorized Mean ( 4 / 24 )2058.6666666666750.985683344477140.3773477499085
Winsorized Mean ( 5 / 24 )2054.2222222222249.587169821286141.4264865211246
Winsorized Mean ( 6 / 24 )2049.2222222222247.701127691376842.9596179671171
Winsorized Mean ( 7 / 24 )2055.7361111111146.022299287539744.668261754312
Winsorized Mean ( 8 / 24 )2012.4027777777834.901143981559257.6600806793346
Winsorized Mean ( 9 / 24 )2012.2777777777834.829684099244157.7747926752356
Winsorized Mean ( 10 / 24 )2014.0833333333333.353648445593460.3856977331494
Winsorized Mean ( 11 / 24 )1997.8888888888928.743867520114869.5066134538359
Winsorized Mean ( 12 / 24 )1996.5555555555626.08576417664576.5381279243146
Winsorized Mean ( 13 / 24 )1995.8333333333325.235642193784379.0878757119531
Winsorized Mean ( 14 / 24 )1988.6388888888923.483506561431584.6823656291161
Winsorized Mean ( 15 / 24 )1988.4305555555623.022288193689186.3698055912892
Winsorized Mean ( 16 / 24 )1988.6527777777822.732653533354587.4800108513475
Winsorized Mean ( 17 / 24 )1982.2777777777821.772180982142891.0463577077378
Winsorized Mean ( 18 / 24 )1983.5277777777821.599742907513291.8310827249631
Winsorized Mean ( 19 / 24 )1981.4166666666720.029777812485398.9235469916985
Winsorized Mean ( 20 / 24 )1971.6944444444418.6034900776916105.98519074702
Winsorized Mean ( 21 / 24 )1971.6944444444418.2881393327443107.812741830668
Winsorized Mean ( 22 / 24 )1971.3888888888918.1651327641562108.5259829633
Winsorized Mean ( 23 / 24 )1972.0277777777817.4796323707843112.818607162119
Winsorized Mean ( 24 / 24 )1962.3611111111115.4518448482953126.998499556356
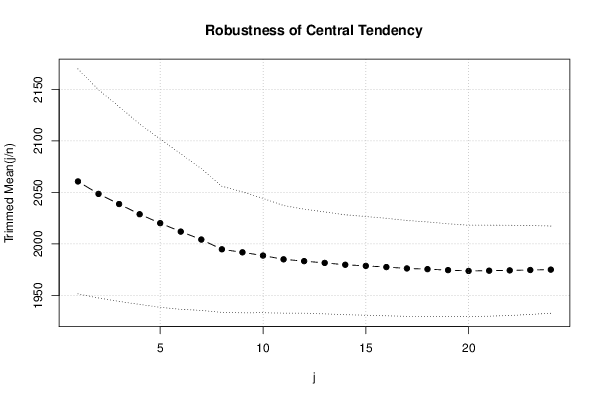
Trimmed Mean ( 1 / 24 )2060.6285714285754.542874170186137.7799777290604
Trimmed Mean ( 2 / 24 )2048.5441176470650.476054327789840.58447406257
Trimmed Mean ( 3 / 24 )2038.6969696969747.226552967795943.1684474428437
Trimmed Mean ( 4 / 24 )2028.812543.736998493293846.3866421997632
Trimmed Mean ( 5 / 24 )2020.1451612903240.80829831552549.5032933172267
Trimmed Mean ( 6 / 24 )2011.9666666666737.669293693700953.411319124444
Trimmed Mean ( 7 / 24 )2004.2586206896634.353545642513258.3421182065512
Trimmed Mean ( 8 / 24 )1994.8035714285730.578612970451465.2352535857718
Trimmed Mean ( 9 / 24 )1991.8703703703729.30801087169367.9633421418651
Trimmed Mean ( 10 / 24 )1988.7307692307727.725506432282971.7292855980132
Trimmed Mean ( 11 / 24 )1985.0826.09617752914576.0678454836154
Trimmed Mean ( 12 / 24 )1983.3333333333325.22041721392578.6399890418257
Trimmed Mean ( 13 / 24 )1981.6086956521724.705892787274480.2079371393073
Trimmed Mean ( 14 / 24 )1979.8181818181824.21052120300281.7751160835272
Trimmed Mean ( 15 / 24 )1978.738095238123.933610739380182.6761209073357
Trimmed Mean ( 16 / 24 )1977.57523.629264979290883.6917695803568
Trimmed Mean ( 17 / 24 )1976.2631578947423.245326675447285.0176547521767
Trimmed Mean ( 18 / 24 )1975.5555555555622.916357381270386.2072240665172
Trimmed Mean ( 19 / 24 )1974.6176470588222.453716099504687.9416858353522
Trimmed Mean ( 20 / 24 )1973.812522.163998230019889.0548934138872
Trimmed Mean ( 21 / 24 )1974.0666666666722.055308393955689.5052851406815
Trimmed Mean ( 22 / 24 )1974.3571428571421.879734667395990.2367955037056
Trimmed Mean ( 23 / 24 )1974.7307692307721.542770173437891.6655914412348
Trimmed Mean ( 24 / 24 )1975.0833333333321.146479875173393.4000999216964
Median1980
Midrange2517
Midmean - Weighted Average at Xnp1970.92307692308
Midmean - Weighted Average at X(n+1)p1981.89189189189
Midmean - Empirical Distribution Function1970.92307692308
Midmean - Empirical Distribution Function - Averaging1981.89189189189
Midmean - Empirical Distribution Function - Interpolation1981.89189189189
Midmean - Closest Observation1970.92307692308
Midmean - True Basic - Statistics Graphics Toolkit1981.89189189189
Midmean - MS Excel (old versions)1970.92307692308
Number of observations72

\begin{tabular}{lllllllll}
\hline
Central Tendency - Ungrouped Data \tabularnewline
Measure & Value & S.E. & Value/S.E. \tabularnewline
Arithmetic Mean & 2073.30555555556 & 58.7737719990444 & 35.2760335952109 \tabularnewline
Geometric Mean & 2022.20104312585 &  &  \tabularnewline
Harmonic Mean & 1977.44584540601 &  &  \tabularnewline
Quadratic Mean & 2131.632056013 &  &  \tabularnewline
Winsorized Mean ( 1 / 24 ) & 2072.04166666667 & 57.8544137599732 & 35.8147552106079 \tabularnewline
Winsorized Mean ( 2 / 24 ) & 2066.59722222222 & 55.3321230555259 & 37.3489594850425 \tabularnewline
Winsorized Mean ( 3 / 24 ) & 2065.05555555556 & 54.2865876884123 & 38.0398850524243 \tabularnewline
Winsorized Mean ( 4 / 24 ) & 2058.66666666667 & 50.9856833444771 & 40.3773477499085 \tabularnewline
Winsorized Mean ( 5 / 24 ) & 2054.22222222222 & 49.5871698212861 & 41.4264865211246 \tabularnewline
Winsorized Mean ( 6 / 24 ) & 2049.22222222222 & 47.7011276913768 & 42.9596179671171 \tabularnewline
Winsorized Mean ( 7 / 24 ) & 2055.73611111111 & 46.0222992875397 & 44.668261754312 \tabularnewline
Winsorized Mean ( 8 / 24 ) & 2012.40277777778 & 34.9011439815592 & 57.6600806793346 \tabularnewline
Winsorized Mean ( 9 / 24 ) & 2012.27777777778 & 34.8296840992441 & 57.7747926752356 \tabularnewline
Winsorized Mean ( 10 / 24 ) & 2014.08333333333 & 33.3536484455934 & 60.3856977331494 \tabularnewline
Winsorized Mean ( 11 / 24 ) & 1997.88888888889 & 28.7438675201148 & 69.5066134538359 \tabularnewline
Winsorized Mean ( 12 / 24 ) & 1996.55555555556 & 26.085764176645 & 76.5381279243146 \tabularnewline
Winsorized Mean ( 13 / 24 ) & 1995.83333333333 & 25.2356421937843 & 79.0878757119531 \tabularnewline
Winsorized Mean ( 14 / 24 ) & 1988.63888888889 & 23.4835065614315 & 84.6823656291161 \tabularnewline
Winsorized Mean ( 15 / 24 ) & 1988.43055555556 & 23.0222881936891 & 86.3698055912892 \tabularnewline
Winsorized Mean ( 16 / 24 ) & 1988.65277777778 & 22.7326535333545 & 87.4800108513475 \tabularnewline
Winsorized Mean ( 17 / 24 ) & 1982.27777777778 & 21.7721809821428 & 91.0463577077378 \tabularnewline
Winsorized Mean ( 18 / 24 ) & 1983.52777777778 & 21.5997429075132 & 91.8310827249631 \tabularnewline
Winsorized Mean ( 19 / 24 ) & 1981.41666666667 & 20.0297778124853 & 98.9235469916985 \tabularnewline
Winsorized Mean ( 20 / 24 ) & 1971.69444444444 & 18.6034900776916 & 105.98519074702 \tabularnewline
Winsorized Mean ( 21 / 24 ) & 1971.69444444444 & 18.2881393327443 & 107.812741830668 \tabularnewline
Winsorized Mean ( 22 / 24 ) & 1971.38888888889 & 18.1651327641562 & 108.5259829633 \tabularnewline
Winsorized Mean ( 23 / 24 ) & 1972.02777777778 & 17.4796323707843 & 112.818607162119 \tabularnewline
Winsorized Mean ( 24 / 24 ) & 1962.36111111111 & 15.4518448482953 & 126.998499556356 \tabularnewline
Trimmed Mean ( 1 / 24 ) & 2060.62857142857 & 54.5428741701861 & 37.7799777290604 \tabularnewline
Trimmed Mean ( 2 / 24 ) & 2048.54411764706 & 50.4760543277898 & 40.58447406257 \tabularnewline
Trimmed Mean ( 3 / 24 ) & 2038.69696969697 & 47.2265529677959 & 43.1684474428437 \tabularnewline
Trimmed Mean ( 4 / 24 ) & 2028.8125 & 43.7369984932938 & 46.3866421997632 \tabularnewline
Trimmed Mean ( 5 / 24 ) & 2020.14516129032 & 40.808298315525 & 49.5032933172267 \tabularnewline
Trimmed Mean ( 6 / 24 ) & 2011.96666666667 & 37.6692936937009 & 53.411319124444 \tabularnewline
Trimmed Mean ( 7 / 24 ) & 2004.25862068966 & 34.3535456425132 & 58.3421182065512 \tabularnewline
Trimmed Mean ( 8 / 24 ) & 1994.80357142857 & 30.5786129704514 & 65.2352535857718 \tabularnewline
Trimmed Mean ( 9 / 24 ) & 1991.87037037037 & 29.308010871693 & 67.9633421418651 \tabularnewline
Trimmed Mean ( 10 / 24 ) & 1988.73076923077 & 27.7255064322829 & 71.7292855980132 \tabularnewline
Trimmed Mean ( 11 / 24 ) & 1985.08 & 26.096177529145 & 76.0678454836154 \tabularnewline
Trimmed Mean ( 12 / 24 ) & 1983.33333333333 & 25.220417213925 & 78.6399890418257 \tabularnewline
Trimmed Mean ( 13 / 24 ) & 1981.60869565217 & 24.7058927872744 & 80.2079371393073 \tabularnewline
Trimmed Mean ( 14 / 24 ) & 1979.81818181818 & 24.210521203002 & 81.7751160835272 \tabularnewline
Trimmed Mean ( 15 / 24 ) & 1978.7380952381 & 23.9336107393801 & 82.6761209073357 \tabularnewline
Trimmed Mean ( 16 / 24 ) & 1977.575 & 23.6292649792908 & 83.6917695803568 \tabularnewline
Trimmed Mean ( 17 / 24 ) & 1976.26315789474 & 23.2453266754472 & 85.0176547521767 \tabularnewline
Trimmed Mean ( 18 / 24 ) & 1975.55555555556 & 22.9163573812703 & 86.2072240665172 \tabularnewline
Trimmed Mean ( 19 / 24 ) & 1974.61764705882 & 22.4537160995046 & 87.9416858353522 \tabularnewline
Trimmed Mean ( 20 / 24 ) & 1973.8125 & 22.1639982300198 & 89.0548934138872 \tabularnewline
Trimmed Mean ( 21 / 24 ) & 1974.06666666667 & 22.0553083939556 & 89.5052851406815 \tabularnewline
Trimmed Mean ( 22 / 24 ) & 1974.35714285714 & 21.8797346673959 & 90.2367955037056 \tabularnewline
Trimmed Mean ( 23 / 24 ) & 1974.73076923077 & 21.5427701734378 & 91.6655914412348 \tabularnewline
Trimmed Mean ( 24 / 24 ) & 1975.08333333333 & 21.1464798751733 & 93.4000999216964 \tabularnewline
Median & 1980 &  &  \tabularnewline
Midrange & 2517 &  &  \tabularnewline
Midmean - Weighted Average at Xnp & 1970.92307692308 &  &  \tabularnewline
Midmean - Weighted Average at X(n+1)p & 1981.89189189189 &  &  \tabularnewline
Midmean - Empirical Distribution Function & 1970.92307692308 &  &  \tabularnewline
Midmean - Empirical Distribution Function - Averaging & 1981.89189189189 &  &  \tabularnewline
Midmean - Empirical Distribution Function - Interpolation & 1981.89189189189 &  &  \tabularnewline
Midmean - Closest Observation & 1970.92307692308 &  &  \tabularnewline
Midmean - True Basic - Statistics Graphics Toolkit & 1981.89189189189 &  &  \tabularnewline
Midmean - MS Excel (old versions) & 1970.92307692308 &  &  \tabularnewline
Number of observations & 72 &  &  \tabularnewline
\hline
\end{tabular}
%Source: https://freestatistics.org/blog/index.php?pk=282610&T=1

[TABLE]
[ROW][C]Central Tendency - Ungrouped Data[/C][/ROW]
[ROW][C]Measure[/C][C]Value[/C][C]S.E.[/C][C]Value/S.E.[/C][/ROW]
[ROW][C]Arithmetic Mean[/C][C]2073.30555555556[/C][C]58.7737719990444[/C][C]35.2760335952109[/C][/ROW]
[ROW][C]Geometric Mean[/C][C]2022.20104312585[/C][C][/C][C][/C][/ROW]
[ROW][C]Harmonic Mean[/C][C]1977.44584540601[/C][C][/C][C][/C][/ROW]
[ROW][C]Quadratic Mean[/C][C]2131.632056013[/C][C][/C][C][/C][/ROW]
[ROW][C]Winsorized Mean ( 1 / 24 )[/C][C]2072.04166666667[/C][C]57.8544137599732[/C][C]35.8147552106079[/C][/ROW]
[ROW][C]Winsorized Mean ( 2 / 24 )[/C][C]2066.59722222222[/C][C]55.3321230555259[/C][C]37.3489594850425[/C][/ROW]
[ROW][C]Winsorized Mean ( 3 / 24 )[/C][C]2065.05555555556[/C][C]54.2865876884123[/C][C]38.0398850524243[/C][/ROW]
[ROW][C]Winsorized Mean ( 4 / 24 )[/C][C]2058.66666666667[/C][C]50.9856833444771[/C][C]40.3773477499085[/C][/ROW]
[ROW][C]Winsorized Mean ( 5 / 24 )[/C][C]2054.22222222222[/C][C]49.5871698212861[/C][C]41.4264865211246[/C][/ROW]
[ROW][C]Winsorized Mean ( 6 / 24 )[/C][C]2049.22222222222[/C][C]47.7011276913768[/C][C]42.9596179671171[/C][/ROW]
[ROW][C]Winsorized Mean ( 7 / 24 )[/C][C]2055.73611111111[/C][C]46.0222992875397[/C][C]44.668261754312[/C][/ROW]
[ROW][C]Winsorized Mean ( 8 / 24 )[/C][C]2012.40277777778[/C][C]34.9011439815592[/C][C]57.6600806793346[/C][/ROW]
[ROW][C]Winsorized Mean ( 9 / 24 )[/C][C]2012.27777777778[/C][C]34.8296840992441[/C][C]57.7747926752356[/C][/ROW]
[ROW][C]Winsorized Mean ( 10 / 24 )[/C][C]2014.08333333333[/C][C]33.3536484455934[/C][C]60.3856977331494[/C][/ROW]
[ROW][C]Winsorized Mean ( 11 / 24 )[/C][C]1997.88888888889[/C][C]28.7438675201148[/C][C]69.5066134538359[/C][/ROW]
[ROW][C]Winsorized Mean ( 12 / 24 )[/C][C]1996.55555555556[/C][C]26.085764176645[/C][C]76.5381279243146[/C][/ROW]
[ROW][C]Winsorized Mean ( 13 / 24 )[/C][C]1995.83333333333[/C][C]25.2356421937843[/C][C]79.0878757119531[/C][/ROW]
[ROW][C]Winsorized Mean ( 14 / 24 )[/C][C]1988.63888888889[/C][C]23.4835065614315[/C][C]84.6823656291161[/C][/ROW]
[ROW][C]Winsorized Mean ( 15 / 24 )[/C][C]1988.43055555556[/C][C]23.0222881936891[/C][C]86.3698055912892[/C][/ROW]
[ROW][C]Winsorized Mean ( 16 / 24 )[/C][C]1988.65277777778[/C][C]22.7326535333545[/C][C]87.4800108513475[/C][/ROW]
[ROW][C]Winsorized Mean ( 17 / 24 )[/C][C]1982.27777777778[/C][C]21.7721809821428[/C][C]91.0463577077378[/C][/ROW]
[ROW][C]Winsorized Mean ( 18 / 24 )[/C][C]1983.52777777778[/C][C]21.5997429075132[/C][C]91.8310827249631[/C][/ROW]
[ROW][C]Winsorized Mean ( 19 / 24 )[/C][C]1981.41666666667[/C][C]20.0297778124853[/C][C]98.9235469916985[/C][/ROW]
[ROW][C]Winsorized Mean ( 20 / 24 )[/C][C]1971.69444444444[/C][C]18.6034900776916[/C][C]105.98519074702[/C][/ROW]
[ROW][C]Winsorized Mean ( 21 / 24 )[/C][C]1971.69444444444[/C][C]18.2881393327443[/C][C]107.812741830668[/C][/ROW]
[ROW][C]Winsorized Mean ( 22 / 24 )[/C][C]1971.38888888889[/C][C]18.1651327641562[/C][C]108.5259829633[/C][/ROW]
[ROW][C]Winsorized Mean ( 23 / 24 )[/C][C]1972.02777777778[/C][C]17.4796323707843[/C][C]112.818607162119[/C][/ROW]
[ROW][C]Winsorized Mean ( 24 / 24 )[/C][C]1962.36111111111[/C][C]15.4518448482953[/C][C]126.998499556356[/C][/ROW]
[ROW][C]Trimmed Mean ( 1 / 24 )[/C][C]2060.62857142857[/C][C]54.5428741701861[/C][C]37.7799777290604[/C][/ROW]
[ROW][C]Trimmed Mean ( 2 / 24 )[/C][C]2048.54411764706[/C][C]50.4760543277898[/C][C]40.58447406257[/C][/ROW]
[ROW][C]Trimmed Mean ( 3 / 24 )[/C][C]2038.69696969697[/C][C]47.2265529677959[/C][C]43.1684474428437[/C][/ROW]
[ROW][C]Trimmed Mean ( 4 / 24 )[/C][C]2028.8125[/C][C]43.7369984932938[/C][C]46.3866421997632[/C][/ROW]
[ROW][C]Trimmed Mean ( 5 / 24 )[/C][C]2020.14516129032[/C][C]40.808298315525[/C][C]49.5032933172267[/C][/ROW]
[ROW][C]Trimmed Mean ( 6 / 24 )[/C][C]2011.96666666667[/C][C]37.6692936937009[/C][C]53.411319124444[/C][/ROW]
[ROW][C]Trimmed Mean ( 7 / 24 )[/C][C]2004.25862068966[/C][C]34.3535456425132[/C][C]58.3421182065512[/C][/ROW]
[ROW][C]Trimmed Mean ( 8 / 24 )[/C][C]1994.80357142857[/C][C]30.5786129704514[/C][C]65.2352535857718[/C][/ROW]
[ROW][C]Trimmed Mean ( 9 / 24 )[/C][C]1991.87037037037[/C][C]29.308010871693[/C][C]67.9633421418651[/C][/ROW]
[ROW][C]Trimmed Mean ( 10 / 24 )[/C][C]1988.73076923077[/C][C]27.7255064322829[/C][C]71.7292855980132[/C][/ROW]
[ROW][C]Trimmed Mean ( 11 / 24 )[/C][C]1985.08[/C][C]26.096177529145[/C][C]76.0678454836154[/C][/ROW]
[ROW][C]Trimmed Mean ( 12 / 24 )[/C][C]1983.33333333333[/C][C]25.220417213925[/C][C]78.6399890418257[/C][/ROW]
[ROW][C]Trimmed Mean ( 13 / 24 )[/C][C]1981.60869565217[/C][C]24.7058927872744[/C][C]80.2079371393073[/C][/ROW]
[ROW][C]Trimmed Mean ( 14 / 24 )[/C][C]1979.81818181818[/C][C]24.210521203002[/C][C]81.7751160835272[/C][/ROW]
[ROW][C]Trimmed Mean ( 15 / 24 )[/C][C]1978.7380952381[/C][C]23.9336107393801[/C][C]82.6761209073357[/C][/ROW]
[ROW][C]Trimmed Mean ( 16 / 24 )[/C][C]1977.575[/C][C]23.6292649792908[/C][C]83.6917695803568[/C][/ROW]
[ROW][C]Trimmed Mean ( 17 / 24 )[/C][C]1976.26315789474[/C][C]23.2453266754472[/C][C]85.0176547521767[/C][/ROW]
[ROW][C]Trimmed Mean ( 18 / 24 )[/C][C]1975.55555555556[/C][C]22.9163573812703[/C][C]86.2072240665172[/C][/ROW]
[ROW][C]Trimmed Mean ( 19 / 24 )[/C][C]1974.61764705882[/C][C]22.4537160995046[/C][C]87.9416858353522[/C][/ROW]
[ROW][C]Trimmed Mean ( 20 / 24 )[/C][C]1973.8125[/C][C]22.1639982300198[/C][C]89.0548934138872[/C][/ROW]
[ROW][C]Trimmed Mean ( 21 / 24 )[/C][C]1974.06666666667[/C][C]22.0553083939556[/C][C]89.5052851406815[/C][/ROW]
[ROW][C]Trimmed Mean ( 22 / 24 )[/C][C]1974.35714285714[/C][C]21.8797346673959[/C][C]90.2367955037056[/C][/ROW]
[ROW][C]Trimmed Mean ( 23 / 24 )[/C][C]1974.73076923077[/C][C]21.5427701734378[/C][C]91.6655914412348[/C][/ROW]
[ROW][C]Trimmed Mean ( 24 / 24 )[/C][C]1975.08333333333[/C][C]21.1464798751733[/C][C]93.4000999216964[/C][/ROW]
[ROW][C]Median[/C][C]1980[/C][C][/C][C][/C][/ROW]
[ROW][C]Midrange[/C][C]2517[/C][C][/C][C][/C][/ROW]
[ROW][C]Midmean - Weighted Average at Xnp[/C][C]1970.92307692308[/C][C][/C][C][/C][/ROW]
[ROW][C]Midmean - Weighted Average at X(n+1)p[/C][C]1981.89189189189[/C][C][/C][C][/C][/ROW]
[ROW][C]Midmean - Empirical Distribution Function[/C][C]1970.92307692308[/C][C][/C][C][/C][/ROW]
[ROW][C]Midmean - Empirical Distribution Function - Averaging[/C][C]1981.89189189189[/C][C][/C][C][/C][/ROW]
[ROW][C]Midmean - Empirical Distribution Function - Interpolation[/C][C]1981.89189189189[/C][C][/C][C][/C][/ROW]
[ROW][C]Midmean - Closest Observation[/C][C]1970.92307692308[/C][C][/C][C][/C][/ROW]
[ROW][C]Midmean - True Basic - Statistics Graphics Toolkit[/C][C]1981.89189189189[/C][C][/C][C][/C][/ROW]
[ROW][C]Midmean - MS Excel (old versions)[/C][C]1970.92307692308[/C][C][/C][C][/C][/ROW]
[ROW][C]Number of observations[/C][C]72[/C][C][/C][C][/C][/ROW]
[/TABLE]
Source: https://freestatistics.org/blog/index.php?pk=282610&T=1

Globally Unique Identifier (entire table): ba.freestatistics.org/blog/index.php?pk=282610&T=1

As an alternative you can also use a QR Code:  

The GUIDs for individual cells are displayed in the table below:

Central Tendency - Ungrouped Data
MeasureValueS.E.Value/S.E.
Arithmetic Mean2073.3055555555658.773771999044435.2760335952109
Geometric Mean2022.20104312585
Harmonic Mean1977.44584540601
Quadratic Mean2131.632056013
Winsorized Mean ( 1 / 24 )2072.0416666666757.854413759973235.8147552106079
Winsorized Mean ( 2 / 24 )2066.5972222222255.332123055525937.3489594850425
Winsorized Mean ( 3 / 24 )2065.0555555555654.286587688412338.0398850524243
Winsorized Mean ( 4 / 24 )2058.6666666666750.985683344477140.3773477499085
Winsorized Mean ( 5 / 24 )2054.2222222222249.587169821286141.4264865211246
Winsorized Mean ( 6 / 24 )2049.2222222222247.701127691376842.9596179671171
Winsorized Mean ( 7 / 24 )2055.7361111111146.022299287539744.668261754312
Winsorized Mean ( 8 / 24 )2012.4027777777834.901143981559257.6600806793346
Winsorized Mean ( 9 / 24 )2012.2777777777834.829684099244157.7747926752356
Winsorized Mean ( 10 / 24 )2014.0833333333333.353648445593460.3856977331494
Winsorized Mean ( 11 / 24 )1997.8888888888928.743867520114869.5066134538359
Winsorized Mean ( 12 / 24 )1996.5555555555626.08576417664576.5381279243146
Winsorized Mean ( 13 / 24 )1995.8333333333325.235642193784379.0878757119531
Winsorized Mean ( 14 / 24 )1988.6388888888923.483506561431584.6823656291161
Winsorized Mean ( 15 / 24 )1988.4305555555623.022288193689186.3698055912892
Winsorized Mean ( 16 / 24 )1988.6527777777822.732653533354587.4800108513475
Winsorized Mean ( 17 / 24 )1982.2777777777821.772180982142891.0463577077378
Winsorized Mean ( 18 / 24 )1983.5277777777821.599742907513291.8310827249631
Winsorized Mean ( 19 / 24 )1981.4166666666720.029777812485398.9235469916985
Winsorized Mean ( 20 / 24 )1971.6944444444418.6034900776916105.98519074702
Winsorized Mean ( 21 / 24 )1971.6944444444418.2881393327443107.812741830668
Winsorized Mean ( 22 / 24 )1971.3888888888918.1651327641562108.5259829633
Winsorized Mean ( 23 / 24 )1972.0277777777817.4796323707843112.818607162119
Winsorized Mean ( 24 / 24 )1962.3611111111115.4518448482953126.998499556356
Trimmed Mean ( 1 / 24 )2060.6285714285754.542874170186137.7799777290604
Trimmed Mean ( 2 / 24 )2048.5441176470650.476054327789840.58447406257
Trimmed Mean ( 3 / 24 )2038.6969696969747.226552967795943.1684474428437
Trimmed Mean ( 4 / 24 )2028.812543.736998493293846.3866421997632
Trimmed Mean ( 5 / 24 )2020.1451612903240.80829831552549.5032933172267
Trimmed Mean ( 6 / 24 )2011.9666666666737.669293693700953.411319124444
Trimmed Mean ( 7 / 24 )2004.2586206896634.353545642513258.3421182065512
Trimmed Mean ( 8 / 24 )1994.8035714285730.578612970451465.2352535857718
Trimmed Mean ( 9 / 24 )1991.8703703703729.30801087169367.9633421418651
Trimmed Mean ( 10 / 24 )1988.7307692307727.725506432282971.7292855980132
Trimmed Mean ( 11 / 24 )1985.0826.09617752914576.0678454836154
Trimmed Mean ( 12 / 24 )1983.3333333333325.22041721392578.6399890418257
Trimmed Mean ( 13 / 24 )1981.6086956521724.705892787274480.2079371393073
Trimmed Mean ( 14 / 24 )1979.8181818181824.21052120300281.7751160835272
Trimmed Mean ( 15 / 24 )1978.738095238123.933610739380182.6761209073357
Trimmed Mean ( 16 / 24 )1977.57523.629264979290883.6917695803568
Trimmed Mean ( 17 / 24 )1976.2631578947423.245326675447285.0176547521767
Trimmed Mean ( 18 / 24 )1975.5555555555622.916357381270386.2072240665172
Trimmed Mean ( 19 / 24 )1974.6176470588222.453716099504687.9416858353522
Trimmed Mean ( 20 / 24 )1973.812522.163998230019889.0548934138872
Trimmed Mean ( 21 / 24 )1974.0666666666722.055308393955689.5052851406815
Trimmed Mean ( 22 / 24 )1974.3571428571421.879734667395990.2367955037056
Trimmed Mean ( 23 / 24 )1974.7307692307721.542770173437891.6655914412348
Trimmed Mean ( 24 / 24 )1975.0833333333321.146479875173393.4000999216964
Median1980
Midrange2517
Midmean - Weighted Average at Xnp1970.92307692308
Midmean - Weighted Average at X(n+1)p1981.89189189189
Midmean - Empirical Distribution Function1970.92307692308
Midmean - Empirical Distribution Function - Averaging1981.89189189189
Midmean - Empirical Distribution Function - Interpolation1981.89189189189
Midmean - Closest Observation1970.92307692308
Midmean - True Basic - Statistics Graphics Toolkit1981.89189189189
Midmean - MS Excel (old versions)1970.92307692308
Number of observations72


Parameters (Session):
Parameters (R input):
R code (references can be found in the software module):
geomean <- function(x) {
return(exp(mean(log(x))))
}
harmean <- function(x) {
return(1/mean(1/x))
}
quamean <- function(x) {
return(sqrt(mean(x*x)))
}
winmean <- function(x) {
x <-sort(x[!is.na(x)])
n<-length(x)
denom <- 3
nodenom <- n/denom
if (nodenom>40) denom <- n/40
sqrtn = sqrt(n)
roundnodenom = floor(nodenom)
win <- array(NA,dim=c(roundnodenom,2))
for (j in 1:roundnodenom) {
win[j,1] <- (j*x[j+1]+sum(x[(j+1):(n-j)])+j*x[n-j])/n
win[j,2] <- sd(c(rep(x[j+1],j),x[(j+1):(n-j)],rep(x[n-j],j)))/sqrtn
}
return(win)
}
trimean <- function(x) {
x <-sort(x[!is.na(x)])
n<-length(x)
denom <- 3
nodenom <- n/denom
if (nodenom>40) denom <- n/40
sqrtn = sqrt(n)
roundnodenom = floor(nodenom)
tri <- array(NA,dim=c(roundnodenom,2))
for (j in 1:roundnodenom) {
tri[j,1] <- mean(x,trim=j/n)
tri[j,2] <- sd(x[(j+1):(n-j)]) / sqrt(n-j*2)
}
return(tri)
}
midrange <- function(x) {
return((max(x)+min(x))/2)
}
q1 <- function(data,n,p,i,f) {
np <- n*p;
i <<- floor(np)
f <<- np - i
qvalue <- (1-f)*data[i] + f*data[i+1]
}
q2 <- function(data,n,p,i,f) {
np <- (n+1)*p
i <<- floor(np)
f <<- np - i
qvalue <- (1-f)*data[i] + f*data[i+1]
}
q3 <- function(data,n,p,i,f) {
np <- n*p
i <<- floor(np)
f <<- np - i
if (f==0) {
qvalue <- data[i]
} else {
qvalue <- data[i+1]
}
}
q4 <- function(data,n,p,i,f) {
np <- n*p
i <<- floor(np)
f <<- np - i
if (f==0) {
qvalue <- (data[i]+data[i+1])/2
} else {
qvalue <- data[i+1]
}
}
q5 <- function(data,n,p,i,f) {
np <- (n-1)*p
i <<- floor(np)
f <<- np - i
if (f==0) {
qvalue <- data[i+1]
} else {
qvalue <- data[i+1] + f*(data[i+2]-data[i+1])
}
}
q6 <- function(data,n,p,i,f) {
np <- n*p+0.5
i <<- floor(np)
f <<- np - i
qvalue <- data[i]
}
q7 <- function(data,n,p,i,f) {
np <- (n+1)*p
i <<- floor(np)
f <<- np - i
if (f==0) {
qvalue <- data[i]
} else {
qvalue <- f*data[i] + (1-f)*data[i+1]
}
}
q8 <- function(data,n,p,i,f) {
np <- (n+1)*p
i <<- floor(np)
f <<- np - i
if (f==0) {
qvalue <- data[i]
} else {
if (f == 0.5) {
qvalue <- (data[i]+data[i+1])/2
} else {
if (f < 0.5) {
qvalue <- data[i]
} else {
qvalue <- data[i+1]
}
}
}
}
midmean <- function(x,def) {
x <-sort(x[!is.na(x)])
n<-length(x)
if (def==1) {
qvalue1 <- q1(x,n,0.25,i,f)
qvalue3 <- q1(x,n,0.75,i,f)
}
if (def==2) {
qvalue1 <- q2(x,n,0.25,i,f)
qvalue3 <- q2(x,n,0.75,i,f)
}
if (def==3) {
qvalue1 <- q3(x,n,0.25,i,f)
qvalue3 <- q3(x,n,0.75,i,f)
}
if (def==4) {
qvalue1 <- q4(x,n,0.25,i,f)
qvalue3 <- q4(x,n,0.75,i,f)
}
if (def==5) {
qvalue1 <- q5(x,n,0.25,i,f)
qvalue3 <- q5(x,n,0.75,i,f)
}
if (def==6) {
qvalue1 <- q6(x,n,0.25,i,f)
qvalue3 <- q6(x,n,0.75,i,f)
}
if (def==7) {
qvalue1 <- q7(x,n,0.25,i,f)
qvalue3 <- q7(x,n,0.75,i,f)
}
if (def==8) {
qvalue1 <- q8(x,n,0.25,i,f)
qvalue3 <- q8(x,n,0.75,i,f)
}
midm <- 0
myn <- 0
roundno4 <- round(n/4)
round3no4 <- round(3*n/4)
for (i in 1:n) {
if ((x[i]>=qvalue1) & (x[i]<=qvalue3)){
midm = midm + x[i]
myn = myn + 1
}
}
midm = midm / myn
return(midm)
}
(arm <- mean(x))
sqrtn <- sqrt(length(x))
(armse <- sd(x) / sqrtn)
(armose <- arm / armse)
(geo <- geomean(x))
(har <- harmean(x))
(qua <- quamean(x))
(win <- winmean(x))
(tri <- trimean(x))
(midr <- midrange(x))
midm <- array(NA,dim=8)
for (j in 1:8) midm[j] <- midmean(x,j)
midm
bitmap(file='test1.png')
lb <- win[,1] - 2*win[,2]
ub <- win[,1] + 2*win[,2]
if ((ylimmin == '') | (ylimmax == '')) plot(win[,1],type='b',main=main, xlab='j', pch=19, ylab='Winsorized Mean(j/n)', ylim=c(min(lb),max(ub))) else plot(win[,1],type='l',main=main, xlab='j', pch=19, ylab='Winsorized Mean(j/n)', ylim=c(ylimmin,ylimmax))
lines(ub,lty=3)
lines(lb,lty=3)
grid()
dev.off()
bitmap(file='test2.png')
lb <- tri[,1] - 2*tri[,2]
ub <- tri[,1] + 2*tri[,2]
if ((ylimmin == '') | (ylimmax == '')) plot(tri[,1],type='b',main=main, xlab='j', pch=19, ylab='Trimmed Mean(j/n)', ylim=c(min(lb),max(ub))) else plot(tri[,1],type='l',main=main, xlab='j', pch=19, ylab='Trimmed Mean(j/n)', ylim=c(ylimmin,ylimmax))
lines(ub,lty=3)
lines(lb,lty=3)
grid()
dev.off()
load(file='createtable')
a<-table.start()
a<-table.row.start(a)
a<-table.element(a,'Central Tendency - Ungrouped Data',4,TRUE)
a<-table.row.end(a)
a<-table.row.start(a)
a<-table.element(a,'Measure',header=TRUE)
a<-table.element(a,'Value',header=TRUE)
a<-table.element(a,'S.E.',header=TRUE)
a<-table.element(a,'Value/S.E.',header=TRUE)
a<-table.row.end(a)
a<-table.row.start(a)
a<-table.element(a,hyperlink('arithmetic_mean.htm', 'Arithmetic Mean', 'click to view the definition of the Arithmetic Mean'),header=TRUE)
a<-table.element(a,arm)
a<-table.element(a,hyperlink('arithmetic_mean_standard_error.htm', armse, 'click to view the definition of the Standard Error of the Arithmetic Mean'))
a<-table.element(a,armose)
a<-table.row.end(a)
a<-table.row.start(a)
a<-table.element(a,hyperlink('geometric_mean.htm', 'Geometric Mean', 'click to view the definition of the Geometric Mean'),header=TRUE)
a<-table.element(a,geo)
a<-table.element(a,'')
a<-table.row.end(a)
a<-table.row.start(a)
a<-table.element(a,hyperlink('harmonic_mean.htm', 'Harmonic Mean', 'click to view the definition of the Harmonic Mean'),header=TRUE)
a<-table.element(a,har)
a<-table.element(a,'')
a<-table.row.end(a)
a<-table.row.start(a)
a<-table.element(a,hyperlink('quadratic_mean.htm', 'Quadratic Mean', 'click to view the definition of the Quadratic Mean'),header=TRUE)
a<-table.element(a,qua)
a<-table.element(a,'')
a<-table.row.end(a)
for (j in 1:length(win[,1])) {
a<-table.row.start(a)
mylabel <- paste('Winsorized Mean (',j)
mylabel <- paste(mylabel,'/')
mylabel <- paste(mylabel,length(win[,1]))
mylabel <- paste(mylabel,')')
a<-table.element(a,hyperlink('winsorized_mean.htm', mylabel, 'click to view the definition of the Winsorized Mean'),header=TRUE)
a<-table.element(a,win[j,1])
a<-table.element(a,win[j,2])
a<-table.element(a,win[j,1]/win[j,2])
a<-table.row.end(a)
}
for (j in 1:length(tri[,1])) {
a<-table.row.start(a)
mylabel <- paste('Trimmed Mean (',j)
mylabel <- paste(mylabel,'/')
mylabel <- paste(mylabel,length(tri[,1]))
mylabel <- paste(mylabel,')')
a<-table.element(a,hyperlink('arithmetic_mean.htm', mylabel, 'click to view the definition of the Trimmed Mean'),header=TRUE)
a<-table.element(a,tri[j,1])
a<-table.element(a,tri[j,2])
a<-table.element(a,tri[j,1]/tri[j,2])
a<-table.row.end(a)
}
a<-table.row.start(a)
a<-table.element(a,hyperlink('median_1.htm', 'Median', 'click to view the definition of the Median'),header=TRUE)
a<-table.element(a,median(x))
a<-table.element(a,'')
a<-table.row.end(a)
a<-table.row.start(a)
a<-table.element(a,hyperlink('midrange.htm', 'Midrange', 'click to view the definition of the Midrange'),header=TRUE)
a<-table.element(a,midr)
a<-table.element(a,'')
a<-table.row.end(a)
a<-table.row.start(a)
mymid <- hyperlink('midmean.htm', 'Midmean', 'click to view the definition of the Midmean')
mylabel <- paste(mymid,hyperlink('method_1.htm','Weighted Average at Xnp',''),sep=' - ')
a<-table.element(a,mylabel,header=TRUE)
a<-table.element(a,midm[1])
a<-table.element(a,'')
a<-table.row.end(a)
a<-table.row.start(a)
mymid <- hyperlink('midmean.htm', 'Midmean', 'click to view the definition of the Midmean')
mylabel <- paste(mymid,hyperlink('method_2.htm','Weighted Average at X(n+1)p',''),sep=' - ')
a<-table.element(a,mylabel,header=TRUE)
a<-table.element(a,midm[2])
a<-table.element(a,'')
a<-table.row.end(a)
a<-table.row.start(a)
mymid <- hyperlink('midmean.htm', 'Midmean', 'click to view the definition of the Midmean')
mylabel <- paste(mymid,hyperlink('method_3.htm','Empirical Distribution Function',''),sep=' - ')
a<-table.element(a,mylabel,header=TRUE)
a<-table.element(a,midm[3])
a<-table.element(a,'')
a<-table.row.end(a)
a<-table.row.start(a)
mymid <- hyperlink('midmean.htm', 'Midmean', 'click to view the definition of the Midmean')
mylabel <- paste(mymid,hyperlink('method_4.htm','Empirical Distribution Function - Averaging',''),sep=' - ')
a<-table.element(a,mylabel,header=TRUE)
a<-table.element(a,midm[4])
a<-table.element(a,'')
a<-table.row.end(a)
a<-table.row.start(a)
mymid <- hyperlink('midmean.htm', 'Midmean', 'click to view the definition of the Midmean')
mylabel <- paste(mymid,hyperlink('method_5.htm','Empirical Distribution Function - Interpolation',''),sep=' - ')
a<-table.element(a,mylabel,header=TRUE)
a<-table.element(a,midm[5])
a<-table.element(a,'')
a<-table.row.end(a)
a<-table.row.start(a)
mymid <- hyperlink('midmean.htm', 'Midmean', 'click to view the definition of the Midmean')
mylabel <- paste(mymid,hyperlink('method_6.htm','Closest Observation',''),sep=' - ')
a<-table.element(a,mylabel,header=TRUE)
a<-table.element(a,midm[6])
a<-table.element(a,'')
a<-table.row.end(a)
a<-table.row.start(a)
mymid <- hyperlink('midmean.htm', 'Midmean', 'click to view the definition of the Midmean')
mylabel <- paste(mymid,hyperlink('method_7.htm','True Basic - Statistics Graphics Toolkit',''),sep=' - ')
a<-table.element(a,mylabel,header=TRUE)
a<-table.element(a,midm[7])
a<-table.element(a,'')
a<-table.row.end(a)
a<-table.row.start(a)
mymid <- hyperlink('midmean.htm', 'Midmean', 'click to view the definition of the Midmean')
mylabel <- paste(mymid,hyperlink('method_8.htm','MS Excel (old versions)',''),sep=' - ')
a<-table.element(a,mylabel,header=TRUE)
a<-table.element(a,midm[8])
a<-table.element(a,'')
a<-table.row.end(a)
a<-table.row.start(a)
a<-table.element(a,'Number of observations',header=TRUE)
a<-table.element(a,length(x))
a<-table.element(a,'')
a<-table.row.end(a)
a<-table.end(a)
table.save(a,file='mytable.tab')