Free Statistics

of Irreproducible Research!

Author's title

Author*The author of this computation has been verified*
R Software Modulerwasp_histogram.wasp
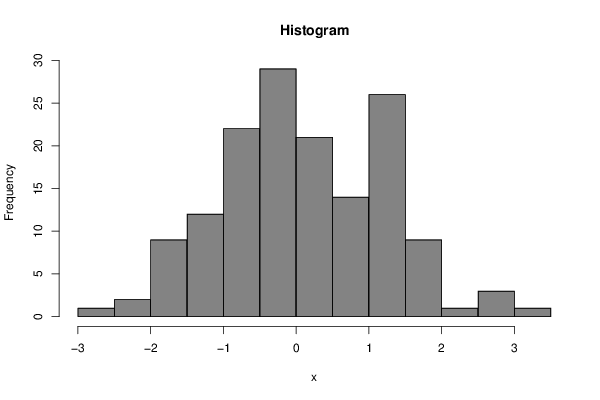
Title produced by softwareHistogram
Date of computationMon, 19 Oct 2015 16:23:45 +0100
Cite this page as followsStatistical Computations at FreeStatistics.org, Office for Research Development and Education, URL https://freestatistics.org/blog/index.php?v=date/2015/Oct/19/t1445268407izeht0752u26ide.htm/, Retrieved Tue, 14 May 2024 06:47:36 +0000
Statistical Computations at FreeStatistics.org, Office for Research Development and Education, URL https://freestatistics.org/blog/index.php?pk=282666, Retrieved Tue, 14 May 2024 06:47:36 +0000
QR Codes:

Original text written by user:
IsPrivate?No (this computation is public)
User-defined keywords
Estimated Impact56
Family? (F = Feedback message, R = changed R code, M = changed R Module, P = changed Parameters, D = changed Data)
-       [Histogram] [Task 3 Boudewijn ...] [2015-10-19 15:23:45] [60e7016130b28a0c8bd4011f80276a66] [Current]
Feedback Forum

Post a new message
Dataseries X:
-1.299916663
0.1884719613
0.05838156396
0.5093151731
1.31272113
-0.1304945692
0.3725055164
-0.5499759343
-0.6967597071
1.112034826
1.370482656
-0.1750114035
-0.1752429122
1.156007102
-0.1819366812
-1.288829354
-0.1573992949
1.419335663
-1.917665431
-0.4508939494
-1.931970739
-0.6504155989
-0.9736268635
-0.7944732244
-0.6861797408
0.1975275493
1.325773885
-0.04214209448
-1.728263306
0.7125841242
-1.792946872
0.4005898175
-0.2881321908
-2.239872365
-0.3920731506
1.273525125
1.103844858
-0.1393296612
0.7594643691
1.211900984
0.6599319935
-0.3490766567
1.190116145
-0.5816142599
-0.2000079972
-0.7332693054
2.151617507
1.256951579
0.03832716464
-0.3521209543
0.4667666728
1.768620958
1.292395144
-0.235217552
0.7990784653
0.1090892455
0.6133998414
-0.2329583707
-0.6556878519
-1.091778622
-0.6612430777
-2.94612105
-2.056124843
0.551424181
2.666434937
-0.7335526186
-0.3798989136
1.38289334
-0.3488289378
1.20201579
1.533403298
-0.1692645449
0.6225618849
-0.3499720683
-0.6386968225
0.4539651432
-0.9749707474
-0.8499628341
1.09933319
-1.088622878
-1.320338928
1.671516316
0.2838155993
-1.147706775
0.4679270678
0.2155419059
1.636515492
1.729184585
0.4372698037
-0.6616461585
1.131169198
-0.4678314368
1.328570322
-1.403210056
-1.518112415
-0.5546191141
-0.4745109955
-1.084404369
1.053434578
1.425222765
-0.5743186471
-1.123391654
0.1933801173
-1.299517169
1.233888988
-0.07018270534
-0.01387122401
-1.805665665
-1.823094763
1.526297851
-1.571177073
0.8682072802
1.140416026
1.173021125
0.0291210346
-0.01246486712
0.727715883
0.4095388145
1.824851223
1.309377425
0.7402984735
-0.2934576427
-1.174460657
1.191916363
0.08032260499
0.2862977658
0.8758122862
2.625829103
-0.9250469882
0.8649551389
-0.05932339715
0.1875348972
-1.777423877
0.3167333151
2.812671353
-0.08568303965
-0.639108989
-0.7400207945
1.240896848
3.10131965
-0.7431251116
1.565102671
1.481917808
0.02042061539
-0.3813755101
0.7843858381
-0.7274583899
-1.439022351
-0.4709286982
1.503667829


Summary of computational transaction
Raw Inputview raw input (R code)
Raw Outputview raw output of R engine
Computing time0 seconds
R Server'Sir Maurice George Kendall' @ kendall.wessa.net

\begin{tabular}{lllllllll}
\hline
Summary of computational transaction \tabularnewline
Raw Input & view raw input (R code)  \tabularnewline
Raw Output & view raw output of R engine  \tabularnewline
Computing time & 0 seconds \tabularnewline
R Server & 'Sir Maurice George Kendall' @ kendall.wessa.net \tabularnewline
\hline
\end{tabular}
%Source: https://freestatistics.org/blog/index.php?pk=282666&T=0

[TABLE]
[ROW][C]Summary of computational transaction[/C][/ROW]
[ROW][C]Raw Input[/C][C]view raw input (R code) [/C][/ROW]
[ROW][C]Raw Output[/C][C]view raw output of R engine [/C][/ROW]
[ROW][C]Computing time[/C][C]0 seconds[/C][/ROW]
[ROW][C]R Server[/C][C]'Sir Maurice George Kendall' @ kendall.wessa.net[/C][/ROW]
[/TABLE]
Source: https://freestatistics.org/blog/index.php?pk=282666&T=0

Globally Unique Identifier (entire table): ba.freestatistics.org/blog/index.php?pk=282666&T=0

As an alternative you can also use a QR Code:  

The GUIDs for individual cells are displayed in the table below:

Summary of computational transaction
Raw Inputview raw input (R code)
Raw Outputview raw output of R engine
Computing time0 seconds
R Server'Sir Maurice George Kendall' @ kendall.wessa.net


Frequency Table (Histogram)
BinsMidpointAbs. FrequencyRel. FrequencyCumul. Rel. Freq.Density
[-3,-2.5[-2.7510.0066670.0066670.013333
[-2.5,-2[-2.2520.0133330.020.026667
[-2,-1.5[-1.7590.060.080.12
[-1.5,-1[-1.25120.080.160.16
[-1,-0.5[-0.75220.1466670.3066670.293333
[-0.5,0[-0.25290.1933330.50.386667
[0,0.5[0.25210.140.640.28
[0.5,1[0.75140.0933330.7333330.186667
[1,1.5[1.25260.1733330.9066670.346667
[1.5,2[1.7590.060.9666670.12
[2,2.5[2.2510.0066670.9733330.013333
[2.5,3[2.7530.020.9933330.04
[3,3.5]3.2510.00666710.013333

\begin{tabular}{lllllllll}
\hline
Frequency Table (Histogram) \tabularnewline
Bins & Midpoint & Abs. Frequency & Rel. Frequency & Cumul. Rel. Freq. & Density \tabularnewline
[-3,-2.5[ & -2.75 & 1 & 0.006667 & 0.006667 & 0.013333 \tabularnewline
[-2.5,-2[ & -2.25 & 2 & 0.013333 & 0.02 & 0.026667 \tabularnewline
[-2,-1.5[ & -1.75 & 9 & 0.06 & 0.08 & 0.12 \tabularnewline
[-1.5,-1[ & -1.25 & 12 & 0.08 & 0.16 & 0.16 \tabularnewline
[-1,-0.5[ & -0.75 & 22 & 0.146667 & 0.306667 & 0.293333 \tabularnewline
[-0.5,0[ & -0.25 & 29 & 0.193333 & 0.5 & 0.386667 \tabularnewline
[0,0.5[ & 0.25 & 21 & 0.14 & 0.64 & 0.28 \tabularnewline
[0.5,1[ & 0.75 & 14 & 0.093333 & 0.733333 & 0.186667 \tabularnewline
[1,1.5[ & 1.25 & 26 & 0.173333 & 0.906667 & 0.346667 \tabularnewline
[1.5,2[ & 1.75 & 9 & 0.06 & 0.966667 & 0.12 \tabularnewline
[2,2.5[ & 2.25 & 1 & 0.006667 & 0.973333 & 0.013333 \tabularnewline
[2.5,3[ & 2.75 & 3 & 0.02 & 0.993333 & 0.04 \tabularnewline
[3,3.5] & 3.25 & 1 & 0.006667 & 1 & 0.013333 \tabularnewline
\hline
\end{tabular}
%Source: https://freestatistics.org/blog/index.php?pk=282666&T=1

[TABLE]
[ROW][C]Frequency Table (Histogram)[/C][/ROW]
[ROW][C]Bins[/C][C]Midpoint[/C][C]Abs. Frequency[/C][C]Rel. Frequency[/C][C]Cumul. Rel. Freq.[/C][C]Density[/C][/ROW]
[ROW][C][-3,-2.5[[/C][C]-2.75[/C][C]1[/C][C]0.006667[/C][C]0.006667[/C][C]0.013333[/C][/ROW]
[ROW][C][-2.5,-2[[/C][C]-2.25[/C][C]2[/C][C]0.013333[/C][C]0.02[/C][C]0.026667[/C][/ROW]
[ROW][C][-2,-1.5[[/C][C]-1.75[/C][C]9[/C][C]0.06[/C][C]0.08[/C][C]0.12[/C][/ROW]
[ROW][C][-1.5,-1[[/C][C]-1.25[/C][C]12[/C][C]0.08[/C][C]0.16[/C][C]0.16[/C][/ROW]
[ROW][C][-1,-0.5[[/C][C]-0.75[/C][C]22[/C][C]0.146667[/C][C]0.306667[/C][C]0.293333[/C][/ROW]
[ROW][C][-0.5,0[[/C][C]-0.25[/C][C]29[/C][C]0.193333[/C][C]0.5[/C][C]0.386667[/C][/ROW]
[ROW][C][0,0.5[[/C][C]0.25[/C][C]21[/C][C]0.14[/C][C]0.64[/C][C]0.28[/C][/ROW]
[ROW][C][0.5,1[[/C][C]0.75[/C][C]14[/C][C]0.093333[/C][C]0.733333[/C][C]0.186667[/C][/ROW]
[ROW][C][1,1.5[[/C][C]1.25[/C][C]26[/C][C]0.173333[/C][C]0.906667[/C][C]0.346667[/C][/ROW]
[ROW][C][1.5,2[[/C][C]1.75[/C][C]9[/C][C]0.06[/C][C]0.966667[/C][C]0.12[/C][/ROW]
[ROW][C][2,2.5[[/C][C]2.25[/C][C]1[/C][C]0.006667[/C][C]0.973333[/C][C]0.013333[/C][/ROW]
[ROW][C][2.5,3[[/C][C]2.75[/C][C]3[/C][C]0.02[/C][C]0.993333[/C][C]0.04[/C][/ROW]
[ROW][C][3,3.5][/C][C]3.25[/C][C]1[/C][C]0.006667[/C][C]1[/C][C]0.013333[/C][/ROW]
[/TABLE]
Source: https://freestatistics.org/blog/index.php?pk=282666&T=1

Globally Unique Identifier (entire table): ba.freestatistics.org/blog/index.php?pk=282666&T=1

As an alternative you can also use a QR Code:  

The GUIDs for individual cells are displayed in the table below:

Frequency Table (Histogram)
BinsMidpointAbs. FrequencyRel. FrequencyCumul. Rel. Freq.Density
[-3,-2.5[-2.7510.0066670.0066670.013333
[-2.5,-2[-2.2520.0133330.020.026667
[-2,-1.5[-1.7590.060.080.12
[-1.5,-1[-1.25120.080.160.16
[-1,-0.5[-0.75220.1466670.3066670.293333
[-0.5,0[-0.25290.1933330.50.386667
[0,0.5[0.25210.140.640.28
[0.5,1[0.75140.0933330.7333330.186667
[1,1.5[1.25260.1733330.9066670.346667
[1.5,2[1.7590.060.9666670.12
[2,2.5[2.2510.0066670.9733330.013333
[2.5,3[2.7530.020.9933330.04
[3,3.5]3.2510.00666710.013333


Parameters (Session):
par2 = grey ; par3 = FALSE ; par4 = Unknown ;
Parameters (R input):
par1 = ; par2 = grey ; par3 = FALSE ; par4 = Unknown ;
R code (references can be found in the software module):
par4 <- 'Unknown'
par3 <- 'FALSE'
par2 <- 'grey'
par1 <- ''
par1 <- as.numeric(par1)
if (par3 == 'TRUE') par3 <- TRUE
if (par3 == 'FALSE') par3 <- FALSE
if (par4 == 'Unknown') par1 <- as.numeric(par1)
if (par4 == 'Interval/Ratio') par1 <- as.numeric(par1)
if (par4 == '3-point Likert') par1 <- c(1:3 - 0.5, 3.5)
if (par4 == '4-point Likert') par1 <- c(1:4 - 0.5, 4.5)
if (par4 == '5-point Likert') par1 <- c(1:5 - 0.5, 5.5)
if (par4 == '6-point Likert') par1 <- c(1:6 - 0.5, 6.5)
if (par4 == '7-point Likert') par1 <- c(1:7 - 0.5, 7.5)
if (par4 == '8-point Likert') par1 <- c(1:8 - 0.5, 8.5)
if (par4 == '9-point Likert') par1 <- c(1:9 - 0.5, 9.5)
if (par4 == '10-point Likert') par1 <- c(1:10 - 0.5, 10.5)
bitmap(file='test1.png')
if(is.numeric(x[1])) {
if (is.na(par1)) {
myhist<-hist(x,col=par2,main=main,xlab=xlab,right=par3)
} else {
if (par1 < 0) par1 <- 3
if (par1 > 50) par1 <- 50
myhist<-hist(x,breaks=par1,col=par2,main=main,xlab=xlab,right=par3)
}
} else {
barplot(mytab <- sort(table(x),T),col=par2,main='Frequency Plot',xlab=xlab,ylab='Absolute Frequency')
}
dev.off()
if(is.numeric(x[1])) {
myhist
n <- length(x)
load(file='createtable')
a<-table.start()
a<-table.row.start(a)
a<-table.element(a,hyperlink('histogram.htm','Frequency Table (Histogram)',''),6,TRUE)
a<-table.row.end(a)
a<-table.row.start(a)
a<-table.element(a,'Bins',header=TRUE)
a<-table.element(a,'Midpoint',header=TRUE)
a<-table.element(a,'Abs. Frequency',header=TRUE)
a<-table.element(a,'Rel. Frequency',header=TRUE)
a<-table.element(a,'Cumul. Rel. Freq.',header=TRUE)
a<-table.element(a,'Density',header=TRUE)
a<-table.row.end(a)
crf <- 0
if (par3 == FALSE) mybracket <- '[' else mybracket <- ']'
mynumrows <- (length(myhist$breaks)-1)
for (i in 1:mynumrows) {
a<-table.row.start(a)
if (i == 1)
dum <- paste('[',myhist$breaks[i],sep='')
else
dum <- paste(mybracket,myhist$breaks[i],sep='')
dum <- paste(dum,myhist$breaks[i+1],sep=',')
if (i==mynumrows)
dum <- paste(dum,']',sep='')
else
dum <- paste(dum,mybracket,sep='')
a<-table.element(a,dum,header=TRUE)
a<-table.element(a,myhist$mids[i])
a<-table.element(a,myhist$counts[i])
rf <- myhist$counts[i]/n
crf <- crf + rf
a<-table.element(a,round(rf,6))
a<-table.element(a,round(crf,6))
a<-table.element(a,round(myhist$density[i],6))
a<-table.row.end(a)
}
a<-table.end(a)
table.save(a,file='mytable.tab')
} else {
mytab
reltab <- mytab / sum(mytab)
n <- length(mytab)
load(file='createtable')
a<-table.start()
a<-table.row.start(a)
a<-table.element(a,'Frequency Table (Categorical Data)',3,TRUE)
a<-table.row.end(a)
a<-table.row.start(a)
a<-table.element(a,'Category',header=TRUE)
a<-table.element(a,'Abs. Frequency',header=TRUE)
a<-table.element(a,'Rel. Frequency',header=TRUE)
a<-table.row.end(a)
for (i in 1:n) {
a<-table.row.start(a)
a<-table.element(a,labels(mytab)$x[i],header=TRUE)
a<-table.element(a,mytab[i])
a<-table.element(a,round(reltab[i],4))
a<-table.row.end(a)
}
a<-table.end(a)
table.save(a,file='mytable1.tab')
}