Free Statistics

of Irreproducible Research!

Author's title

Author*The author of this computation has been verified*
R Software Modulerwasp_notchedbox1.wasp
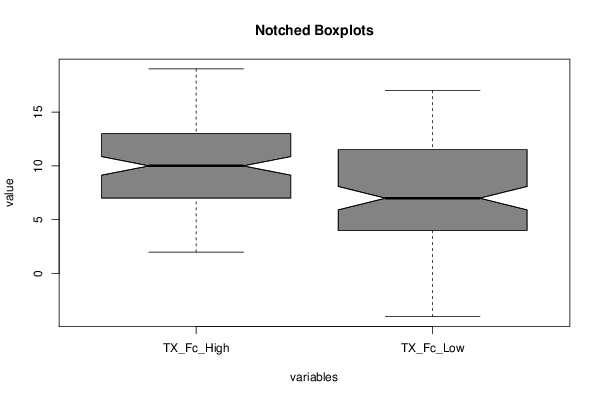
Title produced by softwareNotched Boxplots
Date of computationTue, 20 Oct 2015 20:06:15 +0100
Cite this page as followsStatistical Computations at FreeStatistics.org, Office for Research Development and Education, URL https://freestatistics.org/blog/index.php?v=date/2015/Oct/20/t1445369826a157xycne7an8at.htm/, Retrieved Thu, 16 May 2024 01:08:58 +0000
Statistical Computations at FreeStatistics.org, Office for Research Development and Education, URL https://freestatistics.org/blog/index.php?pk=282706, Retrieved Thu, 16 May 2024 01:08:58 +0000
QR Codes:

Original text written by user:De inkepingen van de boxplots overlappen niet. Dit wil zeggen dat de medianen verschillen. De mediaan van de scores van de groep met studenten die veel reviews schreef door het jaar heen ligt hoger dan de mediaan van de scores van de studenten die weinig reviews schreven. Men kan ook een symmetrische verdeling vaststellen doordat de boxplots ongeveer in het midden liggen ten opzichte van de whiskers. Alleen de ligging van de whiskers verschilt bij de verschillende groepen.
IsPrivate?No (this computation is public)
User-defined keywords
Estimated Impact152
Family? (F = Feedback message, R = changed R code, M = changed R Module, P = changed Parameters, D = changed Data)
-       [Notched Boxplots] [Notched boxplot f...] [2015-10-20 19:06:15] [9b4ece21719e6dde02765eb8dee9496c] [Current]
Feedback Forum

Post a new message
Dataseries X:
9 NA
17 NA
NA 4
11 NA
12 NA
15 NA
NA 5
11 NA
10 NA
6 NA
NA 16
10 NA
NA 12
NA 9
13 NA
12 NA
NA 5
NA 5
15 NA
6 NA
NA 2
6 NA
17 NA
NA 7
13 NA
14 NA
9 NA
NA 13
12 NA
2 NA
NA 11
7 NA
5 NA
NA 0
11 NA
NA 5
6 NA
4 NA
NA 14
10 NA
NA 1
6 NA
NA 11
17 NA
NA 12
4 NA
4 NA
6 NA
NA 6
10 NA
13 NA
15 NA
3 NA
9 NA
19 NA
7 NA
4 NA
5 NA
9 NA
NA 7
12 NA
5 NA
12 NA
NA 8
12 NA
11 NA
9 NA
9 NA
NA 11
9 NA
NA 9
NA 5
7 NA
7 NA
NA -3
4 NA
NA 7
13 NA
NA 13
10 NA
5 NA
NA 2
13 NA
6 NA
14 NA
13 NA
11 NA
6 NA
12 NA
9 NA
17 NA
7 NA
13 NA
12 NA
6 NA
11 NA
9 NA
NA 7
11 NA
15 NA
6 NA
12 NA
3 NA
NA 10
9 NA
10 NA
NA 8
NA 8
NA 2
12 NA
12 NA
10 NA
12 NA
12 NA
NA 6
NA 3
4 NA
12 NA
NA 3
NA 9
13 NA
NA -1
14 NA
6 NA
NA 12
9 NA
10 NA
6 NA
17 NA
NA 4
NA 7
12 NA
NA 7
NA 2
NA 13
NA 14
NA 11
NA 14
14 NA
NA 8
NA 12
NA 2
NA 15
NA 14
13 NA
15 NA
NA 4
9 NA
12 NA
18 NA
11 NA
NA 4
4 NA
NA 8
NA 7
12 NA
9 NA
NA 6
11 NA
16 NA
NA 7
6 NA
NA 9
NA 17
15 NA
9 NA
NA 16
5 NA
NA 7
13 NA
NA 12
NA 9
10 NA
NA 9
NA 0
NA 3
15 NA
NA 5
NA 4
NA 14
9 NA
NA 15
NA 13
NA 9
NA 11
13 NA
NA 5
NA 1
NA 17
9 NA
NA 6
NA 9
NA 7
9 NA
NA 6
NA 11
NA 0
15 NA
NA 16
NA 7
7 NA
NA 15
NA 10
NA 7
NA 13
NA 3
NA 0
NA 11
11 NA
NA 6
NA -4
10 NA
NA 4
NA 16
NA 13
7 NA
NA 0
13 NA
NA 6
NA 4
NA 4
NA 2
NA 13
15 NA
NA 15
NA 6
NA 4
NA 13
NA 13
NA 6
NA 11
NA 9
NA 12
NA 2
NA 6
NA 6
NA -1
NA 4
NA 11
NA 2
NA 7


Summary of computational transaction
Raw Inputview raw input (R code)
Raw Outputview raw output of R engine
Computing time1 seconds
R Server'Sir Maurice George Kendall' @ kendall.wessa.net

\begin{tabular}{lllllllll}
\hline
Summary of computational transaction \tabularnewline
Raw Input & view raw input (R code)  \tabularnewline
Raw Output & view raw output of R engine  \tabularnewline
Computing time & 1 seconds \tabularnewline
R Server & 'Sir Maurice George Kendall' @ kendall.wessa.net \tabularnewline
\hline
\end{tabular}
%Source: https://freestatistics.org/blog/index.php?pk=282706&T=0

[TABLE]
[ROW][C]Summary of computational transaction[/C][/ROW]
[ROW][C]Raw Input[/C][C]view raw input (R code) [/C][/ROW]
[ROW][C]Raw Output[/C][C]view raw output of R engine [/C][/ROW]
[ROW][C]Computing time[/C][C]1 seconds[/C][/ROW]
[ROW][C]R Server[/C][C]'Sir Maurice George Kendall' @ kendall.wessa.net[/C][/ROW]
[/TABLE]
Source: https://freestatistics.org/blog/index.php?pk=282706&T=0

Globally Unique Identifier (entire table): ba.freestatistics.org/blog/index.php?pk=282706&T=0

As an alternative you can also use a QR Code:  

The GUIDs for individual cells are displayed in the table below:

Summary of computational transaction
Raw Inputview raw input (R code)
Raw Outputview raw output of R engine
Computing time1 seconds
R Server'Sir Maurice George Kendall' @ kendall.wessa.net


\begin{tabular}{lllllllll}
\hline
Boxplot statistics \tabularnewline
Variable & lower whisker & lower hinge & median & upper hinge & upper whisker \tabularnewline
TX_Fc_High & 2 & 7 & 10 & 13 & 19 \tabularnewline
TX_Fc_Low & -4 & 4 & 7 & 11.5 & 17 \tabularnewline
\hline
\end{tabular}
%Source: https://freestatistics.org/blog/index.php?pk=282706&T=1

[TABLE]
[ROW][C]Boxplot statistics[/C][/ROW]
[ROW][C]Variable[/C][C]lower whisker[/C][C]lower hinge[/C][C]median[/C][C]upper hinge[/C][C]upper whisker[/C][/ROW]
[ROW][C]TX_Fc_High[/C][C]2[/C][C]7[/C][C]10[/C][C]13[/C][C]19[/C][/ROW]
[ROW][C]TX_Fc_Low[/C][C]-4[/C][C]4[/C][C]7[/C][C]11.5[/C][C]17[/C][/ROW]
[/TABLE]
Source: https://freestatistics.org/blog/index.php?pk=282706&T=1

Globally Unique Identifier (entire table): ba.freestatistics.org/blog/index.php?pk=282706&T=1

As an alternative you can also use a QR Code:  

The GUIDs for individual cells are displayed in the table below:

Boxplot statistics
Variablelower whiskerlower hingemedianupper hingeupper whisker
TX_Fc_High27101319
TX_Fc_Low-44711.517


Boxplot Notches
Variablelower boundmedianupper bound
TX_Fc_High9.141721127516921010.8582788724831
TX_Fc_Low5.9137122810215778.08628771897843

\begin{tabular}{lllllllll}
\hline
Boxplot Notches \tabularnewline
Variable & lower bound & median & upper bound \tabularnewline
TX_Fc_High & 9.14172112751692 & 10 & 10.8582788724831 \tabularnewline
TX_Fc_Low & 5.91371228102157 & 7 & 8.08628771897843 \tabularnewline
\hline
\end{tabular}
%Source: https://freestatistics.org/blog/index.php?pk=282706&T=2

[TABLE]
[ROW][C]Boxplot Notches[/C][/ROW]
[ROW][C]Variable[/C][C]lower bound[/C][C]median[/C][C]upper bound[/C][/ROW]
[ROW][C]TX_Fc_High[/C][C]9.14172112751692[/C][C]10[/C][C]10.8582788724831[/C][/ROW]
[ROW][C]TX_Fc_Low[/C][C]5.91371228102157[/C][C]7[/C][C]8.08628771897843[/C][/ROW]
[/TABLE]
Source: https://freestatistics.org/blog/index.php?pk=282706&T=2

Globally Unique Identifier (entire table): ba.freestatistics.org/blog/index.php?pk=282706&T=2

As an alternative you can also use a QR Code:  

The GUIDs for individual cells are displayed in the table below:

Boxplot Notches
Variablelower boundmedianupper bound
TX_Fc_High9.141721127516921010.8582788724831
TX_Fc_Low5.9137122810215778.08628771897843


Parameters (Session):
par1 = grey ;
Parameters (R input):
par1 = grey ;
R code (references can be found in the software module):
z <- as.data.frame(t(y))
bitmap(file='test1.png')
(r<-boxplot(z ,xlab=xlab,ylab=ylab,main=main,notch=TRUE,col=par1))
dev.off()
load(file='createtable')
a<-table.start()
a<-table.row.start(a)
a<-table.element(a,hyperlink('overview.htm','Boxplot statistics','Boxplot overview'),6,TRUE)
a<-table.row.end(a)
a<-table.row.start(a)
a<-table.element(a,'Variable',1,TRUE)
a<-table.element(a,hyperlink('lower_whisker.htm','lower whisker','definition of lower whisker'),1,TRUE)
a<-table.element(a,hyperlink('lower_hinge.htm','lower hinge','definition of lower hinge'),1,TRUE)
a<-table.element(a,hyperlink('central_tendency.htm','median','definitions about measures of central tendency'),1,TRUE)
a<-table.element(a,hyperlink('upper_hinge.htm','upper hinge','definition of upper hinge'),1,TRUE)
a<-table.element(a,hyperlink('upper_whisker.htm','upper whisker','definition of upper whisker'),1,TRUE)
a<-table.row.end(a)
for (i in 1:length(y[,1]))
{
a<-table.row.start(a)
a<-table.element(a,dimnames(t(x))[[2]][i],1,TRUE)
for (j in 1:5)
{
a<-table.element(a,r$stats[j,i])
}
a<-table.row.end(a)
}
a<-table.end(a)
table.save(a,file='mytable.tab')
a<-table.start()
a<-table.row.start(a)
a<-table.element(a,'Boxplot Notches',4,TRUE)
a<-table.row.end(a)
a<-table.row.start(a)
a<-table.element(a,'Variable',1,TRUE)
a<-table.element(a,'lower bound',1,TRUE)
a<-table.element(a,'median',1,TRUE)
a<-table.element(a,'upper bound',1,TRUE)
a<-table.row.end(a)
for (i in 1:length(y[,1]))
{
a<-table.row.start(a)
a<-table.element(a,dimnames(t(x))[[2]][i],1,TRUE)
a<-table.element(a,r$conf[1,i])
a<-table.element(a,r$stats[3,i])
a<-table.element(a,r$conf[2,i])
a<-table.row.end(a)
}
a<-table.end(a)
table.save(a,file='mytable1.tab')