Free Statistics

of Irreproducible Research!

Author's title

Author*Unverified author*
R Software Modulerwasp_autocorrelation.wasp
Title produced by software(Partial) Autocorrelation Function
Date of computationWed, 21 Oct 2015 15:11:33 +0100
Cite this page as followsStatistical Computations at FreeStatistics.org, Office for Research Development and Education, URL https://freestatistics.org/blog/index.php?v=date/2015/Oct/21/t1445436758n43ue4cdx0gondn.htm/, Retrieved Wed, 15 May 2024 06:16:11 +0000
Statistical Computations at FreeStatistics.org, Office for Research Development and Education, URL https://freestatistics.org/blog/index.php?pk=282724, Retrieved Wed, 15 May 2024 06:16:11 +0000
QR Codes:

Original text written by user:
IsPrivate?No (this computation is public)
User-defined keywords
Estimated Impact122
Family? (F = Feedback message, R = changed R code, M = changed R Module, P = changed Parameters, D = changed Data)
-     [(Partial) Autocorrelation Function] [] [2015-10-21 14:08:06] [2ebcfabd763d4457ed7937955225e15c]
-   PD    [(Partial) Autocorrelation Function] [] [2015-10-21 14:11:33] [1faf68c5110a4cb4d7d9116a9189ca68] [Current]
Feedback Forum

Post a new message
Dataseries X:
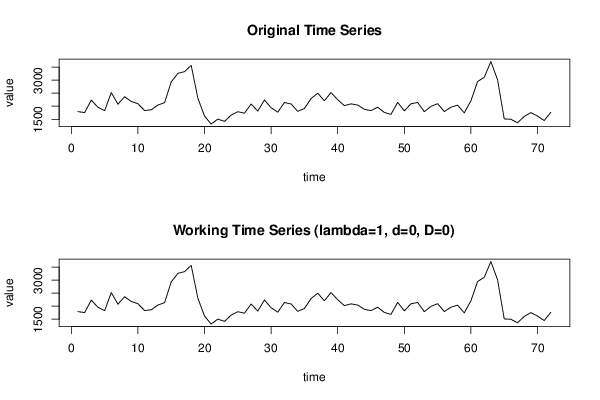
1795
1756
2237
1960
1829
2524
2077
2366
2185
2098
1836
1863
2044
2136
2931
3263
3328
3570
2313
1623
1316
1507
1419
1660
1790
1733
2086
1814
2241
1943
1773
2143
2087
1805
1913
2296
2500
2210
2526
2249
2024
2091
2045
1882
1831
1964
1763
1688
2149
1823
2094
2145
1790
1996
2097
1795
1963
2041
1746
2210
2949
3110
3716
3014
1515
1498
1366
1607
1757
1623
1451
1765


Summary of computational transaction
Raw Inputview raw input (R code)
Raw Outputview raw output of R engine
Computing time1 seconds
R Server'Herman Ole Andreas Wold' @ wold.wessa.net

\begin{tabular}{lllllllll}
\hline
Summary of computational transaction \tabularnewline
Raw Input & view raw input (R code)  \tabularnewline
Raw Output & view raw output of R engine  \tabularnewline
Computing time & 1 seconds \tabularnewline
R Server & 'Herman Ole Andreas Wold' @ wold.wessa.net \tabularnewline
\hline
\end{tabular}
%Source: https://freestatistics.org/blog/index.php?pk=282724&T=0

[TABLE]
[ROW][C]Summary of computational transaction[/C][/ROW]
[ROW][C]Raw Input[/C][C]view raw input (R code) [/C][/ROW]
[ROW][C]Raw Output[/C][C]view raw output of R engine [/C][/ROW]
[ROW][C]Computing time[/C][C]1 seconds[/C][/ROW]
[ROW][C]R Server[/C][C]'Herman Ole Andreas Wold' @ wold.wessa.net[/C][/ROW]
[/TABLE]
Source: https://freestatistics.org/blog/index.php?pk=282724&T=0

Globally Unique Identifier (entire table): ba.freestatistics.org/blog/index.php?pk=282724&T=0

As an alternative you can also use a QR Code:  

The GUIDs for individual cells are displayed in the table below:

Summary of computational transaction
Raw Inputview raw input (R code)
Raw Outputview raw output of R engine
Computing time1 seconds
R Server'Herman Ole Andreas Wold' @ wold.wessa.net


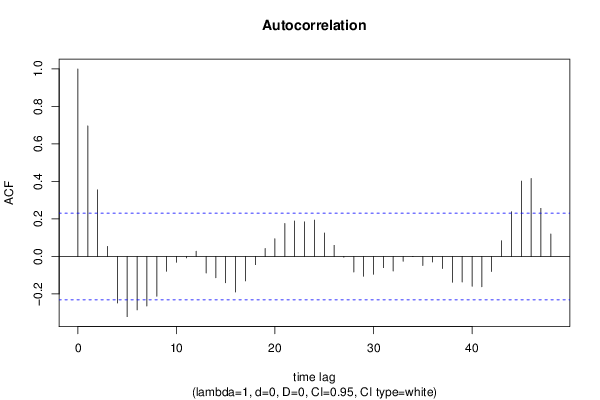
Autocorrelation Function
Time lag kACF(k)T-STATP-value
10.6962915.90820
20.3550953.01310.001784
30.0536390.45510.325188
4-0.248741-2.11060.019139
5-0.32105-2.72420.004042
6-0.284982-2.41820.009065
7-0.263857-2.23890.014127
8-0.212601-1.8040.037709
9-0.078958-0.670.252506
10-0.03088-0.2620.397025
11-0.007698-0.06530.474051
120.0280820.23830.406168
13-0.088438-0.75040.227722
14-0.113374-0.9620.169632
15-0.139869-1.18680.119598
16-0.189272-1.6060.056323
17-0.13037-1.10620.136155
18-0.043647-0.37040.356102
190.0420220.35660.36123
200.0941890.79920.213396
210.1760221.49360.069825
220.1891951.60540.056394
230.1846091.56650.060813
240.1937731.64420.052245
250.1247651.05870.146645
260.0591320.50180.308687
27-0.004335-0.03680.485381
28-0.083302-0.70680.240974
29-0.105874-0.89840.185991
30-0.095193-0.80770.210949
31-0.059516-0.5050.307547
32-0.078013-0.6620.255054
33-0.025475-0.21620.414736
34-0.001171-0.00990.496051
35-0.048505-0.41160.340936
36-0.02994-0.2540.400092
37-0.064415-0.54660.29318
38-0.137781-1.16910.123107
39-0.135993-1.15390.126171
40-0.158692-1.34650.091175
41-0.161508-1.37040.087403
42-0.08039-0.68210.248673
430.0839960.71270.239159
440.2388632.02680.023193
450.4017923.40930.000535
460.4155333.52590.000369
470.2563182.17490.016461
480.1197181.01580.156553

\begin{tabular}{lllllllll}
\hline
Autocorrelation Function \tabularnewline
Time lag k & ACF(k) & T-STAT & P-value \tabularnewline
1 & 0.696291 & 5.9082 & 0 \tabularnewline
2 & 0.355095 & 3.0131 & 0.001784 \tabularnewline
3 & 0.053639 & 0.4551 & 0.325188 \tabularnewline
4 & -0.248741 & -2.1106 & 0.019139 \tabularnewline
5 & -0.32105 & -2.7242 & 0.004042 \tabularnewline
6 & -0.284982 & -2.4182 & 0.009065 \tabularnewline
7 & -0.263857 & -2.2389 & 0.014127 \tabularnewline
8 & -0.212601 & -1.804 & 0.037709 \tabularnewline
9 & -0.078958 & -0.67 & 0.252506 \tabularnewline
10 & -0.03088 & -0.262 & 0.397025 \tabularnewline
11 & -0.007698 & -0.0653 & 0.474051 \tabularnewline
12 & 0.028082 & 0.2383 & 0.406168 \tabularnewline
13 & -0.088438 & -0.7504 & 0.227722 \tabularnewline
14 & -0.113374 & -0.962 & 0.169632 \tabularnewline
15 & -0.139869 & -1.1868 & 0.119598 \tabularnewline
16 & -0.189272 & -1.606 & 0.056323 \tabularnewline
17 & -0.13037 & -1.1062 & 0.136155 \tabularnewline
18 & -0.043647 & -0.3704 & 0.356102 \tabularnewline
19 & 0.042022 & 0.3566 & 0.36123 \tabularnewline
20 & 0.094189 & 0.7992 & 0.213396 \tabularnewline
21 & 0.176022 & 1.4936 & 0.069825 \tabularnewline
22 & 0.189195 & 1.6054 & 0.056394 \tabularnewline
23 & 0.184609 & 1.5665 & 0.060813 \tabularnewline
24 & 0.193773 & 1.6442 & 0.052245 \tabularnewline
25 & 0.124765 & 1.0587 & 0.146645 \tabularnewline
26 & 0.059132 & 0.5018 & 0.308687 \tabularnewline
27 & -0.004335 & -0.0368 & 0.485381 \tabularnewline
28 & -0.083302 & -0.7068 & 0.240974 \tabularnewline
29 & -0.105874 & -0.8984 & 0.185991 \tabularnewline
30 & -0.095193 & -0.8077 & 0.210949 \tabularnewline
31 & -0.059516 & -0.505 & 0.307547 \tabularnewline
32 & -0.078013 & -0.662 & 0.255054 \tabularnewline
33 & -0.025475 & -0.2162 & 0.414736 \tabularnewline
34 & -0.001171 & -0.0099 & 0.496051 \tabularnewline
35 & -0.048505 & -0.4116 & 0.340936 \tabularnewline
36 & -0.02994 & -0.254 & 0.400092 \tabularnewline
37 & -0.064415 & -0.5466 & 0.29318 \tabularnewline
38 & -0.137781 & -1.1691 & 0.123107 \tabularnewline
39 & -0.135993 & -1.1539 & 0.126171 \tabularnewline
40 & -0.158692 & -1.3465 & 0.091175 \tabularnewline
41 & -0.161508 & -1.3704 & 0.087403 \tabularnewline
42 & -0.08039 & -0.6821 & 0.248673 \tabularnewline
43 & 0.083996 & 0.7127 & 0.239159 \tabularnewline
44 & 0.238863 & 2.0268 & 0.023193 \tabularnewline
45 & 0.401792 & 3.4093 & 0.000535 \tabularnewline
46 & 0.415533 & 3.5259 & 0.000369 \tabularnewline
47 & 0.256318 & 2.1749 & 0.016461 \tabularnewline
48 & 0.119718 & 1.0158 & 0.156553 \tabularnewline
\hline
\end{tabular}
%Source: https://freestatistics.org/blog/index.php?pk=282724&T=1

[TABLE]
[ROW][C]Autocorrelation Function[/C][/ROW]
[ROW][C]Time lag k[/C][C]ACF(k)[/C][C]T-STAT[/C][C]P-value[/C][/ROW]
[ROW][C]1[/C][C]0.696291[/C][C]5.9082[/C][C]0[/C][/ROW]
[ROW][C]2[/C][C]0.355095[/C][C]3.0131[/C][C]0.001784[/C][/ROW]
[ROW][C]3[/C][C]0.053639[/C][C]0.4551[/C][C]0.325188[/C][/ROW]
[ROW][C]4[/C][C]-0.248741[/C][C]-2.1106[/C][C]0.019139[/C][/ROW]
[ROW][C]5[/C][C]-0.32105[/C][C]-2.7242[/C][C]0.004042[/C][/ROW]
[ROW][C]6[/C][C]-0.284982[/C][C]-2.4182[/C][C]0.009065[/C][/ROW]
[ROW][C]7[/C][C]-0.263857[/C][C]-2.2389[/C][C]0.014127[/C][/ROW]
[ROW][C]8[/C][C]-0.212601[/C][C]-1.804[/C][C]0.037709[/C][/ROW]
[ROW][C]9[/C][C]-0.078958[/C][C]-0.67[/C][C]0.252506[/C][/ROW]
[ROW][C]10[/C][C]-0.03088[/C][C]-0.262[/C][C]0.397025[/C][/ROW]
[ROW][C]11[/C][C]-0.007698[/C][C]-0.0653[/C][C]0.474051[/C][/ROW]
[ROW][C]12[/C][C]0.028082[/C][C]0.2383[/C][C]0.406168[/C][/ROW]
[ROW][C]13[/C][C]-0.088438[/C][C]-0.7504[/C][C]0.227722[/C][/ROW]
[ROW][C]14[/C][C]-0.113374[/C][C]-0.962[/C][C]0.169632[/C][/ROW]
[ROW][C]15[/C][C]-0.139869[/C][C]-1.1868[/C][C]0.119598[/C][/ROW]
[ROW][C]16[/C][C]-0.189272[/C][C]-1.606[/C][C]0.056323[/C][/ROW]
[ROW][C]17[/C][C]-0.13037[/C][C]-1.1062[/C][C]0.136155[/C][/ROW]
[ROW][C]18[/C][C]-0.043647[/C][C]-0.3704[/C][C]0.356102[/C][/ROW]
[ROW][C]19[/C][C]0.042022[/C][C]0.3566[/C][C]0.36123[/C][/ROW]
[ROW][C]20[/C][C]0.094189[/C][C]0.7992[/C][C]0.213396[/C][/ROW]
[ROW][C]21[/C][C]0.176022[/C][C]1.4936[/C][C]0.069825[/C][/ROW]
[ROW][C]22[/C][C]0.189195[/C][C]1.6054[/C][C]0.056394[/C][/ROW]
[ROW][C]23[/C][C]0.184609[/C][C]1.5665[/C][C]0.060813[/C][/ROW]
[ROW][C]24[/C][C]0.193773[/C][C]1.6442[/C][C]0.052245[/C][/ROW]
[ROW][C]25[/C][C]0.124765[/C][C]1.0587[/C][C]0.146645[/C][/ROW]
[ROW][C]26[/C][C]0.059132[/C][C]0.5018[/C][C]0.308687[/C][/ROW]
[ROW][C]27[/C][C]-0.004335[/C][C]-0.0368[/C][C]0.485381[/C][/ROW]
[ROW][C]28[/C][C]-0.083302[/C][C]-0.7068[/C][C]0.240974[/C][/ROW]
[ROW][C]29[/C][C]-0.105874[/C][C]-0.8984[/C][C]0.185991[/C][/ROW]
[ROW][C]30[/C][C]-0.095193[/C][C]-0.8077[/C][C]0.210949[/C][/ROW]
[ROW][C]31[/C][C]-0.059516[/C][C]-0.505[/C][C]0.307547[/C][/ROW]
[ROW][C]32[/C][C]-0.078013[/C][C]-0.662[/C][C]0.255054[/C][/ROW]
[ROW][C]33[/C][C]-0.025475[/C][C]-0.2162[/C][C]0.414736[/C][/ROW]
[ROW][C]34[/C][C]-0.001171[/C][C]-0.0099[/C][C]0.496051[/C][/ROW]
[ROW][C]35[/C][C]-0.048505[/C][C]-0.4116[/C][C]0.340936[/C][/ROW]
[ROW][C]36[/C][C]-0.02994[/C][C]-0.254[/C][C]0.400092[/C][/ROW]
[ROW][C]37[/C][C]-0.064415[/C][C]-0.5466[/C][C]0.29318[/C][/ROW]
[ROW][C]38[/C][C]-0.137781[/C][C]-1.1691[/C][C]0.123107[/C][/ROW]
[ROW][C]39[/C][C]-0.135993[/C][C]-1.1539[/C][C]0.126171[/C][/ROW]
[ROW][C]40[/C][C]-0.158692[/C][C]-1.3465[/C][C]0.091175[/C][/ROW]
[ROW][C]41[/C][C]-0.161508[/C][C]-1.3704[/C][C]0.087403[/C][/ROW]
[ROW][C]42[/C][C]-0.08039[/C][C]-0.6821[/C][C]0.248673[/C][/ROW]
[ROW][C]43[/C][C]0.083996[/C][C]0.7127[/C][C]0.239159[/C][/ROW]
[ROW][C]44[/C][C]0.238863[/C][C]2.0268[/C][C]0.023193[/C][/ROW]
[ROW][C]45[/C][C]0.401792[/C][C]3.4093[/C][C]0.000535[/C][/ROW]
[ROW][C]46[/C][C]0.415533[/C][C]3.5259[/C][C]0.000369[/C][/ROW]
[ROW][C]47[/C][C]0.256318[/C][C]2.1749[/C][C]0.016461[/C][/ROW]
[ROW][C]48[/C][C]0.119718[/C][C]1.0158[/C][C]0.156553[/C][/ROW]
[/TABLE]
Source: https://freestatistics.org/blog/index.php?pk=282724&T=1

Globally Unique Identifier (entire table): ba.freestatistics.org/blog/index.php?pk=282724&T=1

As an alternative you can also use a QR Code:  

The GUIDs for individual cells are displayed in the table below:

Autocorrelation Function
Time lag kACF(k)T-STATP-value
10.6962915.90820
20.3550953.01310.001784
30.0536390.45510.325188
4-0.248741-2.11060.019139
5-0.32105-2.72420.004042
6-0.284982-2.41820.009065
7-0.263857-2.23890.014127
8-0.212601-1.8040.037709
9-0.078958-0.670.252506
10-0.03088-0.2620.397025
11-0.007698-0.06530.474051
120.0280820.23830.406168
13-0.088438-0.75040.227722
14-0.113374-0.9620.169632
15-0.139869-1.18680.119598
16-0.189272-1.6060.056323
17-0.13037-1.10620.136155
18-0.043647-0.37040.356102
190.0420220.35660.36123
200.0941890.79920.213396
210.1760221.49360.069825
220.1891951.60540.056394
230.1846091.56650.060813
240.1937731.64420.052245
250.1247651.05870.146645
260.0591320.50180.308687
27-0.004335-0.03680.485381
28-0.083302-0.70680.240974
29-0.105874-0.89840.185991
30-0.095193-0.80770.210949
31-0.059516-0.5050.307547
32-0.078013-0.6620.255054
33-0.025475-0.21620.414736
34-0.001171-0.00990.496051
35-0.048505-0.41160.340936
36-0.02994-0.2540.400092
37-0.064415-0.54660.29318
38-0.137781-1.16910.123107
39-0.135993-1.15390.126171
40-0.158692-1.34650.091175
41-0.161508-1.37040.087403
42-0.08039-0.68210.248673
430.0839960.71270.239159
440.2388632.02680.023193
450.4017923.40930.000535
460.4155333.52590.000369
470.2563182.17490.016461
480.1197181.01580.156553


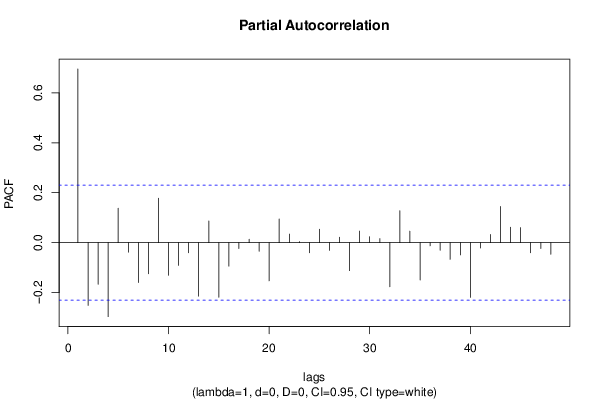
Partial Autocorrelation Function
Time lag kPACF(k)T-STATP-value
10.6962915.90820
2-0.251808-2.13670.018012
3-0.166914-1.41630.080498
4-0.296897-2.51930.006991
50.1377281.16870.123197
6-0.038233-0.32440.373282
7-0.160335-1.36050.08896
8-0.124983-1.06050.146226
90.1776851.50770.068003
10-0.131076-1.11220.134872
11-0.09137-0.77530.22035
12-0.04071-0.34540.365386
13-0.214594-1.82090.036389
140.0868170.73670.231858
15-0.219459-1.86220.03333
16-0.094331-0.80040.21305
17-0.023369-0.19830.421688
180.0134550.11420.45471
19-0.034573-0.29340.385045
20-0.15336-1.30130.098651
210.0948960.80520.211672
220.0339580.28810.387031
230.003990.03390.486544
24-0.041005-0.34790.364451
250.0534650.45370.325717
26-0.0312-0.26470.395983
270.0215050.18250.427861
28-0.112455-0.95420.171585
290.0460740.39090.348495
300.0236580.20070.420733
310.0159180.13510.446468
32-0.176813-1.50030.068953
330.1275721.08250.141325
340.0459210.38970.348973
35-0.149644-1.26980.104127
36-0.013015-0.11040.456184
37-0.030584-0.25950.397991
38-0.067153-0.56980.285291
39-0.049196-0.41740.3388
40-0.219568-1.86310.033264
41-0.021363-0.18130.428332
420.0323060.27410.392387
430.1449411.22990.111376
440.0617360.52390.300996
450.0600820.50980.305872
46-0.040876-0.34680.364861
47-0.023872-0.20260.420024
48-0.046703-0.39630.346533

\begin{tabular}{lllllllll}
\hline
Partial Autocorrelation Function \tabularnewline
Time lag k & PACF(k) & T-STAT & P-value \tabularnewline
1 & 0.696291 & 5.9082 & 0 \tabularnewline
2 & -0.251808 & -2.1367 & 0.018012 \tabularnewline
3 & -0.166914 & -1.4163 & 0.080498 \tabularnewline
4 & -0.296897 & -2.5193 & 0.006991 \tabularnewline
5 & 0.137728 & 1.1687 & 0.123197 \tabularnewline
6 & -0.038233 & -0.3244 & 0.373282 \tabularnewline
7 & -0.160335 & -1.3605 & 0.08896 \tabularnewline
8 & -0.124983 & -1.0605 & 0.146226 \tabularnewline
9 & 0.177685 & 1.5077 & 0.068003 \tabularnewline
10 & -0.131076 & -1.1122 & 0.134872 \tabularnewline
11 & -0.09137 & -0.7753 & 0.22035 \tabularnewline
12 & -0.04071 & -0.3454 & 0.365386 \tabularnewline
13 & -0.214594 & -1.8209 & 0.036389 \tabularnewline
14 & 0.086817 & 0.7367 & 0.231858 \tabularnewline
15 & -0.219459 & -1.8622 & 0.03333 \tabularnewline
16 & -0.094331 & -0.8004 & 0.21305 \tabularnewline
17 & -0.023369 & -0.1983 & 0.421688 \tabularnewline
18 & 0.013455 & 0.1142 & 0.45471 \tabularnewline
19 & -0.034573 & -0.2934 & 0.385045 \tabularnewline
20 & -0.15336 & -1.3013 & 0.098651 \tabularnewline
21 & 0.094896 & 0.8052 & 0.211672 \tabularnewline
22 & 0.033958 & 0.2881 & 0.387031 \tabularnewline
23 & 0.00399 & 0.0339 & 0.486544 \tabularnewline
24 & -0.041005 & -0.3479 & 0.364451 \tabularnewline
25 & 0.053465 & 0.4537 & 0.325717 \tabularnewline
26 & -0.0312 & -0.2647 & 0.395983 \tabularnewline
27 & 0.021505 & 0.1825 & 0.427861 \tabularnewline
28 & -0.112455 & -0.9542 & 0.171585 \tabularnewline
29 & 0.046074 & 0.3909 & 0.348495 \tabularnewline
30 & 0.023658 & 0.2007 & 0.420733 \tabularnewline
31 & 0.015918 & 0.1351 & 0.446468 \tabularnewline
32 & -0.176813 & -1.5003 & 0.068953 \tabularnewline
33 & 0.127572 & 1.0825 & 0.141325 \tabularnewline
34 & 0.045921 & 0.3897 & 0.348973 \tabularnewline
35 & -0.149644 & -1.2698 & 0.104127 \tabularnewline
36 & -0.013015 & -0.1104 & 0.456184 \tabularnewline
37 & -0.030584 & -0.2595 & 0.397991 \tabularnewline
38 & -0.067153 & -0.5698 & 0.285291 \tabularnewline
39 & -0.049196 & -0.4174 & 0.3388 \tabularnewline
40 & -0.219568 & -1.8631 & 0.033264 \tabularnewline
41 & -0.021363 & -0.1813 & 0.428332 \tabularnewline
42 & 0.032306 & 0.2741 & 0.392387 \tabularnewline
43 & 0.144941 & 1.2299 & 0.111376 \tabularnewline
44 & 0.061736 & 0.5239 & 0.300996 \tabularnewline
45 & 0.060082 & 0.5098 & 0.305872 \tabularnewline
46 & -0.040876 & -0.3468 & 0.364861 \tabularnewline
47 & -0.023872 & -0.2026 & 0.420024 \tabularnewline
48 & -0.046703 & -0.3963 & 0.346533 \tabularnewline
\hline
\end{tabular}
%Source: https://freestatistics.org/blog/index.php?pk=282724&T=2

[TABLE]
[ROW][C]Partial Autocorrelation Function[/C][/ROW]
[ROW][C]Time lag k[/C][C]PACF(k)[/C][C]T-STAT[/C][C]P-value[/C][/ROW]
[ROW][C]1[/C][C]0.696291[/C][C]5.9082[/C][C]0[/C][/ROW]
[ROW][C]2[/C][C]-0.251808[/C][C]-2.1367[/C][C]0.018012[/C][/ROW]
[ROW][C]3[/C][C]-0.166914[/C][C]-1.4163[/C][C]0.080498[/C][/ROW]
[ROW][C]4[/C][C]-0.296897[/C][C]-2.5193[/C][C]0.006991[/C][/ROW]
[ROW][C]5[/C][C]0.137728[/C][C]1.1687[/C][C]0.123197[/C][/ROW]
[ROW][C]6[/C][C]-0.038233[/C][C]-0.3244[/C][C]0.373282[/C][/ROW]
[ROW][C]7[/C][C]-0.160335[/C][C]-1.3605[/C][C]0.08896[/C][/ROW]
[ROW][C]8[/C][C]-0.124983[/C][C]-1.0605[/C][C]0.146226[/C][/ROW]
[ROW][C]9[/C][C]0.177685[/C][C]1.5077[/C][C]0.068003[/C][/ROW]
[ROW][C]10[/C][C]-0.131076[/C][C]-1.1122[/C][C]0.134872[/C][/ROW]
[ROW][C]11[/C][C]-0.09137[/C][C]-0.7753[/C][C]0.22035[/C][/ROW]
[ROW][C]12[/C][C]-0.04071[/C][C]-0.3454[/C][C]0.365386[/C][/ROW]
[ROW][C]13[/C][C]-0.214594[/C][C]-1.8209[/C][C]0.036389[/C][/ROW]
[ROW][C]14[/C][C]0.086817[/C][C]0.7367[/C][C]0.231858[/C][/ROW]
[ROW][C]15[/C][C]-0.219459[/C][C]-1.8622[/C][C]0.03333[/C][/ROW]
[ROW][C]16[/C][C]-0.094331[/C][C]-0.8004[/C][C]0.21305[/C][/ROW]
[ROW][C]17[/C][C]-0.023369[/C][C]-0.1983[/C][C]0.421688[/C][/ROW]
[ROW][C]18[/C][C]0.013455[/C][C]0.1142[/C][C]0.45471[/C][/ROW]
[ROW][C]19[/C][C]-0.034573[/C][C]-0.2934[/C][C]0.385045[/C][/ROW]
[ROW][C]20[/C][C]-0.15336[/C][C]-1.3013[/C][C]0.098651[/C][/ROW]
[ROW][C]21[/C][C]0.094896[/C][C]0.8052[/C][C]0.211672[/C][/ROW]
[ROW][C]22[/C][C]0.033958[/C][C]0.2881[/C][C]0.387031[/C][/ROW]
[ROW][C]23[/C][C]0.00399[/C][C]0.0339[/C][C]0.486544[/C][/ROW]
[ROW][C]24[/C][C]-0.041005[/C][C]-0.3479[/C][C]0.364451[/C][/ROW]
[ROW][C]25[/C][C]0.053465[/C][C]0.4537[/C][C]0.325717[/C][/ROW]
[ROW][C]26[/C][C]-0.0312[/C][C]-0.2647[/C][C]0.395983[/C][/ROW]
[ROW][C]27[/C][C]0.021505[/C][C]0.1825[/C][C]0.427861[/C][/ROW]
[ROW][C]28[/C][C]-0.112455[/C][C]-0.9542[/C][C]0.171585[/C][/ROW]
[ROW][C]29[/C][C]0.046074[/C][C]0.3909[/C][C]0.348495[/C][/ROW]
[ROW][C]30[/C][C]0.023658[/C][C]0.2007[/C][C]0.420733[/C][/ROW]
[ROW][C]31[/C][C]0.015918[/C][C]0.1351[/C][C]0.446468[/C][/ROW]
[ROW][C]32[/C][C]-0.176813[/C][C]-1.5003[/C][C]0.068953[/C][/ROW]
[ROW][C]33[/C][C]0.127572[/C][C]1.0825[/C][C]0.141325[/C][/ROW]
[ROW][C]34[/C][C]0.045921[/C][C]0.3897[/C][C]0.348973[/C][/ROW]
[ROW][C]35[/C][C]-0.149644[/C][C]-1.2698[/C][C]0.104127[/C][/ROW]
[ROW][C]36[/C][C]-0.013015[/C][C]-0.1104[/C][C]0.456184[/C][/ROW]
[ROW][C]37[/C][C]-0.030584[/C][C]-0.2595[/C][C]0.397991[/C][/ROW]
[ROW][C]38[/C][C]-0.067153[/C][C]-0.5698[/C][C]0.285291[/C][/ROW]
[ROW][C]39[/C][C]-0.049196[/C][C]-0.4174[/C][C]0.3388[/C][/ROW]
[ROW][C]40[/C][C]-0.219568[/C][C]-1.8631[/C][C]0.033264[/C][/ROW]
[ROW][C]41[/C][C]-0.021363[/C][C]-0.1813[/C][C]0.428332[/C][/ROW]
[ROW][C]42[/C][C]0.032306[/C][C]0.2741[/C][C]0.392387[/C][/ROW]
[ROW][C]43[/C][C]0.144941[/C][C]1.2299[/C][C]0.111376[/C][/ROW]
[ROW][C]44[/C][C]0.061736[/C][C]0.5239[/C][C]0.300996[/C][/ROW]
[ROW][C]45[/C][C]0.060082[/C][C]0.5098[/C][C]0.305872[/C][/ROW]
[ROW][C]46[/C][C]-0.040876[/C][C]-0.3468[/C][C]0.364861[/C][/ROW]
[ROW][C]47[/C][C]-0.023872[/C][C]-0.2026[/C][C]0.420024[/C][/ROW]
[ROW][C]48[/C][C]-0.046703[/C][C]-0.3963[/C][C]0.346533[/C][/ROW]
[/TABLE]
Source: https://freestatistics.org/blog/index.php?pk=282724&T=2

Globally Unique Identifier (entire table): ba.freestatistics.org/blog/index.php?pk=282724&T=2

As an alternative you can also use a QR Code:  

The GUIDs for individual cells are displayed in the table below:

Partial Autocorrelation Function
Time lag kPACF(k)T-STATP-value
10.6962915.90820
2-0.251808-2.13670.018012
3-0.166914-1.41630.080498
4-0.296897-2.51930.006991
50.1377281.16870.123197
6-0.038233-0.32440.373282
7-0.160335-1.36050.08896
8-0.124983-1.06050.146226
90.1776851.50770.068003
10-0.131076-1.11220.134872
11-0.09137-0.77530.22035
12-0.04071-0.34540.365386
13-0.214594-1.82090.036389
140.0868170.73670.231858
15-0.219459-1.86220.03333
16-0.094331-0.80040.21305
17-0.023369-0.19830.421688
180.0134550.11420.45471
19-0.034573-0.29340.385045
20-0.15336-1.30130.098651
210.0948960.80520.211672
220.0339580.28810.387031
230.003990.03390.486544
24-0.041005-0.34790.364451
250.0534650.45370.325717
26-0.0312-0.26470.395983
270.0215050.18250.427861
28-0.112455-0.95420.171585
290.0460740.39090.348495
300.0236580.20070.420733
310.0159180.13510.446468
32-0.176813-1.50030.068953
330.1275721.08250.141325
340.0459210.38970.348973
35-0.149644-1.26980.104127
36-0.013015-0.11040.456184
37-0.030584-0.25950.397991
38-0.067153-0.56980.285291
39-0.049196-0.41740.3388
40-0.219568-1.86310.033264
41-0.021363-0.18130.428332
420.0323060.27410.392387
430.1449411.22990.111376
440.0617360.52390.300996
450.0600820.50980.305872
46-0.040876-0.34680.364861
47-0.023872-0.20260.420024
48-0.046703-0.39630.346533


Parameters (Session):
par1 = 48 ; par2 = 1 ; par3 = 0 ; par4 = 0 ; par5 = 12 ; par6 = White Noise ; par7 = 0.95 ;
Parameters (R input):
par1 = 48 ; par2 = 1 ; par3 = 0 ; par4 = 0 ; par5 = 12 ; par6 = White Noise ; par7 = 0.95 ; par8 = ;
R code (references can be found in the software module):
if (par1 == 'Default') {
par1 = 10*log10(length(x))
} else {
par1 <- as.numeric(par1)
}
par2 <- as.numeric(par2)
par3 <- as.numeric(par3)
par4 <- as.numeric(par4)
par5 <- as.numeric(par5)
if (par6 == 'White Noise') par6 <- 'white' else par6 <- 'ma'
par7 <- as.numeric(par7)
if (par8 != '') par8 <- as.numeric(par8)
ox <- x
if (par8 == '') {
if (par2 == 0) {
x <- log(x)
} else {
x <- (x ^ par2 - 1) / par2
}
} else {
x <- log(x,base=par8)
}
if (par3 > 0) x <- diff(x,lag=1,difference=par3)
if (par4 > 0) x <- diff(x,lag=par5,difference=par4)
bitmap(file='picts.png')
op <- par(mfrow=c(2,1))
plot(ox,type='l',main='Original Time Series',xlab='time',ylab='value')
if (par8=='') {
mytitle <- paste('Working Time Series (lambda=',par2,', d=',par3,', D=',par4,')',sep='')
mysub <- paste('(lambda=',par2,', d=',par3,', D=',par4,', CI=', par7, ', CI type=',par6,')',sep='')
} else {
mytitle <- paste('Working Time Series (base=',par8,', d=',par3,', D=',par4,')',sep='')
mysub <- paste('(base=',par8,', d=',par3,', D=',par4,', CI=', par7, ', CI type=',par6,')',sep='')
}
plot(x,type='l', main=mytitle,xlab='time',ylab='value')
par(op)
dev.off()
bitmap(file='pic1.png')
racf <- acf(x, par1, main='Autocorrelation', xlab='time lag', ylab='ACF', ci.type=par6, ci=par7, sub=mysub)
dev.off()
bitmap(file='pic2.png')
rpacf <- pacf(x,par1,main='Partial Autocorrelation',xlab='lags',ylab='PACF',sub=mysub)
dev.off()
(myacf <- c(racf$acf))
(mypacf <- c(rpacf$acf))
lengthx <- length(x)
sqrtn <- sqrt(lengthx)
load(file='createtable')
a<-table.start()
a<-table.row.start(a)
a<-table.element(a,'Autocorrelation Function',4,TRUE)
a<-table.row.end(a)
a<-table.row.start(a)
a<-table.element(a,'Time lag k',header=TRUE)
a<-table.element(a,hyperlink('basics.htm','ACF(k)','click here for more information about the Autocorrelation Function'),header=TRUE)
a<-table.element(a,'T-STAT',header=TRUE)
a<-table.element(a,'P-value',header=TRUE)
a<-table.row.end(a)
for (i in 2:(par1+1)) {
a<-table.row.start(a)
a<-table.element(a,i-1,header=TRUE)
a<-table.element(a,round(myacf[i],6))
mytstat <- myacf[i]*sqrtn
a<-table.element(a,round(mytstat,4))
a<-table.element(a,round(1-pt(abs(mytstat),lengthx),6))
a<-table.row.end(a)
}
a<-table.end(a)
table.save(a,file='mytable.tab')
a<-table.start()
a<-table.row.start(a)
a<-table.element(a,'Partial Autocorrelation Function',4,TRUE)
a<-table.row.end(a)
a<-table.row.start(a)
a<-table.element(a,'Time lag k',header=TRUE)
a<-table.element(a,hyperlink('basics.htm','PACF(k)','click here for more information about the Partial Autocorrelation Function'),header=TRUE)
a<-table.element(a,'T-STAT',header=TRUE)
a<-table.element(a,'P-value',header=TRUE)
a<-table.row.end(a)
for (i in 1:par1) {
a<-table.row.start(a)
a<-table.element(a,i,header=TRUE)
a<-table.element(a,round(mypacf[i],6))
mytstat <- mypacf[i]*sqrtn
a<-table.element(a,round(mytstat,4))
a<-table.element(a,round(1-pt(abs(mytstat),lengthx),6))
a<-table.row.end(a)
}
a<-table.end(a)
table.save(a,file='mytable1.tab')