Free Statistics

of Irreproducible Research!

Author's title

Author*Unverified author*
R Software Modulerwasp_autocorrelation.wasp
Title produced by software(Partial) Autocorrelation Function
Date of computationWed, 21 Oct 2015 15:27:02 +0100
Cite this page as followsStatistical Computations at FreeStatistics.org, Office for Research Development and Education, URL https://freestatistics.org/blog/index.php?v=date/2015/Oct/21/t1445437640e40m5pg8ghkqr7i.htm/, Retrieved Wed, 15 May 2024 02:04:23 +0000
Statistical Computations at FreeStatistics.org, Office for Research Development and Education, URL https://freestatistics.org/blog/index.php?pk=282725, Retrieved Wed, 15 May 2024 02:04:23 +0000
QR Codes:

Original text written by user:
IsPrivate?No (this computation is public)
User-defined keywords
Estimated Impact103
Family? (F = Feedback message, R = changed R code, M = changed R Module, P = changed Parameters, D = changed Data)
-       [(Partial) Autocorrelation Function] [] [2015-10-21 14:27:02] [1faf68c5110a4cb4d7d9116a9189ca68] [Current]
Feedback Forum

Post a new message
Dataseries X:
1795
1756
2237
1960
1829
2524
2077
2366
2185
2098
1836
1863
2044
2136
2931
3263
3328
3570
2313
1623
1316
1507
1419
1660
1790
1733
2086
1814
2241
1943
1773
2143
2087
1805
1913
2296
2500
2210
2526
2249
2024
2091
2045
1882
1831
1964
1763
1688
2149
1823
2094
2145
1790
1996
2097
1795
1963
2041
1746
2210
2949
3110
3716
3014
1515
1498
1366
1607
1757
1623
1451
1765


Summary of computational transaction
Raw Inputview raw input (R code)
Raw Outputview raw output of R engine
Computing time2 seconds
R Server'George Udny Yule' @ yule.wessa.net

\begin{tabular}{lllllllll}
\hline
Summary of computational transaction \tabularnewline
Raw Input & view raw input (R code)  \tabularnewline
Raw Output & view raw output of R engine  \tabularnewline
Computing time & 2 seconds \tabularnewline
R Server & 'George Udny Yule' @ yule.wessa.net \tabularnewline
\hline
\end{tabular}
%Source: https://freestatistics.org/blog/index.php?pk=282725&T=0

[TABLE]
[ROW][C]Summary of computational transaction[/C][/ROW]
[ROW][C]Raw Input[/C][C]view raw input (R code) [/C][/ROW]
[ROW][C]Raw Output[/C][C]view raw output of R engine [/C][/ROW]
[ROW][C]Computing time[/C][C]2 seconds[/C][/ROW]
[ROW][C]R Server[/C][C]'George Udny Yule' @ yule.wessa.net[/C][/ROW]
[/TABLE]
Source: https://freestatistics.org/blog/index.php?pk=282725&T=0

Globally Unique Identifier (entire table): ba.freestatistics.org/blog/index.php?pk=282725&T=0

As an alternative you can also use a QR Code:  

The GUIDs for individual cells are displayed in the table below:

Summary of computational transaction
Raw Inputview raw input (R code)
Raw Outputview raw output of R engine
Computing time2 seconds
R Server'George Udny Yule' @ yule.wessa.net


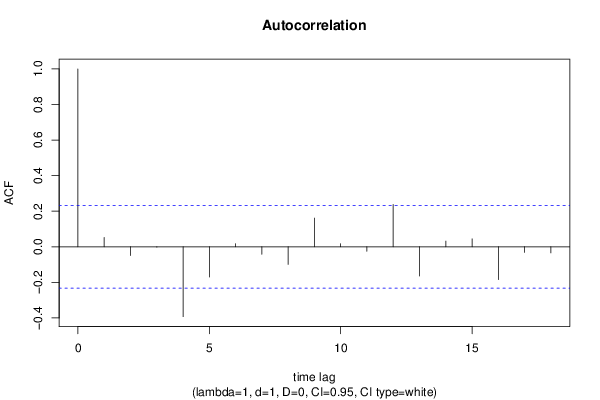
Autocorrelation Function
Time lag kACF(k)T-STATP-value
10.0525380.44270.329665
2-0.048864-0.41170.340888
3-0.001839-0.01550.493841
4-0.392755-3.30940.000735
5-0.170121-1.43350.078057
60.0170720.14390.443013
7-0.042355-0.35690.361117
8-0.098917-0.83350.203683
90.1613781.35980.089098
100.0171720.14470.442682
11-0.025013-0.21080.416838
120.2380592.00590.024338
13-0.16434-1.38480.085232
140.0320570.27010.393926
150.044730.37690.353685
16-0.18445-1.55420.062291
17-0.031453-0.2650.395878
18-0.034227-0.28840.386939

\begin{tabular}{lllllllll}
\hline
Autocorrelation Function \tabularnewline
Time lag k & ACF(k) & T-STAT & P-value \tabularnewline
1 & 0.052538 & 0.4427 & 0.329665 \tabularnewline
2 & -0.048864 & -0.4117 & 0.340888 \tabularnewline
3 & -0.001839 & -0.0155 & 0.493841 \tabularnewline
4 & -0.392755 & -3.3094 & 0.000735 \tabularnewline
5 & -0.170121 & -1.4335 & 0.078057 \tabularnewline
6 & 0.017072 & 0.1439 & 0.443013 \tabularnewline
7 & -0.042355 & -0.3569 & 0.361117 \tabularnewline
8 & -0.098917 & -0.8335 & 0.203683 \tabularnewline
9 & 0.161378 & 1.3598 & 0.089098 \tabularnewline
10 & 0.017172 & 0.1447 & 0.442682 \tabularnewline
11 & -0.025013 & -0.2108 & 0.416838 \tabularnewline
12 & 0.238059 & 2.0059 & 0.024338 \tabularnewline
13 & -0.16434 & -1.3848 & 0.085232 \tabularnewline
14 & 0.032057 & 0.2701 & 0.393926 \tabularnewline
15 & 0.04473 & 0.3769 & 0.353685 \tabularnewline
16 & -0.18445 & -1.5542 & 0.062291 \tabularnewline
17 & -0.031453 & -0.265 & 0.395878 \tabularnewline
18 & -0.034227 & -0.2884 & 0.386939 \tabularnewline
\hline
\end{tabular}
%Source: https://freestatistics.org/blog/index.php?pk=282725&T=1

[TABLE]
[ROW][C]Autocorrelation Function[/C][/ROW]
[ROW][C]Time lag k[/C][C]ACF(k)[/C][C]T-STAT[/C][C]P-value[/C][/ROW]
[ROW][C]1[/C][C]0.052538[/C][C]0.4427[/C][C]0.329665[/C][/ROW]
[ROW][C]2[/C][C]-0.048864[/C][C]-0.4117[/C][C]0.340888[/C][/ROW]
[ROW][C]3[/C][C]-0.001839[/C][C]-0.0155[/C][C]0.493841[/C][/ROW]
[ROW][C]4[/C][C]-0.392755[/C][C]-3.3094[/C][C]0.000735[/C][/ROW]
[ROW][C]5[/C][C]-0.170121[/C][C]-1.4335[/C][C]0.078057[/C][/ROW]
[ROW][C]6[/C][C]0.017072[/C][C]0.1439[/C][C]0.443013[/C][/ROW]
[ROW][C]7[/C][C]-0.042355[/C][C]-0.3569[/C][C]0.361117[/C][/ROW]
[ROW][C]8[/C][C]-0.098917[/C][C]-0.8335[/C][C]0.203683[/C][/ROW]
[ROW][C]9[/C][C]0.161378[/C][C]1.3598[/C][C]0.089098[/C][/ROW]
[ROW][C]10[/C][C]0.017172[/C][C]0.1447[/C][C]0.442682[/C][/ROW]
[ROW][C]11[/C][C]-0.025013[/C][C]-0.2108[/C][C]0.416838[/C][/ROW]
[ROW][C]12[/C][C]0.238059[/C][C]2.0059[/C][C]0.024338[/C][/ROW]
[ROW][C]13[/C][C]-0.16434[/C][C]-1.3848[/C][C]0.085232[/C][/ROW]
[ROW][C]14[/C][C]0.032057[/C][C]0.2701[/C][C]0.393926[/C][/ROW]
[ROW][C]15[/C][C]0.04473[/C][C]0.3769[/C][C]0.353685[/C][/ROW]
[ROW][C]16[/C][C]-0.18445[/C][C]-1.5542[/C][C]0.062291[/C][/ROW]
[ROW][C]17[/C][C]-0.031453[/C][C]-0.265[/C][C]0.395878[/C][/ROW]
[ROW][C]18[/C][C]-0.034227[/C][C]-0.2884[/C][C]0.386939[/C][/ROW]
[/TABLE]
Source: https://freestatistics.org/blog/index.php?pk=282725&T=1

Globally Unique Identifier (entire table): ba.freestatistics.org/blog/index.php?pk=282725&T=1

As an alternative you can also use a QR Code:  

The GUIDs for individual cells are displayed in the table below:

Autocorrelation Function
Time lag kACF(k)T-STATP-value
10.0525380.44270.329665
2-0.048864-0.41170.340888
3-0.001839-0.01550.493841
4-0.392755-3.30940.000735
5-0.170121-1.43350.078057
60.0170720.14390.443013
7-0.042355-0.35690.361117
8-0.098917-0.83350.203683
90.1613781.35980.089098
100.0171720.14470.442682
11-0.025013-0.21080.416838
120.2380592.00590.024338
13-0.16434-1.38480.085232
140.0320570.27010.393926
150.044730.37690.353685
16-0.18445-1.55420.062291
17-0.031453-0.2650.395878
18-0.034227-0.28840.386939


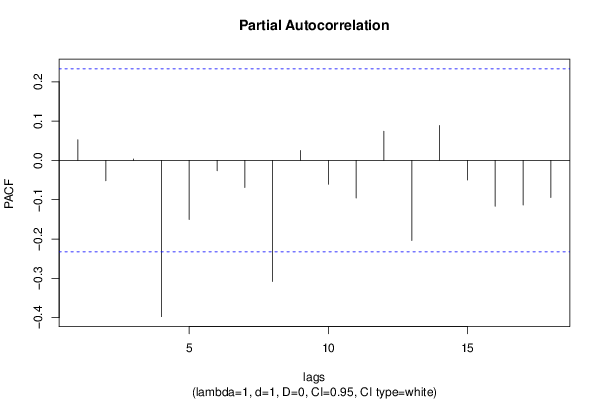
Partial Autocorrelation Function
Time lag kPACF(k)T-STATP-value
10.0525380.44270.329665
2-0.051767-0.43620.332009
30.0036010.03030.487941
4-0.397546-3.34980.000649
5-0.150205-1.26560.104889
6-0.026282-0.22150.412687
7-0.068981-0.58120.28146
8-0.308126-2.59630.005722
90.0252010.21230.416222
10-0.06072-0.51160.305247
11-0.095804-0.80730.211107
120.0742340.62550.266821
13-0.203723-1.71660.045206
140.0888130.74840.22836
15-0.050133-0.42240.336995
16-0.116613-0.98260.164571
17-0.113437-0.95580.171199
18-0.094448-0.79580.214392

\begin{tabular}{lllllllll}
\hline
Partial Autocorrelation Function \tabularnewline
Time lag k & PACF(k) & T-STAT & P-value \tabularnewline
1 & 0.052538 & 0.4427 & 0.329665 \tabularnewline
2 & -0.051767 & -0.4362 & 0.332009 \tabularnewline
3 & 0.003601 & 0.0303 & 0.487941 \tabularnewline
4 & -0.397546 & -3.3498 & 0.000649 \tabularnewline
5 & -0.150205 & -1.2656 & 0.104889 \tabularnewline
6 & -0.026282 & -0.2215 & 0.412687 \tabularnewline
7 & -0.068981 & -0.5812 & 0.28146 \tabularnewline
8 & -0.308126 & -2.5963 & 0.005722 \tabularnewline
9 & 0.025201 & 0.2123 & 0.416222 \tabularnewline
10 & -0.06072 & -0.5116 & 0.305247 \tabularnewline
11 & -0.095804 & -0.8073 & 0.211107 \tabularnewline
12 & 0.074234 & 0.6255 & 0.266821 \tabularnewline
13 & -0.203723 & -1.7166 & 0.045206 \tabularnewline
14 & 0.088813 & 0.7484 & 0.22836 \tabularnewline
15 & -0.050133 & -0.4224 & 0.336995 \tabularnewline
16 & -0.116613 & -0.9826 & 0.164571 \tabularnewline
17 & -0.113437 & -0.9558 & 0.171199 \tabularnewline
18 & -0.094448 & -0.7958 & 0.214392 \tabularnewline
\hline
\end{tabular}
%Source: https://freestatistics.org/blog/index.php?pk=282725&T=2

[TABLE]
[ROW][C]Partial Autocorrelation Function[/C][/ROW]
[ROW][C]Time lag k[/C][C]PACF(k)[/C][C]T-STAT[/C][C]P-value[/C][/ROW]
[ROW][C]1[/C][C]0.052538[/C][C]0.4427[/C][C]0.329665[/C][/ROW]
[ROW][C]2[/C][C]-0.051767[/C][C]-0.4362[/C][C]0.332009[/C][/ROW]
[ROW][C]3[/C][C]0.003601[/C][C]0.0303[/C][C]0.487941[/C][/ROW]
[ROW][C]4[/C][C]-0.397546[/C][C]-3.3498[/C][C]0.000649[/C][/ROW]
[ROW][C]5[/C][C]-0.150205[/C][C]-1.2656[/C][C]0.104889[/C][/ROW]
[ROW][C]6[/C][C]-0.026282[/C][C]-0.2215[/C][C]0.412687[/C][/ROW]
[ROW][C]7[/C][C]-0.068981[/C][C]-0.5812[/C][C]0.28146[/C][/ROW]
[ROW][C]8[/C][C]-0.308126[/C][C]-2.5963[/C][C]0.005722[/C][/ROW]
[ROW][C]9[/C][C]0.025201[/C][C]0.2123[/C][C]0.416222[/C][/ROW]
[ROW][C]10[/C][C]-0.06072[/C][C]-0.5116[/C][C]0.305247[/C][/ROW]
[ROW][C]11[/C][C]-0.095804[/C][C]-0.8073[/C][C]0.211107[/C][/ROW]
[ROW][C]12[/C][C]0.074234[/C][C]0.6255[/C][C]0.266821[/C][/ROW]
[ROW][C]13[/C][C]-0.203723[/C][C]-1.7166[/C][C]0.045206[/C][/ROW]
[ROW][C]14[/C][C]0.088813[/C][C]0.7484[/C][C]0.22836[/C][/ROW]
[ROW][C]15[/C][C]-0.050133[/C][C]-0.4224[/C][C]0.336995[/C][/ROW]
[ROW][C]16[/C][C]-0.116613[/C][C]-0.9826[/C][C]0.164571[/C][/ROW]
[ROW][C]17[/C][C]-0.113437[/C][C]-0.9558[/C][C]0.171199[/C][/ROW]
[ROW][C]18[/C][C]-0.094448[/C][C]-0.7958[/C][C]0.214392[/C][/ROW]
[/TABLE]
Source: https://freestatistics.org/blog/index.php?pk=282725&T=2

Globally Unique Identifier (entire table): ba.freestatistics.org/blog/index.php?pk=282725&T=2

As an alternative you can also use a QR Code:  

The GUIDs for individual cells are displayed in the table below:

Partial Autocorrelation Function
Time lag kPACF(k)T-STATP-value
10.0525380.44270.329665
2-0.051767-0.43620.332009
30.0036010.03030.487941
4-0.397546-3.34980.000649
5-0.150205-1.26560.104889
6-0.026282-0.22150.412687
7-0.068981-0.58120.28146
8-0.308126-2.59630.005722
90.0252010.21230.416222
10-0.06072-0.51160.305247
11-0.095804-0.80730.211107
120.0742340.62550.266821
13-0.203723-1.71660.045206
140.0888130.74840.22836
15-0.050133-0.42240.336995
16-0.116613-0.98260.164571
17-0.113437-0.95580.171199
18-0.094448-0.79580.214392


Parameters (Session):
par1 = Default ; par2 = 1 ; par3 = 1 ; par4 = 0 ; par5 = 12 ; par6 = White Noise ; par7 = 0.95 ;
Parameters (R input):
par1 = Default ; par2 = 1 ; par3 = 1 ; par4 = 0 ; par5 = 12 ; par6 = White Noise ; par7 = 0.95 ; par8 = ;
R code (references can be found in the software module):
if (par1 == 'Default') {
par1 = 10*log10(length(x))
} else {
par1 <- as.numeric(par1)
}
par2 <- as.numeric(par2)
par3 <- as.numeric(par3)
par4 <- as.numeric(par4)
par5 <- as.numeric(par5)
if (par6 == 'White Noise') par6 <- 'white' else par6 <- 'ma'
par7 <- as.numeric(par7)
if (par8 != '') par8 <- as.numeric(par8)
ox <- x
if (par8 == '') {
if (par2 == 0) {
x <- log(x)
} else {
x <- (x ^ par2 - 1) / par2
}
} else {
x <- log(x,base=par8)
}
if (par3 > 0) x <- diff(x,lag=1,difference=par3)
if (par4 > 0) x <- diff(x,lag=par5,difference=par4)
bitmap(file='picts.png')
op <- par(mfrow=c(2,1))
plot(ox,type='l',main='Original Time Series',xlab='time',ylab='value')
if (par8=='') {
mytitle <- paste('Working Time Series (lambda=',par2,', d=',par3,', D=',par4,')',sep='')
mysub <- paste('(lambda=',par2,', d=',par3,', D=',par4,', CI=', par7, ', CI type=',par6,')',sep='')
} else {
mytitle <- paste('Working Time Series (base=',par8,', d=',par3,', D=',par4,')',sep='')
mysub <- paste('(base=',par8,', d=',par3,', D=',par4,', CI=', par7, ', CI type=',par6,')',sep='')
}
plot(x,type='l', main=mytitle,xlab='time',ylab='value')
par(op)
dev.off()
bitmap(file='pic1.png')
racf <- acf(x, par1, main='Autocorrelation', xlab='time lag', ylab='ACF', ci.type=par6, ci=par7, sub=mysub)
dev.off()
bitmap(file='pic2.png')
rpacf <- pacf(x,par1,main='Partial Autocorrelation',xlab='lags',ylab='PACF',sub=mysub)
dev.off()
(myacf <- c(racf$acf))
(mypacf <- c(rpacf$acf))
lengthx <- length(x)
sqrtn <- sqrt(lengthx)
load(file='createtable')
a<-table.start()
a<-table.row.start(a)
a<-table.element(a,'Autocorrelation Function',4,TRUE)
a<-table.row.end(a)
a<-table.row.start(a)
a<-table.element(a,'Time lag k',header=TRUE)
a<-table.element(a,hyperlink('basics.htm','ACF(k)','click here for more information about the Autocorrelation Function'),header=TRUE)
a<-table.element(a,'T-STAT',header=TRUE)
a<-table.element(a,'P-value',header=TRUE)
a<-table.row.end(a)
for (i in 2:(par1+1)) {
a<-table.row.start(a)
a<-table.element(a,i-1,header=TRUE)
a<-table.element(a,round(myacf[i],6))
mytstat <- myacf[i]*sqrtn
a<-table.element(a,round(mytstat,4))
a<-table.element(a,round(1-pt(abs(mytstat),lengthx),6))
a<-table.row.end(a)
}
a<-table.end(a)
table.save(a,file='mytable.tab')
a<-table.start()
a<-table.row.start(a)
a<-table.element(a,'Partial Autocorrelation Function',4,TRUE)
a<-table.row.end(a)
a<-table.row.start(a)
a<-table.element(a,'Time lag k',header=TRUE)
a<-table.element(a,hyperlink('basics.htm','PACF(k)','click here for more information about the Partial Autocorrelation Function'),header=TRUE)
a<-table.element(a,'T-STAT',header=TRUE)
a<-table.element(a,'P-value',header=TRUE)
a<-table.row.end(a)
for (i in 1:par1) {
a<-table.row.start(a)
a<-table.element(a,i,header=TRUE)
a<-table.element(a,round(mypacf[i],6))
mytstat <- mypacf[i]*sqrtn
a<-table.element(a,round(mytstat,4))
a<-table.element(a,round(1-pt(abs(mytstat),lengthx),6))
a<-table.row.end(a)
}
a<-table.end(a)
table.save(a,file='mytable1.tab')