Free Statistics

of Irreproducible Research!

Author's title

Author*Unverified author*
R Software Modulerwasp_autocorrelation.wasp
Title produced by software(Partial) Autocorrelation Function
Date of computationFri, 23 Oct 2015 08:56:16 +0100
Cite this page as followsStatistical Computations at FreeStatistics.org, Office for Research Development and Education, URL https://freestatistics.org/blog/index.php?v=date/2015/Oct/23/t1445587016s88aenhn2df22we.htm/, Retrieved Tue, 14 May 2024 22:50:22 +0000
Statistical Computations at FreeStatistics.org, Office for Research Development and Education, URL https://freestatistics.org/blog/index.php?pk=282816, Retrieved Tue, 14 May 2024 22:50:22 +0000
QR Codes:

Original text written by user:
IsPrivate?No (this computation is public)
User-defined keywords
Estimated Impact113
Family? (F = Feedback message, R = changed R code, M = changed R Module, P = changed Parameters, D = changed Data)
-       [(Partial) Autocorrelation Function] [Afzetprijsindex v...] [2015-10-23 07:56:16] [2d6a838730984919764007611a305b0c] [Current]
Feedback Forum

Post a new message
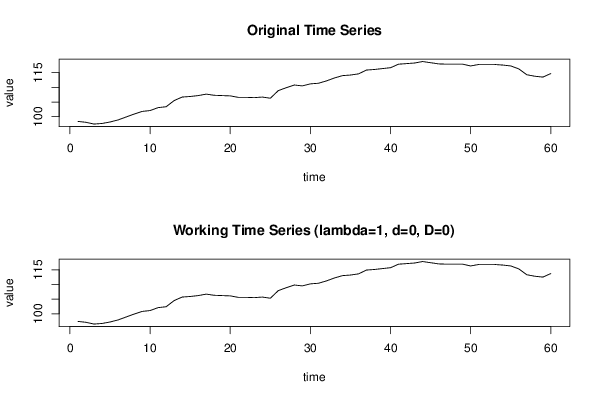
Dataseries X:
98.4
98.1
97.5
97.7
98.2
98.9
99.9
100.9
101.8
102.1
103.1
103.4
105.5
106.7
106.9
107.2
107.7
107.3
107.2
107.1
106.6
106.6
106.5
106.7
106.3
108.9
109.9
110.8
110.5
111.2
111.4
112.2
113.2
114
114.2
114.6
115.9
116.1
116.4
116.7
117.9
118.1
118.3
118.8
118.4
118
117.9
117.9
117.9
117.3
117.8
117.8
117.8
117.6
117.3
116.3
114.3
113.8
113.5
114.7


Summary of computational transaction
Raw Inputview raw input (R code)
Raw Outputview raw output of R engine
Computing time1 seconds
R Server'Gwilym Jenkins' @ jenkins.wessa.net

\begin{tabular}{lllllllll}
\hline
Summary of computational transaction \tabularnewline
Raw Input & view raw input (R code)  \tabularnewline
Raw Output & view raw output of R engine  \tabularnewline
Computing time & 1 seconds \tabularnewline
R Server & 'Gwilym Jenkins' @ jenkins.wessa.net \tabularnewline
\hline
\end{tabular}
%Source: https://freestatistics.org/blog/index.php?pk=282816&T=0

[TABLE]
[ROW][C]Summary of computational transaction[/C][/ROW]
[ROW][C]Raw Input[/C][C]view raw input (R code) [/C][/ROW]
[ROW][C]Raw Output[/C][C]view raw output of R engine [/C][/ROW]
[ROW][C]Computing time[/C][C]1 seconds[/C][/ROW]
[ROW][C]R Server[/C][C]'Gwilym Jenkins' @ jenkins.wessa.net[/C][/ROW]
[/TABLE]
Source: https://freestatistics.org/blog/index.php?pk=282816&T=0

Globally Unique Identifier (entire table): ba.freestatistics.org/blog/index.php?pk=282816&T=0

As an alternative you can also use a QR Code:  

The GUIDs for individual cells are displayed in the table below:

Summary of computational transaction
Raw Inputview raw input (R code)
Raw Outputview raw output of R engine
Computing time1 seconds
R Server'Gwilym Jenkins' @ jenkins.wessa.net


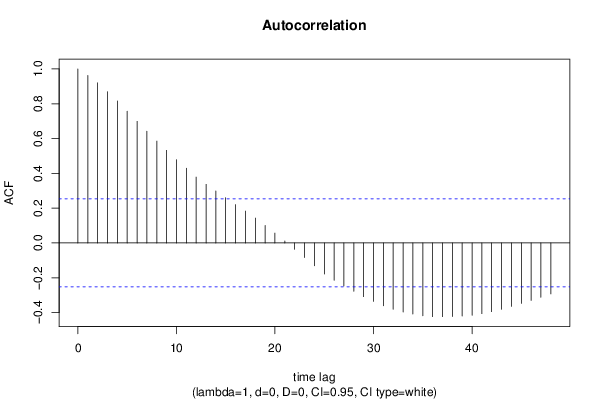
Autocorrelation Function
Time lag kACF(k)T-STATP-value
10.962767.45750
20.9200717.12680
30.8690126.73130
40.8154196.31620
50.7571455.86480
60.698635.41161e-06
70.6415794.96963e-06
80.5855064.53531.4e-05
90.5322584.12295.8e-05
100.4787083.70810.000229
110.4293613.32580.000754
120.3785462.93220.002379
130.3367912.60880.005727
140.2985132.31230.012106
150.2599972.01390.024254
160.2205461.70830.046371
170.1829271.41690.080836
180.1426521.1050.13679
190.1007260.78020.219165
200.0565940.43840.331345
210.0110530.08560.466027
22-0.035828-0.27750.391168
23-0.083506-0.64680.260103
24-0.130718-1.01250.157673
25-0.178155-1.380.086356
26-0.214499-1.66150.050915
27-0.247596-1.91790.029945
28-0.277193-2.14710.017917
29-0.308574-2.39020.009998
30-0.335617-2.59970.005864
31-0.361194-2.79780.003453
32-0.380626-2.94830.002274
33-0.396606-3.07210.001597
34-0.408034-3.16060.001234
35-0.418485-3.24160.000971
36-0.423305-3.27890.000868
37-0.423471-3.28020.000865
38-0.422302-3.27110.000889
39-0.420032-3.25360.000937
40-0.415741-3.22030.001034
41-0.406141-3.1460.001288
42-0.394697-3.05730.001666
43-0.381285-2.95340.002241
44-0.3647-2.8250.003206
45-0.347278-2.690.00462
46-0.330071-2.55670.006557
47-0.31225-2.41870.009314
48-0.29265-2.26690.013508

\begin{tabular}{lllllllll}
\hline
Autocorrelation Function \tabularnewline
Time lag k & ACF(k) & T-STAT & P-value \tabularnewline
1 & 0.96276 & 7.4575 & 0 \tabularnewline
2 & 0.920071 & 7.1268 & 0 \tabularnewline
3 & 0.869012 & 6.7313 & 0 \tabularnewline
4 & 0.815419 & 6.3162 & 0 \tabularnewline
5 & 0.757145 & 5.8648 & 0 \tabularnewline
6 & 0.69863 & 5.4116 & 1e-06 \tabularnewline
7 & 0.641579 & 4.9696 & 3e-06 \tabularnewline
8 & 0.585506 & 4.5353 & 1.4e-05 \tabularnewline
9 & 0.532258 & 4.1229 & 5.8e-05 \tabularnewline
10 & 0.478708 & 3.7081 & 0.000229 \tabularnewline
11 & 0.429361 & 3.3258 & 0.000754 \tabularnewline
12 & 0.378546 & 2.9322 & 0.002379 \tabularnewline
13 & 0.336791 & 2.6088 & 0.005727 \tabularnewline
14 & 0.298513 & 2.3123 & 0.012106 \tabularnewline
15 & 0.259997 & 2.0139 & 0.024254 \tabularnewline
16 & 0.220546 & 1.7083 & 0.046371 \tabularnewline
17 & 0.182927 & 1.4169 & 0.080836 \tabularnewline
18 & 0.142652 & 1.105 & 0.13679 \tabularnewline
19 & 0.100726 & 0.7802 & 0.219165 \tabularnewline
20 & 0.056594 & 0.4384 & 0.331345 \tabularnewline
21 & 0.011053 & 0.0856 & 0.466027 \tabularnewline
22 & -0.035828 & -0.2775 & 0.391168 \tabularnewline
23 & -0.083506 & -0.6468 & 0.260103 \tabularnewline
24 & -0.130718 & -1.0125 & 0.157673 \tabularnewline
25 & -0.178155 & -1.38 & 0.086356 \tabularnewline
26 & -0.214499 & -1.6615 & 0.050915 \tabularnewline
27 & -0.247596 & -1.9179 & 0.029945 \tabularnewline
28 & -0.277193 & -2.1471 & 0.017917 \tabularnewline
29 & -0.308574 & -2.3902 & 0.009998 \tabularnewline
30 & -0.335617 & -2.5997 & 0.005864 \tabularnewline
31 & -0.361194 & -2.7978 & 0.003453 \tabularnewline
32 & -0.380626 & -2.9483 & 0.002274 \tabularnewline
33 & -0.396606 & -3.0721 & 0.001597 \tabularnewline
34 & -0.408034 & -3.1606 & 0.001234 \tabularnewline
35 & -0.418485 & -3.2416 & 0.000971 \tabularnewline
36 & -0.423305 & -3.2789 & 0.000868 \tabularnewline
37 & -0.423471 & -3.2802 & 0.000865 \tabularnewline
38 & -0.422302 & -3.2711 & 0.000889 \tabularnewline
39 & -0.420032 & -3.2536 & 0.000937 \tabularnewline
40 & -0.415741 & -3.2203 & 0.001034 \tabularnewline
41 & -0.406141 & -3.146 & 0.001288 \tabularnewline
42 & -0.394697 & -3.0573 & 0.001666 \tabularnewline
43 & -0.381285 & -2.9534 & 0.002241 \tabularnewline
44 & -0.3647 & -2.825 & 0.003206 \tabularnewline
45 & -0.347278 & -2.69 & 0.00462 \tabularnewline
46 & -0.330071 & -2.5567 & 0.006557 \tabularnewline
47 & -0.31225 & -2.4187 & 0.009314 \tabularnewline
48 & -0.29265 & -2.2669 & 0.013508 \tabularnewline
\hline
\end{tabular}
%Source: https://freestatistics.org/blog/index.php?pk=282816&T=1

[TABLE]
[ROW][C]Autocorrelation Function[/C][/ROW]
[ROW][C]Time lag k[/C][C]ACF(k)[/C][C]T-STAT[/C][C]P-value[/C][/ROW]
[ROW][C]1[/C][C]0.96276[/C][C]7.4575[/C][C]0[/C][/ROW]
[ROW][C]2[/C][C]0.920071[/C][C]7.1268[/C][C]0[/C][/ROW]
[ROW][C]3[/C][C]0.869012[/C][C]6.7313[/C][C]0[/C][/ROW]
[ROW][C]4[/C][C]0.815419[/C][C]6.3162[/C][C]0[/C][/ROW]
[ROW][C]5[/C][C]0.757145[/C][C]5.8648[/C][C]0[/C][/ROW]
[ROW][C]6[/C][C]0.69863[/C][C]5.4116[/C][C]1e-06[/C][/ROW]
[ROW][C]7[/C][C]0.641579[/C][C]4.9696[/C][C]3e-06[/C][/ROW]
[ROW][C]8[/C][C]0.585506[/C][C]4.5353[/C][C]1.4e-05[/C][/ROW]
[ROW][C]9[/C][C]0.532258[/C][C]4.1229[/C][C]5.8e-05[/C][/ROW]
[ROW][C]10[/C][C]0.478708[/C][C]3.7081[/C][C]0.000229[/C][/ROW]
[ROW][C]11[/C][C]0.429361[/C][C]3.3258[/C][C]0.000754[/C][/ROW]
[ROW][C]12[/C][C]0.378546[/C][C]2.9322[/C][C]0.002379[/C][/ROW]
[ROW][C]13[/C][C]0.336791[/C][C]2.6088[/C][C]0.005727[/C][/ROW]
[ROW][C]14[/C][C]0.298513[/C][C]2.3123[/C][C]0.012106[/C][/ROW]
[ROW][C]15[/C][C]0.259997[/C][C]2.0139[/C][C]0.024254[/C][/ROW]
[ROW][C]16[/C][C]0.220546[/C][C]1.7083[/C][C]0.046371[/C][/ROW]
[ROW][C]17[/C][C]0.182927[/C][C]1.4169[/C][C]0.080836[/C][/ROW]
[ROW][C]18[/C][C]0.142652[/C][C]1.105[/C][C]0.13679[/C][/ROW]
[ROW][C]19[/C][C]0.100726[/C][C]0.7802[/C][C]0.219165[/C][/ROW]
[ROW][C]20[/C][C]0.056594[/C][C]0.4384[/C][C]0.331345[/C][/ROW]
[ROW][C]21[/C][C]0.011053[/C][C]0.0856[/C][C]0.466027[/C][/ROW]
[ROW][C]22[/C][C]-0.035828[/C][C]-0.2775[/C][C]0.391168[/C][/ROW]
[ROW][C]23[/C][C]-0.083506[/C][C]-0.6468[/C][C]0.260103[/C][/ROW]
[ROW][C]24[/C][C]-0.130718[/C][C]-1.0125[/C][C]0.157673[/C][/ROW]
[ROW][C]25[/C][C]-0.178155[/C][C]-1.38[/C][C]0.086356[/C][/ROW]
[ROW][C]26[/C][C]-0.214499[/C][C]-1.6615[/C][C]0.050915[/C][/ROW]
[ROW][C]27[/C][C]-0.247596[/C][C]-1.9179[/C][C]0.029945[/C][/ROW]
[ROW][C]28[/C][C]-0.277193[/C][C]-2.1471[/C][C]0.017917[/C][/ROW]
[ROW][C]29[/C][C]-0.308574[/C][C]-2.3902[/C][C]0.009998[/C][/ROW]
[ROW][C]30[/C][C]-0.335617[/C][C]-2.5997[/C][C]0.005864[/C][/ROW]
[ROW][C]31[/C][C]-0.361194[/C][C]-2.7978[/C][C]0.003453[/C][/ROW]
[ROW][C]32[/C][C]-0.380626[/C][C]-2.9483[/C][C]0.002274[/C][/ROW]
[ROW][C]33[/C][C]-0.396606[/C][C]-3.0721[/C][C]0.001597[/C][/ROW]
[ROW][C]34[/C][C]-0.408034[/C][C]-3.1606[/C][C]0.001234[/C][/ROW]
[ROW][C]35[/C][C]-0.418485[/C][C]-3.2416[/C][C]0.000971[/C][/ROW]
[ROW][C]36[/C][C]-0.423305[/C][C]-3.2789[/C][C]0.000868[/C][/ROW]
[ROW][C]37[/C][C]-0.423471[/C][C]-3.2802[/C][C]0.000865[/C][/ROW]
[ROW][C]38[/C][C]-0.422302[/C][C]-3.2711[/C][C]0.000889[/C][/ROW]
[ROW][C]39[/C][C]-0.420032[/C][C]-3.2536[/C][C]0.000937[/C][/ROW]
[ROW][C]40[/C][C]-0.415741[/C][C]-3.2203[/C][C]0.001034[/C][/ROW]
[ROW][C]41[/C][C]-0.406141[/C][C]-3.146[/C][C]0.001288[/C][/ROW]
[ROW][C]42[/C][C]-0.394697[/C][C]-3.0573[/C][C]0.001666[/C][/ROW]
[ROW][C]43[/C][C]-0.381285[/C][C]-2.9534[/C][C]0.002241[/C][/ROW]
[ROW][C]44[/C][C]-0.3647[/C][C]-2.825[/C][C]0.003206[/C][/ROW]
[ROW][C]45[/C][C]-0.347278[/C][C]-2.69[/C][C]0.00462[/C][/ROW]
[ROW][C]46[/C][C]-0.330071[/C][C]-2.5567[/C][C]0.006557[/C][/ROW]
[ROW][C]47[/C][C]-0.31225[/C][C]-2.4187[/C][C]0.009314[/C][/ROW]
[ROW][C]48[/C][C]-0.29265[/C][C]-2.2669[/C][C]0.013508[/C][/ROW]
[/TABLE]
Source: https://freestatistics.org/blog/index.php?pk=282816&T=1

Globally Unique Identifier (entire table): ba.freestatistics.org/blog/index.php?pk=282816&T=1

As an alternative you can also use a QR Code:  

The GUIDs for individual cells are displayed in the table below:

Autocorrelation Function
Time lag kACF(k)T-STATP-value
10.962767.45750
20.9200717.12680
30.8690126.73130
40.8154196.31620
50.7571455.86480
60.698635.41161e-06
70.6415794.96963e-06
80.5855064.53531.4e-05
90.5322584.12295.8e-05
100.4787083.70810.000229
110.4293613.32580.000754
120.3785462.93220.002379
130.3367912.60880.005727
140.2985132.31230.012106
150.2599972.01390.024254
160.2205461.70830.046371
170.1829271.41690.080836
180.1426521.1050.13679
190.1007260.78020.219165
200.0565940.43840.331345
210.0110530.08560.466027
22-0.035828-0.27750.391168
23-0.083506-0.64680.260103
24-0.130718-1.01250.157673
25-0.178155-1.380.086356
26-0.214499-1.66150.050915
27-0.247596-1.91790.029945
28-0.277193-2.14710.017917
29-0.308574-2.39020.009998
30-0.335617-2.59970.005864
31-0.361194-2.79780.003453
32-0.380626-2.94830.002274
33-0.396606-3.07210.001597
34-0.408034-3.16060.001234
35-0.418485-3.24160.000971
36-0.423305-3.27890.000868
37-0.423471-3.28020.000865
38-0.422302-3.27110.000889
39-0.420032-3.25360.000937
40-0.415741-3.22030.001034
41-0.406141-3.1460.001288
42-0.394697-3.05730.001666
43-0.381285-2.95340.002241
44-0.3647-2.8250.003206
45-0.347278-2.690.00462
46-0.330071-2.55670.006557
47-0.31225-2.41870.009314
48-0.29265-2.26690.013508


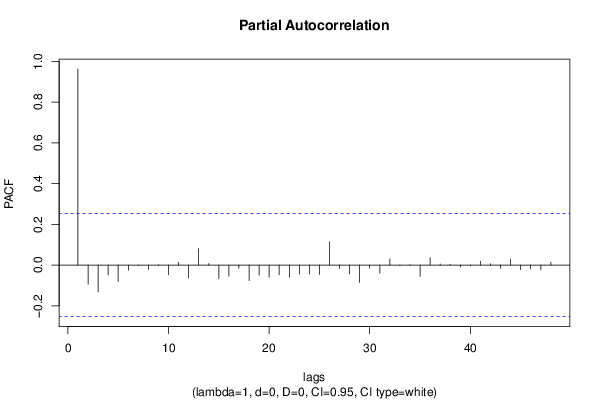
Partial Autocorrelation Function
Time lag kPACF(k)T-STATP-value
10.962767.45750
2-0.093526-0.72440.235804
3-0.132496-1.02630.154432
4-0.048342-0.37450.354694
5-0.080374-0.62260.267961
6-0.025027-0.19390.42347
7-0.002187-0.01690.49327
8-0.021913-0.16970.432893
90.0008660.00670.497336
10-0.047187-0.36550.358007
110.0133320.10330.459046
12-0.062725-0.48590.314416
130.0811050.62820.266117
140.0078920.06110.475728
15-0.065941-0.51080.305692
16-0.054201-0.41980.338051
17-0.014748-0.11420.454714
18-0.07613-0.58970.278802
19-0.050033-0.38760.349857
20-0.059464-0.46060.323374
21-0.047727-0.36970.356457
22-0.059014-0.45710.324619
23-0.043519-0.33710.368609
24-0.044023-0.3410.367146
25-0.046255-0.35830.360692
260.1136180.88010.191164
27-0.016936-0.13120.448034
28-0.043306-0.33540.36923
29-0.085138-0.65950.256056
30-0.015023-0.11640.453875
31-0.040199-0.31140.378295
320.0296640.22980.409523
33-0.002121-0.01640.493473
340.0020230.01570.493774
35-0.054759-0.42420.336483
360.0362080.28050.390042
370.005740.04450.482341
380.0034430.02670.489406
39-0.009525-0.07380.470715
40-0.003734-0.02890.488511
410.019320.14970.440771
420.006590.0510.479728
43-0.015953-0.12360.451033
440.0286170.22170.412665
45-0.022263-0.17250.431832
46-0.018386-0.14240.443615
47-0.023599-0.18280.427786
480.0145640.11280.455277

\begin{tabular}{lllllllll}
\hline
Partial Autocorrelation Function \tabularnewline
Time lag k & PACF(k) & T-STAT & P-value \tabularnewline
1 & 0.96276 & 7.4575 & 0 \tabularnewline
2 & -0.093526 & -0.7244 & 0.235804 \tabularnewline
3 & -0.132496 & -1.0263 & 0.154432 \tabularnewline
4 & -0.048342 & -0.3745 & 0.354694 \tabularnewline
5 & -0.080374 & -0.6226 & 0.267961 \tabularnewline
6 & -0.025027 & -0.1939 & 0.42347 \tabularnewline
7 & -0.002187 & -0.0169 & 0.49327 \tabularnewline
8 & -0.021913 & -0.1697 & 0.432893 \tabularnewline
9 & 0.000866 & 0.0067 & 0.497336 \tabularnewline
10 & -0.047187 & -0.3655 & 0.358007 \tabularnewline
11 & 0.013332 & 0.1033 & 0.459046 \tabularnewline
12 & -0.062725 & -0.4859 & 0.314416 \tabularnewline
13 & 0.081105 & 0.6282 & 0.266117 \tabularnewline
14 & 0.007892 & 0.0611 & 0.475728 \tabularnewline
15 & -0.065941 & -0.5108 & 0.305692 \tabularnewline
16 & -0.054201 & -0.4198 & 0.338051 \tabularnewline
17 & -0.014748 & -0.1142 & 0.454714 \tabularnewline
18 & -0.07613 & -0.5897 & 0.278802 \tabularnewline
19 & -0.050033 & -0.3876 & 0.349857 \tabularnewline
20 & -0.059464 & -0.4606 & 0.323374 \tabularnewline
21 & -0.047727 & -0.3697 & 0.356457 \tabularnewline
22 & -0.059014 & -0.4571 & 0.324619 \tabularnewline
23 & -0.043519 & -0.3371 & 0.368609 \tabularnewline
24 & -0.044023 & -0.341 & 0.367146 \tabularnewline
25 & -0.046255 & -0.3583 & 0.360692 \tabularnewline
26 & 0.113618 & 0.8801 & 0.191164 \tabularnewline
27 & -0.016936 & -0.1312 & 0.448034 \tabularnewline
28 & -0.043306 & -0.3354 & 0.36923 \tabularnewline
29 & -0.085138 & -0.6595 & 0.256056 \tabularnewline
30 & -0.015023 & -0.1164 & 0.453875 \tabularnewline
31 & -0.040199 & -0.3114 & 0.378295 \tabularnewline
32 & 0.029664 & 0.2298 & 0.409523 \tabularnewline
33 & -0.002121 & -0.0164 & 0.493473 \tabularnewline
34 & 0.002023 & 0.0157 & 0.493774 \tabularnewline
35 & -0.054759 & -0.4242 & 0.336483 \tabularnewline
36 & 0.036208 & 0.2805 & 0.390042 \tabularnewline
37 & 0.00574 & 0.0445 & 0.482341 \tabularnewline
38 & 0.003443 & 0.0267 & 0.489406 \tabularnewline
39 & -0.009525 & -0.0738 & 0.470715 \tabularnewline
40 & -0.003734 & -0.0289 & 0.488511 \tabularnewline
41 & 0.01932 & 0.1497 & 0.440771 \tabularnewline
42 & 0.00659 & 0.051 & 0.479728 \tabularnewline
43 & -0.015953 & -0.1236 & 0.451033 \tabularnewline
44 & 0.028617 & 0.2217 & 0.412665 \tabularnewline
45 & -0.022263 & -0.1725 & 0.431832 \tabularnewline
46 & -0.018386 & -0.1424 & 0.443615 \tabularnewline
47 & -0.023599 & -0.1828 & 0.427786 \tabularnewline
48 & 0.014564 & 0.1128 & 0.455277 \tabularnewline
\hline
\end{tabular}
%Source: https://freestatistics.org/blog/index.php?pk=282816&T=2

[TABLE]
[ROW][C]Partial Autocorrelation Function[/C][/ROW]
[ROW][C]Time lag k[/C][C]PACF(k)[/C][C]T-STAT[/C][C]P-value[/C][/ROW]
[ROW][C]1[/C][C]0.96276[/C][C]7.4575[/C][C]0[/C][/ROW]
[ROW][C]2[/C][C]-0.093526[/C][C]-0.7244[/C][C]0.235804[/C][/ROW]
[ROW][C]3[/C][C]-0.132496[/C][C]-1.0263[/C][C]0.154432[/C][/ROW]
[ROW][C]4[/C][C]-0.048342[/C][C]-0.3745[/C][C]0.354694[/C][/ROW]
[ROW][C]5[/C][C]-0.080374[/C][C]-0.6226[/C][C]0.267961[/C][/ROW]
[ROW][C]6[/C][C]-0.025027[/C][C]-0.1939[/C][C]0.42347[/C][/ROW]
[ROW][C]7[/C][C]-0.002187[/C][C]-0.0169[/C][C]0.49327[/C][/ROW]
[ROW][C]8[/C][C]-0.021913[/C][C]-0.1697[/C][C]0.432893[/C][/ROW]
[ROW][C]9[/C][C]0.000866[/C][C]0.0067[/C][C]0.497336[/C][/ROW]
[ROW][C]10[/C][C]-0.047187[/C][C]-0.3655[/C][C]0.358007[/C][/ROW]
[ROW][C]11[/C][C]0.013332[/C][C]0.1033[/C][C]0.459046[/C][/ROW]
[ROW][C]12[/C][C]-0.062725[/C][C]-0.4859[/C][C]0.314416[/C][/ROW]
[ROW][C]13[/C][C]0.081105[/C][C]0.6282[/C][C]0.266117[/C][/ROW]
[ROW][C]14[/C][C]0.007892[/C][C]0.0611[/C][C]0.475728[/C][/ROW]
[ROW][C]15[/C][C]-0.065941[/C][C]-0.5108[/C][C]0.305692[/C][/ROW]
[ROW][C]16[/C][C]-0.054201[/C][C]-0.4198[/C][C]0.338051[/C][/ROW]
[ROW][C]17[/C][C]-0.014748[/C][C]-0.1142[/C][C]0.454714[/C][/ROW]
[ROW][C]18[/C][C]-0.07613[/C][C]-0.5897[/C][C]0.278802[/C][/ROW]
[ROW][C]19[/C][C]-0.050033[/C][C]-0.3876[/C][C]0.349857[/C][/ROW]
[ROW][C]20[/C][C]-0.059464[/C][C]-0.4606[/C][C]0.323374[/C][/ROW]
[ROW][C]21[/C][C]-0.047727[/C][C]-0.3697[/C][C]0.356457[/C][/ROW]
[ROW][C]22[/C][C]-0.059014[/C][C]-0.4571[/C][C]0.324619[/C][/ROW]
[ROW][C]23[/C][C]-0.043519[/C][C]-0.3371[/C][C]0.368609[/C][/ROW]
[ROW][C]24[/C][C]-0.044023[/C][C]-0.341[/C][C]0.367146[/C][/ROW]
[ROW][C]25[/C][C]-0.046255[/C][C]-0.3583[/C][C]0.360692[/C][/ROW]
[ROW][C]26[/C][C]0.113618[/C][C]0.8801[/C][C]0.191164[/C][/ROW]
[ROW][C]27[/C][C]-0.016936[/C][C]-0.1312[/C][C]0.448034[/C][/ROW]
[ROW][C]28[/C][C]-0.043306[/C][C]-0.3354[/C][C]0.36923[/C][/ROW]
[ROW][C]29[/C][C]-0.085138[/C][C]-0.6595[/C][C]0.256056[/C][/ROW]
[ROW][C]30[/C][C]-0.015023[/C][C]-0.1164[/C][C]0.453875[/C][/ROW]
[ROW][C]31[/C][C]-0.040199[/C][C]-0.3114[/C][C]0.378295[/C][/ROW]
[ROW][C]32[/C][C]0.029664[/C][C]0.2298[/C][C]0.409523[/C][/ROW]
[ROW][C]33[/C][C]-0.002121[/C][C]-0.0164[/C][C]0.493473[/C][/ROW]
[ROW][C]34[/C][C]0.002023[/C][C]0.0157[/C][C]0.493774[/C][/ROW]
[ROW][C]35[/C][C]-0.054759[/C][C]-0.4242[/C][C]0.336483[/C][/ROW]
[ROW][C]36[/C][C]0.036208[/C][C]0.2805[/C][C]0.390042[/C][/ROW]
[ROW][C]37[/C][C]0.00574[/C][C]0.0445[/C][C]0.482341[/C][/ROW]
[ROW][C]38[/C][C]0.003443[/C][C]0.0267[/C][C]0.489406[/C][/ROW]
[ROW][C]39[/C][C]-0.009525[/C][C]-0.0738[/C][C]0.470715[/C][/ROW]
[ROW][C]40[/C][C]-0.003734[/C][C]-0.0289[/C][C]0.488511[/C][/ROW]
[ROW][C]41[/C][C]0.01932[/C][C]0.1497[/C][C]0.440771[/C][/ROW]
[ROW][C]42[/C][C]0.00659[/C][C]0.051[/C][C]0.479728[/C][/ROW]
[ROW][C]43[/C][C]-0.015953[/C][C]-0.1236[/C][C]0.451033[/C][/ROW]
[ROW][C]44[/C][C]0.028617[/C][C]0.2217[/C][C]0.412665[/C][/ROW]
[ROW][C]45[/C][C]-0.022263[/C][C]-0.1725[/C][C]0.431832[/C][/ROW]
[ROW][C]46[/C][C]-0.018386[/C][C]-0.1424[/C][C]0.443615[/C][/ROW]
[ROW][C]47[/C][C]-0.023599[/C][C]-0.1828[/C][C]0.427786[/C][/ROW]
[ROW][C]48[/C][C]0.014564[/C][C]0.1128[/C][C]0.455277[/C][/ROW]
[/TABLE]
Source: https://freestatistics.org/blog/index.php?pk=282816&T=2

Globally Unique Identifier (entire table): ba.freestatistics.org/blog/index.php?pk=282816&T=2

As an alternative you can also use a QR Code:  

The GUIDs for individual cells are displayed in the table below:

Partial Autocorrelation Function
Time lag kPACF(k)T-STATP-value
10.962767.45750
2-0.093526-0.72440.235804
3-0.132496-1.02630.154432
4-0.048342-0.37450.354694
5-0.080374-0.62260.267961
6-0.025027-0.19390.42347
7-0.002187-0.01690.49327
8-0.021913-0.16970.432893
90.0008660.00670.497336
10-0.047187-0.36550.358007
110.0133320.10330.459046
12-0.062725-0.48590.314416
130.0811050.62820.266117
140.0078920.06110.475728
15-0.065941-0.51080.305692
16-0.054201-0.41980.338051
17-0.014748-0.11420.454714
18-0.07613-0.58970.278802
19-0.050033-0.38760.349857
20-0.059464-0.46060.323374
21-0.047727-0.36970.356457
22-0.059014-0.45710.324619
23-0.043519-0.33710.368609
24-0.044023-0.3410.367146
25-0.046255-0.35830.360692
260.1136180.88010.191164
27-0.016936-0.13120.448034
28-0.043306-0.33540.36923
29-0.085138-0.65950.256056
30-0.015023-0.11640.453875
31-0.040199-0.31140.378295
320.0296640.22980.409523
33-0.002121-0.01640.493473
340.0020230.01570.493774
35-0.054759-0.42420.336483
360.0362080.28050.390042
370.005740.04450.482341
380.0034430.02670.489406
39-0.009525-0.07380.470715
40-0.003734-0.02890.488511
410.019320.14970.440771
420.006590.0510.479728
43-0.015953-0.12360.451033
440.0286170.22170.412665
45-0.022263-0.17250.431832
46-0.018386-0.14240.443615
47-0.023599-0.18280.427786
480.0145640.11280.455277


Parameters (Session):
par1 = 48 ; par2 = 1 ; par3 = 0 ; par4 = 0 ; par5 = 12 ; par6 = White Noise ; par7 = 0.95 ;
Parameters (R input):
par1 = 48 ; par2 = 1 ; par3 = 0 ; par4 = 0 ; par5 = 12 ; par6 = White Noise ; par7 = 0.95 ; par8 = ;
R code (references can be found in the software module):
par8 <- ''
par7 <- '0.95'
par6 <- 'White Noise'
par5 <- '12'
par4 <- '0'
par3 <- '0'
par2 <- '1'
par1 <- '12'
if (par1 == 'Default') {
par1 = 10*log10(length(x))
} else {
par1 <- as.numeric(par1)
}
par2 <- as.numeric(par2)
par3 <- as.numeric(par3)
par4 <- as.numeric(par4)
par5 <- as.numeric(par5)
if (par6 == 'White Noise') par6 <- 'white' else par6 <- 'ma'
par7 <- as.numeric(par7)
if (par8 != '') par8 <- as.numeric(par8)
ox <- x
if (par8 == '') {
if (par2 == 0) {
x <- log(x)
} else {
x <- (x ^ par2 - 1) / par2
}
} else {
x <- log(x,base=par8)
}
if (par3 > 0) x <- diff(x,lag=1,difference=par3)
if (par4 > 0) x <- diff(x,lag=par5,difference=par4)
bitmap(file='picts.png')
op <- par(mfrow=c(2,1))
plot(ox,type='l',main='Original Time Series',xlab='time',ylab='value')
if (par8=='') {
mytitle <- paste('Working Time Series (lambda=',par2,', d=',par3,', D=',par4,')',sep='')
mysub <- paste('(lambda=',par2,', d=',par3,', D=',par4,', CI=', par7, ', CI type=',par6,')',sep='')
} else {
mytitle <- paste('Working Time Series (base=',par8,', d=',par3,', D=',par4,')',sep='')
mysub <- paste('(base=',par8,', d=',par3,', D=',par4,', CI=', par7, ', CI type=',par6,')',sep='')
}
plot(x,type='l', main=mytitle,xlab='time',ylab='value')
par(op)
dev.off()
bitmap(file='pic1.png')
racf <- acf(x, par1, main='Autocorrelation', xlab='time lag', ylab='ACF', ci.type=par6, ci=par7, sub=mysub)
dev.off()
bitmap(file='pic2.png')
rpacf <- pacf(x,par1,main='Partial Autocorrelation',xlab='lags',ylab='PACF',sub=mysub)
dev.off()
(myacf <- c(racf$acf))
(mypacf <- c(rpacf$acf))
lengthx <- length(x)
sqrtn <- sqrt(lengthx)
load(file='createtable')
a<-table.start()
a<-table.row.start(a)
a<-table.element(a,'Autocorrelation Function',4,TRUE)
a<-table.row.end(a)
a<-table.row.start(a)
a<-table.element(a,'Time lag k',header=TRUE)
a<-table.element(a,hyperlink('basics.htm','ACF(k)','click here for more information about the Autocorrelation Function'),header=TRUE)
a<-table.element(a,'T-STAT',header=TRUE)
a<-table.element(a,'P-value',header=TRUE)
a<-table.row.end(a)
for (i in 2:(par1+1)) {
a<-table.row.start(a)
a<-table.element(a,i-1,header=TRUE)
a<-table.element(a,round(myacf[i],6))
mytstat <- myacf[i]*sqrtn
a<-table.element(a,round(mytstat,4))
a<-table.element(a,round(1-pt(abs(mytstat),lengthx),6))
a<-table.row.end(a)
}
a<-table.end(a)
table.save(a,file='mytable.tab')
a<-table.start()
a<-table.row.start(a)
a<-table.element(a,'Partial Autocorrelation Function',4,TRUE)
a<-table.row.end(a)
a<-table.row.start(a)
a<-table.element(a,'Time lag k',header=TRUE)
a<-table.element(a,hyperlink('basics.htm','PACF(k)','click here for more information about the Partial Autocorrelation Function'),header=TRUE)
a<-table.element(a,'T-STAT',header=TRUE)
a<-table.element(a,'P-value',header=TRUE)
a<-table.row.end(a)
for (i in 1:par1) {
a<-table.row.start(a)
a<-table.element(a,i,header=TRUE)
a<-table.element(a,round(mypacf[i],6))
mytstat <- mypacf[i]*sqrtn
a<-table.element(a,round(mytstat,4))
a<-table.element(a,round(1-pt(abs(mytstat),lengthx),6))
a<-table.row.end(a)
}
a<-table.end(a)
table.save(a,file='mytable1.tab')