Free Statistics

of Irreproducible Research!

Author's title

Author*Unverified author*
R Software Modulerwasp_autocorrelation.wasp
Title produced by software(Partial) Autocorrelation Function
Date of computationFri, 23 Oct 2015 08:59:49 +0100
Cite this page as followsStatistical Computations at FreeStatistics.org, Office for Research Development and Education, URL https://freestatistics.org/blog/index.php?v=date/2015/Oct/23/t14455872479wtpiif4y2r50zf.htm/, Retrieved Mon, 13 May 2024 23:37:26 +0000
Statistical Computations at FreeStatistics.org, Office for Research Development and Education, URL https://freestatistics.org/blog/index.php?pk=282818, Retrieved Mon, 13 May 2024 23:37:26 +0000
QR Codes:

Original text written by user:
IsPrivate?No (this computation is public)
User-defined keywords
Estimated Impact116
Family? (F = Feedback message, R = changed R code, M = changed R Module, P = changed Parameters, D = changed Data)
-       [(Partial) Autocorrelation Function] [] [2015-10-23 07:59:49] [4535d628e97572fda841f25b347e529f] [Current]
Feedback Forum

Post a new message
Dataseries X:
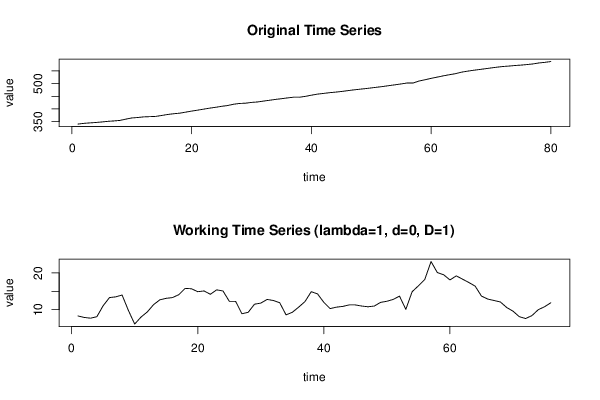
340.7
343.5
345.3
346.9
349
351.4
353
355
360.1
364.7
366.5
369
369.9
370.8
374.5
378.4
381.3
383.5
387.6
391.7
395.4
399.3
403.3
406.6
410.5
413.5
418.7
421.7
422.8
425.8
427.6
431
434.3
437.6
440.4
443.5
446.2
446.2
449.7
454.2
458.4
461.1
464
466.2
468.7
471.8
474.9
477.5
480
482.8
485.7
488.5
492
495.1
498.5
502.2
502.1
510
515
520.4
525.2
530.1
534.5
538.5
544.4
548.4
551.9
554.9
558.1
561.3
564.4
567
568.7
570.9
572.5
574.6
577.1
580.9
583.3
586.5


Summary of computational transaction
Raw Inputview raw input (R code)
Raw Outputview raw output of R engine
Computing time2 seconds
R Server'Gwilym Jenkins' @ jenkins.wessa.net

\begin{tabular}{lllllllll}
\hline
Summary of computational transaction \tabularnewline
Raw Input & view raw input (R code)  \tabularnewline
Raw Output & view raw output of R engine  \tabularnewline
Computing time & 2 seconds \tabularnewline
R Server & 'Gwilym Jenkins' @ jenkins.wessa.net \tabularnewline
\hline
\end{tabular}
%Source: https://freestatistics.org/blog/index.php?pk=282818&T=0

[TABLE]
[ROW][C]Summary of computational transaction[/C][/ROW]
[ROW][C]Raw Input[/C][C]view raw input (R code) [/C][/ROW]
[ROW][C]Raw Output[/C][C]view raw output of R engine [/C][/ROW]
[ROW][C]Computing time[/C][C]2 seconds[/C][/ROW]
[ROW][C]R Server[/C][C]'Gwilym Jenkins' @ jenkins.wessa.net[/C][/ROW]
[/TABLE]
Source: https://freestatistics.org/blog/index.php?pk=282818&T=0

Globally Unique Identifier (entire table): ba.freestatistics.org/blog/index.php?pk=282818&T=0

As an alternative you can also use a QR Code:  

The GUIDs for individual cells are displayed in the table below:

Summary of computational transaction
Raw Inputview raw input (R code)
Raw Outputview raw output of R engine
Computing time2 seconds
R Server'Gwilym Jenkins' @ jenkins.wessa.net


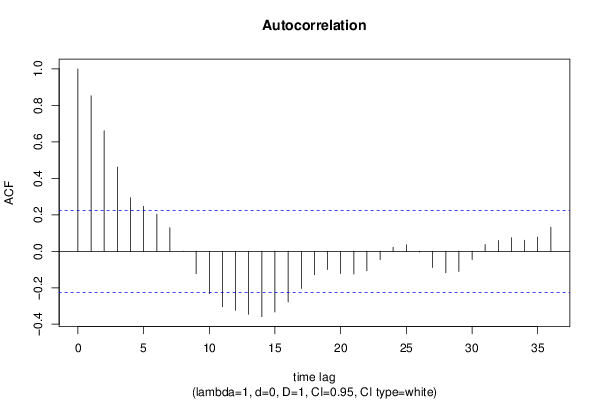
Autocorrelation Function
Time lag kACF(k)T-STATP-value
10.8524927.43180
20.6613415.76540
30.4616734.02486.7e-05
40.2932962.55690.006277
50.2475072.15770.017055
60.2030731.77030.04034
70.1293111.12730.13158
8-0.000169-0.00150.499413
9-0.122424-1.06730.144615
10-0.232938-2.03070.022891
11-0.304321-2.6530.004854
12-0.32405-2.8250.003018
13-0.345469-3.01170.001763
14-0.358414-3.12460.00126
15-0.332762-2.9010.002432
16-0.277964-2.42320.008881
17-0.203852-1.77710.039773
18-0.128218-1.11780.13359
19-0.100258-0.8740.192427
20-0.121521-1.05940.146388
21-0.124386-1.08440.140815
22-0.1065-0.92840.178059
23-0.045527-0.39690.34628
240.0221790.19340.4236
250.0351750.30660.379975
26-0.003635-0.03170.4874
27-0.089047-0.77630.219994
28-0.117873-1.02760.1537
29-0.11057-0.96390.16907
30-0.044925-0.39160.348208
310.0372490.32470.37314
320.0593980.51780.303044
330.0739420.64460.26056
340.0607590.52970.298938
350.0777690.6780.249922
360.1322481.15290.12628

\begin{tabular}{lllllllll}
\hline
Autocorrelation Function \tabularnewline
Time lag k & ACF(k) & T-STAT & P-value \tabularnewline
1 & 0.852492 & 7.4318 & 0 \tabularnewline
2 & 0.661341 & 5.7654 & 0 \tabularnewline
3 & 0.461673 & 4.0248 & 6.7e-05 \tabularnewline
4 & 0.293296 & 2.5569 & 0.006277 \tabularnewline
5 & 0.247507 & 2.1577 & 0.017055 \tabularnewline
6 & 0.203073 & 1.7703 & 0.04034 \tabularnewline
7 & 0.129311 & 1.1273 & 0.13158 \tabularnewline
8 & -0.000169 & -0.0015 & 0.499413 \tabularnewline
9 & -0.122424 & -1.0673 & 0.144615 \tabularnewline
10 & -0.232938 & -2.0307 & 0.022891 \tabularnewline
11 & -0.304321 & -2.653 & 0.004854 \tabularnewline
12 & -0.32405 & -2.825 & 0.003018 \tabularnewline
13 & -0.345469 & -3.0117 & 0.001763 \tabularnewline
14 & -0.358414 & -3.1246 & 0.00126 \tabularnewline
15 & -0.332762 & -2.901 & 0.002432 \tabularnewline
16 & -0.277964 & -2.4232 & 0.008881 \tabularnewline
17 & -0.203852 & -1.7771 & 0.039773 \tabularnewline
18 & -0.128218 & -1.1178 & 0.13359 \tabularnewline
19 & -0.100258 & -0.874 & 0.192427 \tabularnewline
20 & -0.121521 & -1.0594 & 0.146388 \tabularnewline
21 & -0.124386 & -1.0844 & 0.140815 \tabularnewline
22 & -0.1065 & -0.9284 & 0.178059 \tabularnewline
23 & -0.045527 & -0.3969 & 0.34628 \tabularnewline
24 & 0.022179 & 0.1934 & 0.4236 \tabularnewline
25 & 0.035175 & 0.3066 & 0.379975 \tabularnewline
26 & -0.003635 & -0.0317 & 0.4874 \tabularnewline
27 & -0.089047 & -0.7763 & 0.219994 \tabularnewline
28 & -0.117873 & -1.0276 & 0.1537 \tabularnewline
29 & -0.11057 & -0.9639 & 0.16907 \tabularnewline
30 & -0.044925 & -0.3916 & 0.348208 \tabularnewline
31 & 0.037249 & 0.3247 & 0.37314 \tabularnewline
32 & 0.059398 & 0.5178 & 0.303044 \tabularnewline
33 & 0.073942 & 0.6446 & 0.26056 \tabularnewline
34 & 0.060759 & 0.5297 & 0.298938 \tabularnewline
35 & 0.077769 & 0.678 & 0.249922 \tabularnewline
36 & 0.132248 & 1.1529 & 0.12628 \tabularnewline
\hline
\end{tabular}
%Source: https://freestatistics.org/blog/index.php?pk=282818&T=1

[TABLE]
[ROW][C]Autocorrelation Function[/C][/ROW]
[ROW][C]Time lag k[/C][C]ACF(k)[/C][C]T-STAT[/C][C]P-value[/C][/ROW]
[ROW][C]1[/C][C]0.852492[/C][C]7.4318[/C][C]0[/C][/ROW]
[ROW][C]2[/C][C]0.661341[/C][C]5.7654[/C][C]0[/C][/ROW]
[ROW][C]3[/C][C]0.461673[/C][C]4.0248[/C][C]6.7e-05[/C][/ROW]
[ROW][C]4[/C][C]0.293296[/C][C]2.5569[/C][C]0.006277[/C][/ROW]
[ROW][C]5[/C][C]0.247507[/C][C]2.1577[/C][C]0.017055[/C][/ROW]
[ROW][C]6[/C][C]0.203073[/C][C]1.7703[/C][C]0.04034[/C][/ROW]
[ROW][C]7[/C][C]0.129311[/C][C]1.1273[/C][C]0.13158[/C][/ROW]
[ROW][C]8[/C][C]-0.000169[/C][C]-0.0015[/C][C]0.499413[/C][/ROW]
[ROW][C]9[/C][C]-0.122424[/C][C]-1.0673[/C][C]0.144615[/C][/ROW]
[ROW][C]10[/C][C]-0.232938[/C][C]-2.0307[/C][C]0.022891[/C][/ROW]
[ROW][C]11[/C][C]-0.304321[/C][C]-2.653[/C][C]0.004854[/C][/ROW]
[ROW][C]12[/C][C]-0.32405[/C][C]-2.825[/C][C]0.003018[/C][/ROW]
[ROW][C]13[/C][C]-0.345469[/C][C]-3.0117[/C][C]0.001763[/C][/ROW]
[ROW][C]14[/C][C]-0.358414[/C][C]-3.1246[/C][C]0.00126[/C][/ROW]
[ROW][C]15[/C][C]-0.332762[/C][C]-2.901[/C][C]0.002432[/C][/ROW]
[ROW][C]16[/C][C]-0.277964[/C][C]-2.4232[/C][C]0.008881[/C][/ROW]
[ROW][C]17[/C][C]-0.203852[/C][C]-1.7771[/C][C]0.039773[/C][/ROW]
[ROW][C]18[/C][C]-0.128218[/C][C]-1.1178[/C][C]0.13359[/C][/ROW]
[ROW][C]19[/C][C]-0.100258[/C][C]-0.874[/C][C]0.192427[/C][/ROW]
[ROW][C]20[/C][C]-0.121521[/C][C]-1.0594[/C][C]0.146388[/C][/ROW]
[ROW][C]21[/C][C]-0.124386[/C][C]-1.0844[/C][C]0.140815[/C][/ROW]
[ROW][C]22[/C][C]-0.1065[/C][C]-0.9284[/C][C]0.178059[/C][/ROW]
[ROW][C]23[/C][C]-0.045527[/C][C]-0.3969[/C][C]0.34628[/C][/ROW]
[ROW][C]24[/C][C]0.022179[/C][C]0.1934[/C][C]0.4236[/C][/ROW]
[ROW][C]25[/C][C]0.035175[/C][C]0.3066[/C][C]0.379975[/C][/ROW]
[ROW][C]26[/C][C]-0.003635[/C][C]-0.0317[/C][C]0.4874[/C][/ROW]
[ROW][C]27[/C][C]-0.089047[/C][C]-0.7763[/C][C]0.219994[/C][/ROW]
[ROW][C]28[/C][C]-0.117873[/C][C]-1.0276[/C][C]0.1537[/C][/ROW]
[ROW][C]29[/C][C]-0.11057[/C][C]-0.9639[/C][C]0.16907[/C][/ROW]
[ROW][C]30[/C][C]-0.044925[/C][C]-0.3916[/C][C]0.348208[/C][/ROW]
[ROW][C]31[/C][C]0.037249[/C][C]0.3247[/C][C]0.37314[/C][/ROW]
[ROW][C]32[/C][C]0.059398[/C][C]0.5178[/C][C]0.303044[/C][/ROW]
[ROW][C]33[/C][C]0.073942[/C][C]0.6446[/C][C]0.26056[/C][/ROW]
[ROW][C]34[/C][C]0.060759[/C][C]0.5297[/C][C]0.298938[/C][/ROW]
[ROW][C]35[/C][C]0.077769[/C][C]0.678[/C][C]0.249922[/C][/ROW]
[ROW][C]36[/C][C]0.132248[/C][C]1.1529[/C][C]0.12628[/C][/ROW]
[/TABLE]
Source: https://freestatistics.org/blog/index.php?pk=282818&T=1

Globally Unique Identifier (entire table): ba.freestatistics.org/blog/index.php?pk=282818&T=1

As an alternative you can also use a QR Code:  

The GUIDs for individual cells are displayed in the table below:

Autocorrelation Function
Time lag kACF(k)T-STATP-value
10.8524927.43180
20.6613415.76540
30.4616734.02486.7e-05
40.2932962.55690.006277
50.2475072.15770.017055
60.2030731.77030.04034
70.1293111.12730.13158
8-0.000169-0.00150.499413
9-0.122424-1.06730.144615
10-0.232938-2.03070.022891
11-0.304321-2.6530.004854
12-0.32405-2.8250.003018
13-0.345469-3.01170.001763
14-0.358414-3.12460.00126
15-0.332762-2.9010.002432
16-0.277964-2.42320.008881
17-0.203852-1.77710.039773
18-0.128218-1.11780.13359
19-0.100258-0.8740.192427
20-0.121521-1.05940.146388
21-0.124386-1.08440.140815
22-0.1065-0.92840.178059
23-0.045527-0.39690.34628
240.0221790.19340.4236
250.0351750.30660.379975
26-0.003635-0.03170.4874
27-0.089047-0.77630.219994
28-0.117873-1.02760.1537
29-0.11057-0.96390.16907
30-0.044925-0.39160.348208
310.0372490.32470.37314
320.0593980.51780.303044
330.0739420.64460.26056
340.0607590.52970.298938
350.0777690.6780.249922
360.1322481.15290.12628


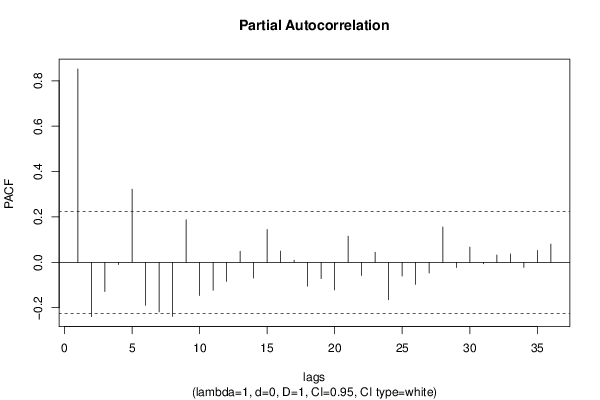
Partial Autocorrelation Function
Time lag kPACF(k)T-STATP-value
10.8524927.43180
2-0.239338-2.08650.020144
3-0.128168-1.11730.133684
4-0.009152-0.07980.46831
50.3226642.81290.003123
6-0.189003-1.64770.051773
7-0.218454-1.90440.030319
8-0.238004-2.07490.020692
90.1879961.63890.052683
10-0.145989-1.27270.103502
11-0.122807-1.07060.143868
12-0.083813-0.73070.233614
130.0486150.42380.336448
14-0.069043-0.60190.274515
150.1447961.26230.10535
160.0496310.43270.333239
170.0097110.08470.466378
18-0.104761-0.91330.181991
19-0.071602-0.62420.267179
20-0.12128-1.05730.146862
210.1154781.00670.158634
22-0.058194-0.50730.306698
230.0448310.39080.34851
24-0.164855-1.43720.077386
25-0.060089-0.52380.300955
26-0.097099-0.84650.199969
27-0.046969-0.40950.341676
280.1557431.35770.089282
29-0.023087-0.20130.420513
300.0671940.58580.279878
31-0.006248-0.05450.478352
320.0321050.27990.390164
330.0367750.32060.374697
34-0.022193-0.19350.423552
350.0523610.45650.324676
360.080270.69980.243102

\begin{tabular}{lllllllll}
\hline
Partial Autocorrelation Function \tabularnewline
Time lag k & PACF(k) & T-STAT & P-value \tabularnewline
1 & 0.852492 & 7.4318 & 0 \tabularnewline
2 & -0.239338 & -2.0865 & 0.020144 \tabularnewline
3 & -0.128168 & -1.1173 & 0.133684 \tabularnewline
4 & -0.009152 & -0.0798 & 0.46831 \tabularnewline
5 & 0.322664 & 2.8129 & 0.003123 \tabularnewline
6 & -0.189003 & -1.6477 & 0.051773 \tabularnewline
7 & -0.218454 & -1.9044 & 0.030319 \tabularnewline
8 & -0.238004 & -2.0749 & 0.020692 \tabularnewline
9 & 0.187996 & 1.6389 & 0.052683 \tabularnewline
10 & -0.145989 & -1.2727 & 0.103502 \tabularnewline
11 & -0.122807 & -1.0706 & 0.143868 \tabularnewline
12 & -0.083813 & -0.7307 & 0.233614 \tabularnewline
13 & 0.048615 & 0.4238 & 0.336448 \tabularnewline
14 & -0.069043 & -0.6019 & 0.274515 \tabularnewline
15 & 0.144796 & 1.2623 & 0.10535 \tabularnewline
16 & 0.049631 & 0.4327 & 0.333239 \tabularnewline
17 & 0.009711 & 0.0847 & 0.466378 \tabularnewline
18 & -0.104761 & -0.9133 & 0.181991 \tabularnewline
19 & -0.071602 & -0.6242 & 0.267179 \tabularnewline
20 & -0.12128 & -1.0573 & 0.146862 \tabularnewline
21 & 0.115478 & 1.0067 & 0.158634 \tabularnewline
22 & -0.058194 & -0.5073 & 0.306698 \tabularnewline
23 & 0.044831 & 0.3908 & 0.34851 \tabularnewline
24 & -0.164855 & -1.4372 & 0.077386 \tabularnewline
25 & -0.060089 & -0.5238 & 0.300955 \tabularnewline
26 & -0.097099 & -0.8465 & 0.199969 \tabularnewline
27 & -0.046969 & -0.4095 & 0.341676 \tabularnewline
28 & 0.155743 & 1.3577 & 0.089282 \tabularnewline
29 & -0.023087 & -0.2013 & 0.420513 \tabularnewline
30 & 0.067194 & 0.5858 & 0.279878 \tabularnewline
31 & -0.006248 & -0.0545 & 0.478352 \tabularnewline
32 & 0.032105 & 0.2799 & 0.390164 \tabularnewline
33 & 0.036775 & 0.3206 & 0.374697 \tabularnewline
34 & -0.022193 & -0.1935 & 0.423552 \tabularnewline
35 & 0.052361 & 0.4565 & 0.324676 \tabularnewline
36 & 0.08027 & 0.6998 & 0.243102 \tabularnewline
\hline
\end{tabular}
%Source: https://freestatistics.org/blog/index.php?pk=282818&T=2

[TABLE]
[ROW][C]Partial Autocorrelation Function[/C][/ROW]
[ROW][C]Time lag k[/C][C]PACF(k)[/C][C]T-STAT[/C][C]P-value[/C][/ROW]
[ROW][C]1[/C][C]0.852492[/C][C]7.4318[/C][C]0[/C][/ROW]
[ROW][C]2[/C][C]-0.239338[/C][C]-2.0865[/C][C]0.020144[/C][/ROW]
[ROW][C]3[/C][C]-0.128168[/C][C]-1.1173[/C][C]0.133684[/C][/ROW]
[ROW][C]4[/C][C]-0.009152[/C][C]-0.0798[/C][C]0.46831[/C][/ROW]
[ROW][C]5[/C][C]0.322664[/C][C]2.8129[/C][C]0.003123[/C][/ROW]
[ROW][C]6[/C][C]-0.189003[/C][C]-1.6477[/C][C]0.051773[/C][/ROW]
[ROW][C]7[/C][C]-0.218454[/C][C]-1.9044[/C][C]0.030319[/C][/ROW]
[ROW][C]8[/C][C]-0.238004[/C][C]-2.0749[/C][C]0.020692[/C][/ROW]
[ROW][C]9[/C][C]0.187996[/C][C]1.6389[/C][C]0.052683[/C][/ROW]
[ROW][C]10[/C][C]-0.145989[/C][C]-1.2727[/C][C]0.103502[/C][/ROW]
[ROW][C]11[/C][C]-0.122807[/C][C]-1.0706[/C][C]0.143868[/C][/ROW]
[ROW][C]12[/C][C]-0.083813[/C][C]-0.7307[/C][C]0.233614[/C][/ROW]
[ROW][C]13[/C][C]0.048615[/C][C]0.4238[/C][C]0.336448[/C][/ROW]
[ROW][C]14[/C][C]-0.069043[/C][C]-0.6019[/C][C]0.274515[/C][/ROW]
[ROW][C]15[/C][C]0.144796[/C][C]1.2623[/C][C]0.10535[/C][/ROW]
[ROW][C]16[/C][C]0.049631[/C][C]0.4327[/C][C]0.333239[/C][/ROW]
[ROW][C]17[/C][C]0.009711[/C][C]0.0847[/C][C]0.466378[/C][/ROW]
[ROW][C]18[/C][C]-0.104761[/C][C]-0.9133[/C][C]0.181991[/C][/ROW]
[ROW][C]19[/C][C]-0.071602[/C][C]-0.6242[/C][C]0.267179[/C][/ROW]
[ROW][C]20[/C][C]-0.12128[/C][C]-1.0573[/C][C]0.146862[/C][/ROW]
[ROW][C]21[/C][C]0.115478[/C][C]1.0067[/C][C]0.158634[/C][/ROW]
[ROW][C]22[/C][C]-0.058194[/C][C]-0.5073[/C][C]0.306698[/C][/ROW]
[ROW][C]23[/C][C]0.044831[/C][C]0.3908[/C][C]0.34851[/C][/ROW]
[ROW][C]24[/C][C]-0.164855[/C][C]-1.4372[/C][C]0.077386[/C][/ROW]
[ROW][C]25[/C][C]-0.060089[/C][C]-0.5238[/C][C]0.300955[/C][/ROW]
[ROW][C]26[/C][C]-0.097099[/C][C]-0.8465[/C][C]0.199969[/C][/ROW]
[ROW][C]27[/C][C]-0.046969[/C][C]-0.4095[/C][C]0.341676[/C][/ROW]
[ROW][C]28[/C][C]0.155743[/C][C]1.3577[/C][C]0.089282[/C][/ROW]
[ROW][C]29[/C][C]-0.023087[/C][C]-0.2013[/C][C]0.420513[/C][/ROW]
[ROW][C]30[/C][C]0.067194[/C][C]0.5858[/C][C]0.279878[/C][/ROW]
[ROW][C]31[/C][C]-0.006248[/C][C]-0.0545[/C][C]0.478352[/C][/ROW]
[ROW][C]32[/C][C]0.032105[/C][C]0.2799[/C][C]0.390164[/C][/ROW]
[ROW][C]33[/C][C]0.036775[/C][C]0.3206[/C][C]0.374697[/C][/ROW]
[ROW][C]34[/C][C]-0.022193[/C][C]-0.1935[/C][C]0.423552[/C][/ROW]
[ROW][C]35[/C][C]0.052361[/C][C]0.4565[/C][C]0.324676[/C][/ROW]
[ROW][C]36[/C][C]0.08027[/C][C]0.6998[/C][C]0.243102[/C][/ROW]
[/TABLE]
Source: https://freestatistics.org/blog/index.php?pk=282818&T=2

Globally Unique Identifier (entire table): ba.freestatistics.org/blog/index.php?pk=282818&T=2

As an alternative you can also use a QR Code:  

The GUIDs for individual cells are displayed in the table below:

Partial Autocorrelation Function
Time lag kPACF(k)T-STATP-value
10.8524927.43180
2-0.239338-2.08650.020144
3-0.128168-1.11730.133684
4-0.009152-0.07980.46831
50.3226642.81290.003123
6-0.189003-1.64770.051773
7-0.218454-1.90440.030319
8-0.238004-2.07490.020692
90.1879961.63890.052683
10-0.145989-1.27270.103502
11-0.122807-1.07060.143868
12-0.083813-0.73070.233614
130.0486150.42380.336448
14-0.069043-0.60190.274515
150.1447961.26230.10535
160.0496310.43270.333239
170.0097110.08470.466378
18-0.104761-0.91330.181991
19-0.071602-0.62420.267179
20-0.12128-1.05730.146862
210.1154781.00670.158634
22-0.058194-0.50730.306698
230.0448310.39080.34851
24-0.164855-1.43720.077386
25-0.060089-0.52380.300955
26-0.097099-0.84650.199969
27-0.046969-0.40950.341676
280.1557431.35770.089282
29-0.023087-0.20130.420513
300.0671940.58580.279878
31-0.006248-0.05450.478352
320.0321050.27990.390164
330.0367750.32060.374697
34-0.022193-0.19350.423552
350.0523610.45650.324676
360.080270.69980.243102


Parameters (Session):
par1 = 36 ; par2 = 1 ; par3 = 0 ; par4 = 1 ; par5 = 4 ; par6 = White Noise ; par7 = 0.95 ;
Parameters (R input):
par1 = 36 ; par2 = 1 ; par3 = 0 ; par4 = 1 ; par5 = 4 ; par6 = White Noise ; par7 = 0.95 ; par8 = ;
R code (references can be found in the software module):
par8 <- ''
par7 <- '0.95'
par6 <- 'White Noise'
par5 <- '4'
par4 <- '1'
par3 <- '0'
par2 <- '1'
par1 <- '24'
if (par1 == 'Default') {
par1 = 10*log10(length(x))
} else {
par1 <- as.numeric(par1)
}
par2 <- as.numeric(par2)
par3 <- as.numeric(par3)
par4 <- as.numeric(par4)
par5 <- as.numeric(par5)
if (par6 == 'White Noise') par6 <- 'white' else par6 <- 'ma'
par7 <- as.numeric(par7)
if (par8 != '') par8 <- as.numeric(par8)
ox <- x
if (par8 == '') {
if (par2 == 0) {
x <- log(x)
} else {
x <- (x ^ par2 - 1) / par2
}
} else {
x <- log(x,base=par8)
}
if (par3 > 0) x <- diff(x,lag=1,difference=par3)
if (par4 > 0) x <- diff(x,lag=par5,difference=par4)
bitmap(file='picts.png')
op <- par(mfrow=c(2,1))
plot(ox,type='l',main='Original Time Series',xlab='time',ylab='value')
if (par8=='') {
mytitle <- paste('Working Time Series (lambda=',par2,', d=',par3,', D=',par4,')',sep='')
mysub <- paste('(lambda=',par2,', d=',par3,', D=',par4,', CI=', par7, ', CI type=',par6,')',sep='')
} else {
mytitle <- paste('Working Time Series (base=',par8,', d=',par3,', D=',par4,')',sep='')
mysub <- paste('(base=',par8,', d=',par3,', D=',par4,', CI=', par7, ', CI type=',par6,')',sep='')
}
plot(x,type='l', main=mytitle,xlab='time',ylab='value')
par(op)
dev.off()
bitmap(file='pic1.png')
racf <- acf(x, par1, main='Autocorrelation', xlab='time lag', ylab='ACF', ci.type=par6, ci=par7, sub=mysub)
dev.off()
bitmap(file='pic2.png')
rpacf <- pacf(x,par1,main='Partial Autocorrelation',xlab='lags',ylab='PACF',sub=mysub)
dev.off()
(myacf <- c(racf$acf))
(mypacf <- c(rpacf$acf))
lengthx <- length(x)
sqrtn <- sqrt(lengthx)
load(file='createtable')
a<-table.start()
a<-table.row.start(a)
a<-table.element(a,'Autocorrelation Function',4,TRUE)
a<-table.row.end(a)
a<-table.row.start(a)
a<-table.element(a,'Time lag k',header=TRUE)
a<-table.element(a,hyperlink('basics.htm','ACF(k)','click here for more information about the Autocorrelation Function'),header=TRUE)
a<-table.element(a,'T-STAT',header=TRUE)
a<-table.element(a,'P-value',header=TRUE)
a<-table.row.end(a)
for (i in 2:(par1+1)) {
a<-table.row.start(a)
a<-table.element(a,i-1,header=TRUE)
a<-table.element(a,round(myacf[i],6))
mytstat <- myacf[i]*sqrtn
a<-table.element(a,round(mytstat,4))
a<-table.element(a,round(1-pt(abs(mytstat),lengthx),6))
a<-table.row.end(a)
}
a<-table.end(a)
table.save(a,file='mytable.tab')
a<-table.start()
a<-table.row.start(a)
a<-table.element(a,'Partial Autocorrelation Function',4,TRUE)
a<-table.row.end(a)
a<-table.row.start(a)
a<-table.element(a,'Time lag k',header=TRUE)
a<-table.element(a,hyperlink('basics.htm','PACF(k)','click here for more information about the Partial Autocorrelation Function'),header=TRUE)
a<-table.element(a,'T-STAT',header=TRUE)
a<-table.element(a,'P-value',header=TRUE)
a<-table.row.end(a)
for (i in 1:par1) {
a<-table.row.start(a)
a<-table.element(a,i,header=TRUE)
a<-table.element(a,round(mypacf[i],6))
mytstat <- mypacf[i]*sqrtn
a<-table.element(a,round(mytstat,4))
a<-table.element(a,round(1-pt(abs(mytstat),lengthx),6))
a<-table.row.end(a)
}
a<-table.end(a)
table.save(a,file='mytable1.tab')