Free Statistics

of Irreproducible Research!

Author's title

Author*Unverified author*
R Software Modulerwasp_autocorrelation.wasp
Title produced by software(Partial) Autocorrelation Function
Date of computationFri, 23 Oct 2015 09:35:32 +0100
Cite this page as followsStatistical Computations at FreeStatistics.org, Office for Research Development and Education, URL https://freestatistics.org/blog/index.php?v=date/2015/Oct/23/t144558944030pw9xep0d9gi7v.htm/, Retrieved Tue, 14 May 2024 10:05:03 +0000
Statistical Computations at FreeStatistics.org, Office for Research Development and Education, URL https://freestatistics.org/blog/index.php?pk=282834, Retrieved Tue, 14 May 2024 10:05:03 +0000
QR Codes:

Original text written by user:
IsPrivate?No (this computation is public)
User-defined keywords
Estimated Impact119
Family? (F = Feedback message, R = changed R code, M = changed R Module, P = changed Parameters, D = changed Data)
-       [(Partial) Autocorrelation Function] [Cijfergegevens-Ei...] [2015-10-23 08:35:32] [df110f336183c9d15b985c5fac87d8f5] [Current]
Feedback Forum

Post a new message
Dataseries X:
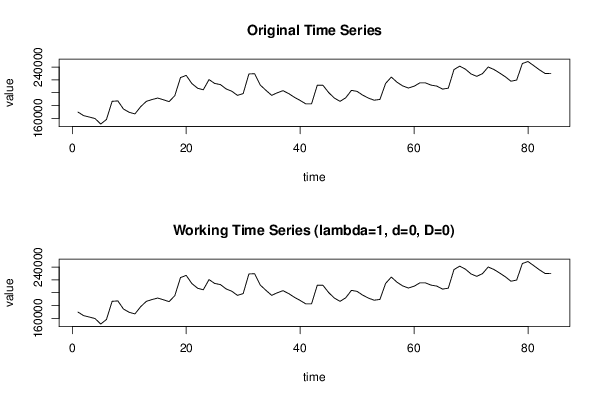
169701
164182
161914
159612
151001
158114
186530
187069
174330
169362
166827
178037
186412
189226
191563
188906
186005
195309
223532
226899
214126
206903
204442
220376
214320
212588
205816
202196
195722
198563
229139
229527
211868
203555
195770
199834
203089
198480
192684
187827
182414
182510
211524
211451
200140
191568
186424
191987
203583
201920
195978
191395
188222
189422
214419
224325
216222
210506
207221
210027
215191
215177
211701
210176
205491
206996
235980
241292
236675
229127
225436
229570
239973
236168
230703
224790
217811
219576
245472
248511
242084
235572
229827
229697


Summary of computational transaction
Raw Inputview raw input (R code)
Raw Outputview raw output of R engine
Computing time1 seconds
R Server'Gwilym Jenkins' @ jenkins.wessa.net
R Framework error message
Warning: there are blank lines in the 'Data' field.
Please, use NA for missing data - blank lines are simply
 deleted and are NOT treated as missing values.

\begin{tabular}{lllllllll}
\hline
Summary of computational transaction \tabularnewline
Raw Input & view raw input (R code)  \tabularnewline
Raw Output & view raw output of R engine  \tabularnewline
Computing time & 1 seconds \tabularnewline
R Server & 'Gwilym Jenkins' @ jenkins.wessa.net \tabularnewline
R Framework error message & 
Warning: there are blank lines in the 'Data' field.
Please, use NA for missing data - blank lines are simply
 deleted and are NOT treated as missing values.
\tabularnewline \hline \end{tabular} %Source: https://freestatistics.org/blog/index.php?pk=282834&T=0

[TABLE]
[ROW][C]Summary of computational transaction[/C][/ROW]
[ROW][C]Raw Input[/C][C]view raw input (R code) [/C][/ROW]
[ROW][C]Raw Output[/C][C]view raw output of R engine [/C][/ROW]
[ROW][C]Computing time[/C][C]1 seconds[/C][/ROW]
[ROW][C]R Server[/C][C]'Gwilym Jenkins' @ jenkins.wessa.net[/C][/ROW]
[ROW][C]R Framework error message[/C][C]
Warning: there are blank lines in the 'Data' field.
Please, use NA for missing data - blank lines are simply
 deleted and are NOT treated as missing values.
[/C][/ROW] [/TABLE] Source: https://freestatistics.org/blog/index.php?pk=282834&T=0

Globally Unique Identifier (entire table): ba.freestatistics.org/blog/index.php?pk=282834&T=0

As an alternative you can also use a QR Code:  

The GUIDs for individual cells are displayed in the table below:

Summary of computational transaction
Raw Inputview raw input (R code)
Raw Outputview raw output of R engine
Computing time1 seconds
R Server'Gwilym Jenkins' @ jenkins.wessa.net
R Framework error message
Warning: there are blank lines in the 'Data' field.
Please, use NA for missing data - blank lines are simply
 deleted and are NOT treated as missing values.


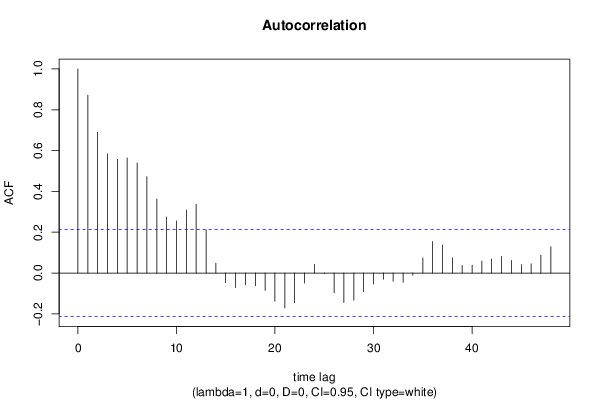
Autocorrelation Function
Time lag kACF(k)T-STATP-value
10.8715767.98810
20.689516.31950
30.5838925.35150
40.5575595.11011e-06
50.5634685.16431e-06
60.5389294.93942e-06
70.4721434.32732.1e-05
80.3629953.32690.000652
90.2741652.51280.006945
100.2546712.33410.010989
110.3088632.83080.002904
120.3365563.08460.00138
130.2122121.9450.027563
140.047490.43530.332247
15-0.047093-0.43160.333563
16-0.070924-0.650.258723
17-0.057883-0.53050.298579
18-0.062674-0.57440.283611
19-0.085209-0.7810.218511
20-0.138141-1.26610.104492
21-0.171231-1.56940.060162
22-0.145085-1.32970.093603
23-0.049372-0.45250.326036
240.0426870.39120.34831
25-0.002888-0.02650.489472
26-0.096705-0.88630.188988
27-0.144425-1.32370.094601
28-0.133686-1.22530.111952
29-0.091617-0.83970.201735
30-0.053489-0.49020.312621
31-0.030747-0.28180.389395
32-0.040653-0.37260.355194
33-0.045499-0.4170.338869
34-0.011194-0.10260.459263
350.0737870.67630.250364
360.1544221.41530.080339
370.1372591.2580.105939
380.0742160.68020.249124
390.0370920.340.367368
400.0377260.34580.365193
410.0583660.53490.297054
420.0690680.6330.264221
430.0810720.7430.229767
440.0610670.55970.288592
450.0413390.37890.352867
460.0449140.41160.340826
470.0871250.79850.213413
480.1290261.18250.120164

\begin{tabular}{lllllllll}
\hline
Autocorrelation Function \tabularnewline
Time lag k & ACF(k) & T-STAT & P-value \tabularnewline
1 & 0.871576 & 7.9881 & 0 \tabularnewline
2 & 0.68951 & 6.3195 & 0 \tabularnewline
3 & 0.583892 & 5.3515 & 0 \tabularnewline
4 & 0.557559 & 5.1101 & 1e-06 \tabularnewline
5 & 0.563468 & 5.1643 & 1e-06 \tabularnewline
6 & 0.538929 & 4.9394 & 2e-06 \tabularnewline
7 & 0.472143 & 4.3273 & 2.1e-05 \tabularnewline
8 & 0.362995 & 3.3269 & 0.000652 \tabularnewline
9 & 0.274165 & 2.5128 & 0.006945 \tabularnewline
10 & 0.254671 & 2.3341 & 0.010989 \tabularnewline
11 & 0.308863 & 2.8308 & 0.002904 \tabularnewline
12 & 0.336556 & 3.0846 & 0.00138 \tabularnewline
13 & 0.212212 & 1.945 & 0.027563 \tabularnewline
14 & 0.04749 & 0.4353 & 0.332247 \tabularnewline
15 & -0.047093 & -0.4316 & 0.333563 \tabularnewline
16 & -0.070924 & -0.65 & 0.258723 \tabularnewline
17 & -0.057883 & -0.5305 & 0.298579 \tabularnewline
18 & -0.062674 & -0.5744 & 0.283611 \tabularnewline
19 & -0.085209 & -0.781 & 0.218511 \tabularnewline
20 & -0.138141 & -1.2661 & 0.104492 \tabularnewline
21 & -0.171231 & -1.5694 & 0.060162 \tabularnewline
22 & -0.145085 & -1.3297 & 0.093603 \tabularnewline
23 & -0.049372 & -0.4525 & 0.326036 \tabularnewline
24 & 0.042687 & 0.3912 & 0.34831 \tabularnewline
25 & -0.002888 & -0.0265 & 0.489472 \tabularnewline
26 & -0.096705 & -0.8863 & 0.188988 \tabularnewline
27 & -0.144425 & -1.3237 & 0.094601 \tabularnewline
28 & -0.133686 & -1.2253 & 0.111952 \tabularnewline
29 & -0.091617 & -0.8397 & 0.201735 \tabularnewline
30 & -0.053489 & -0.4902 & 0.312621 \tabularnewline
31 & -0.030747 & -0.2818 & 0.389395 \tabularnewline
32 & -0.040653 & -0.3726 & 0.355194 \tabularnewline
33 & -0.045499 & -0.417 & 0.338869 \tabularnewline
34 & -0.011194 & -0.1026 & 0.459263 \tabularnewline
35 & 0.073787 & 0.6763 & 0.250364 \tabularnewline
36 & 0.154422 & 1.4153 & 0.080339 \tabularnewline
37 & 0.137259 & 1.258 & 0.105939 \tabularnewline
38 & 0.074216 & 0.6802 & 0.249124 \tabularnewline
39 & 0.037092 & 0.34 & 0.367368 \tabularnewline
40 & 0.037726 & 0.3458 & 0.365193 \tabularnewline
41 & 0.058366 & 0.5349 & 0.297054 \tabularnewline
42 & 0.069068 & 0.633 & 0.264221 \tabularnewline
43 & 0.081072 & 0.743 & 0.229767 \tabularnewline
44 & 0.061067 & 0.5597 & 0.288592 \tabularnewline
45 & 0.041339 & 0.3789 & 0.352867 \tabularnewline
46 & 0.044914 & 0.4116 & 0.340826 \tabularnewline
47 & 0.087125 & 0.7985 & 0.213413 \tabularnewline
48 & 0.129026 & 1.1825 & 0.120164 \tabularnewline
\hline
\end{tabular}
%Source: https://freestatistics.org/blog/index.php?pk=282834&T=1

[TABLE]
[ROW][C]Autocorrelation Function[/C][/ROW]
[ROW][C]Time lag k[/C][C]ACF(k)[/C][C]T-STAT[/C][C]P-value[/C][/ROW]
[ROW][C]1[/C][C]0.871576[/C][C]7.9881[/C][C]0[/C][/ROW]
[ROW][C]2[/C][C]0.68951[/C][C]6.3195[/C][C]0[/C][/ROW]
[ROW][C]3[/C][C]0.583892[/C][C]5.3515[/C][C]0[/C][/ROW]
[ROW][C]4[/C][C]0.557559[/C][C]5.1101[/C][C]1e-06[/C][/ROW]
[ROW][C]5[/C][C]0.563468[/C][C]5.1643[/C][C]1e-06[/C][/ROW]
[ROW][C]6[/C][C]0.538929[/C][C]4.9394[/C][C]2e-06[/C][/ROW]
[ROW][C]7[/C][C]0.472143[/C][C]4.3273[/C][C]2.1e-05[/C][/ROW]
[ROW][C]8[/C][C]0.362995[/C][C]3.3269[/C][C]0.000652[/C][/ROW]
[ROW][C]9[/C][C]0.274165[/C][C]2.5128[/C][C]0.006945[/C][/ROW]
[ROW][C]10[/C][C]0.254671[/C][C]2.3341[/C][C]0.010989[/C][/ROW]
[ROW][C]11[/C][C]0.308863[/C][C]2.8308[/C][C]0.002904[/C][/ROW]
[ROW][C]12[/C][C]0.336556[/C][C]3.0846[/C][C]0.00138[/C][/ROW]
[ROW][C]13[/C][C]0.212212[/C][C]1.945[/C][C]0.027563[/C][/ROW]
[ROW][C]14[/C][C]0.04749[/C][C]0.4353[/C][C]0.332247[/C][/ROW]
[ROW][C]15[/C][C]-0.047093[/C][C]-0.4316[/C][C]0.333563[/C][/ROW]
[ROW][C]16[/C][C]-0.070924[/C][C]-0.65[/C][C]0.258723[/C][/ROW]
[ROW][C]17[/C][C]-0.057883[/C][C]-0.5305[/C][C]0.298579[/C][/ROW]
[ROW][C]18[/C][C]-0.062674[/C][C]-0.5744[/C][C]0.283611[/C][/ROW]
[ROW][C]19[/C][C]-0.085209[/C][C]-0.781[/C][C]0.218511[/C][/ROW]
[ROW][C]20[/C][C]-0.138141[/C][C]-1.2661[/C][C]0.104492[/C][/ROW]
[ROW][C]21[/C][C]-0.171231[/C][C]-1.5694[/C][C]0.060162[/C][/ROW]
[ROW][C]22[/C][C]-0.145085[/C][C]-1.3297[/C][C]0.093603[/C][/ROW]
[ROW][C]23[/C][C]-0.049372[/C][C]-0.4525[/C][C]0.326036[/C][/ROW]
[ROW][C]24[/C][C]0.042687[/C][C]0.3912[/C][C]0.34831[/C][/ROW]
[ROW][C]25[/C][C]-0.002888[/C][C]-0.0265[/C][C]0.489472[/C][/ROW]
[ROW][C]26[/C][C]-0.096705[/C][C]-0.8863[/C][C]0.188988[/C][/ROW]
[ROW][C]27[/C][C]-0.144425[/C][C]-1.3237[/C][C]0.094601[/C][/ROW]
[ROW][C]28[/C][C]-0.133686[/C][C]-1.2253[/C][C]0.111952[/C][/ROW]
[ROW][C]29[/C][C]-0.091617[/C][C]-0.8397[/C][C]0.201735[/C][/ROW]
[ROW][C]30[/C][C]-0.053489[/C][C]-0.4902[/C][C]0.312621[/C][/ROW]
[ROW][C]31[/C][C]-0.030747[/C][C]-0.2818[/C][C]0.389395[/C][/ROW]
[ROW][C]32[/C][C]-0.040653[/C][C]-0.3726[/C][C]0.355194[/C][/ROW]
[ROW][C]33[/C][C]-0.045499[/C][C]-0.417[/C][C]0.338869[/C][/ROW]
[ROW][C]34[/C][C]-0.011194[/C][C]-0.1026[/C][C]0.459263[/C][/ROW]
[ROW][C]35[/C][C]0.073787[/C][C]0.6763[/C][C]0.250364[/C][/ROW]
[ROW][C]36[/C][C]0.154422[/C][C]1.4153[/C][C]0.080339[/C][/ROW]
[ROW][C]37[/C][C]0.137259[/C][C]1.258[/C][C]0.105939[/C][/ROW]
[ROW][C]38[/C][C]0.074216[/C][C]0.6802[/C][C]0.249124[/C][/ROW]
[ROW][C]39[/C][C]0.037092[/C][C]0.34[/C][C]0.367368[/C][/ROW]
[ROW][C]40[/C][C]0.037726[/C][C]0.3458[/C][C]0.365193[/C][/ROW]
[ROW][C]41[/C][C]0.058366[/C][C]0.5349[/C][C]0.297054[/C][/ROW]
[ROW][C]42[/C][C]0.069068[/C][C]0.633[/C][C]0.264221[/C][/ROW]
[ROW][C]43[/C][C]0.081072[/C][C]0.743[/C][C]0.229767[/C][/ROW]
[ROW][C]44[/C][C]0.061067[/C][C]0.5597[/C][C]0.288592[/C][/ROW]
[ROW][C]45[/C][C]0.041339[/C][C]0.3789[/C][C]0.352867[/C][/ROW]
[ROW][C]46[/C][C]0.044914[/C][C]0.4116[/C][C]0.340826[/C][/ROW]
[ROW][C]47[/C][C]0.087125[/C][C]0.7985[/C][C]0.213413[/C][/ROW]
[ROW][C]48[/C][C]0.129026[/C][C]1.1825[/C][C]0.120164[/C][/ROW]
[/TABLE]
Source: https://freestatistics.org/blog/index.php?pk=282834&T=1

Globally Unique Identifier (entire table): ba.freestatistics.org/blog/index.php?pk=282834&T=1

As an alternative you can also use a QR Code:  

The GUIDs for individual cells are displayed in the table below:

Autocorrelation Function
Time lag kACF(k)T-STATP-value
10.8715767.98810
20.689516.31950
30.5838925.35150
40.5575595.11011e-06
50.5634685.16431e-06
60.5389294.93942e-06
70.4721434.32732.1e-05
80.3629953.32690.000652
90.2741652.51280.006945
100.2546712.33410.010989
110.3088632.83080.002904
120.3365563.08460.00138
130.2122121.9450.027563
140.047490.43530.332247
15-0.047093-0.43160.333563
16-0.070924-0.650.258723
17-0.057883-0.53050.298579
18-0.062674-0.57440.283611
19-0.085209-0.7810.218511
20-0.138141-1.26610.104492
21-0.171231-1.56940.060162
22-0.145085-1.32970.093603
23-0.049372-0.45250.326036
240.0426870.39120.34831
25-0.002888-0.02650.489472
26-0.096705-0.88630.188988
27-0.144425-1.32370.094601
28-0.133686-1.22530.111952
29-0.091617-0.83970.201735
30-0.053489-0.49020.312621
31-0.030747-0.28180.389395
32-0.040653-0.37260.355194
33-0.045499-0.4170.338869
34-0.011194-0.10260.459263
350.0737870.67630.250364
360.1544221.41530.080339
370.1372591.2580.105939
380.0742160.68020.249124
390.0370920.340.367368
400.0377260.34580.365193
410.0583660.53490.297054
420.0690680.6330.264221
430.0810720.7430.229767
440.0610670.55970.288592
450.0413390.37890.352867
460.0449140.41160.340826
470.0871250.79850.213413
480.1290261.18250.120164


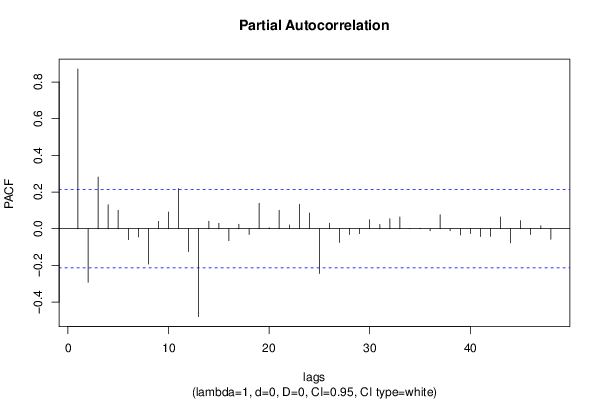
Partial Autocorrelation Function
Time lag kPACF(k)T-STATP-value
10.8715767.98810
2-0.291792-2.67430.004499
30.2814792.57980.005813
40.1312861.20330.116129
50.1011640.92720.178245
6-0.059304-0.54350.294102
7-0.045077-0.41310.34028
8-0.192657-1.76570.040538
90.0402930.36930.356419
100.0911930.83580.20282
110.2197782.01430.023589
12-0.124708-1.1430.128149
13-0.479561-4.39521.6e-05
140.0408270.37420.354603
150.0292910.26850.394504
16-0.064985-0.59560.276524
170.0246290.22570.41098
18-0.031347-0.28730.387295
190.1392831.27650.10264
200.005630.05160.479485
210.1012580.9280.178022
220.0204120.18710.426025
230.1334491.22310.112359
240.0854670.78330.217823
25-0.244567-2.24150.013815
260.0298270.27340.392619
27-0.074682-0.68450.247782
28-0.031488-0.28860.386803
29-0.026843-0.2460.403133
300.0490740.44980.327016
310.0232060.21270.416044
320.0548660.50290.308191
330.0643680.58990.278408
340.0016080.01470.494137
350.0030940.02840.488722
36-0.010748-0.09850.460883
370.0761370.69780.243613
38-0.011178-0.10240.459323
39-0.03416-0.31310.377496
40-0.025755-0.2360.406986
41-0.042248-0.38720.349789
42-0.041786-0.3830.351352
430.0636480.58330.280612
44-0.076992-0.70560.241182
450.0443580.40660.342685
46-0.031466-0.28840.386879
470.0166970.1530.439369
48-0.057867-0.53040.298632

\begin{tabular}{lllllllll}
\hline
Partial Autocorrelation Function \tabularnewline
Time lag k & PACF(k) & T-STAT & P-value \tabularnewline
1 & 0.871576 & 7.9881 & 0 \tabularnewline
2 & -0.291792 & -2.6743 & 0.004499 \tabularnewline
3 & 0.281479 & 2.5798 & 0.005813 \tabularnewline
4 & 0.131286 & 1.2033 & 0.116129 \tabularnewline
5 & 0.101164 & 0.9272 & 0.178245 \tabularnewline
6 & -0.059304 & -0.5435 & 0.294102 \tabularnewline
7 & -0.045077 & -0.4131 & 0.34028 \tabularnewline
8 & -0.192657 & -1.7657 & 0.040538 \tabularnewline
9 & 0.040293 & 0.3693 & 0.356419 \tabularnewline
10 & 0.091193 & 0.8358 & 0.20282 \tabularnewline
11 & 0.219778 & 2.0143 & 0.023589 \tabularnewline
12 & -0.124708 & -1.143 & 0.128149 \tabularnewline
13 & -0.479561 & -4.3952 & 1.6e-05 \tabularnewline
14 & 0.040827 & 0.3742 & 0.354603 \tabularnewline
15 & 0.029291 & 0.2685 & 0.394504 \tabularnewline
16 & -0.064985 & -0.5956 & 0.276524 \tabularnewline
17 & 0.024629 & 0.2257 & 0.41098 \tabularnewline
18 & -0.031347 & -0.2873 & 0.387295 \tabularnewline
19 & 0.139283 & 1.2765 & 0.10264 \tabularnewline
20 & 0.00563 & 0.0516 & 0.479485 \tabularnewline
21 & 0.101258 & 0.928 & 0.178022 \tabularnewline
22 & 0.020412 & 0.1871 & 0.426025 \tabularnewline
23 & 0.133449 & 1.2231 & 0.112359 \tabularnewline
24 & 0.085467 & 0.7833 & 0.217823 \tabularnewline
25 & -0.244567 & -2.2415 & 0.013815 \tabularnewline
26 & 0.029827 & 0.2734 & 0.392619 \tabularnewline
27 & -0.074682 & -0.6845 & 0.247782 \tabularnewline
28 & -0.031488 & -0.2886 & 0.386803 \tabularnewline
29 & -0.026843 & -0.246 & 0.403133 \tabularnewline
30 & 0.049074 & 0.4498 & 0.327016 \tabularnewline
31 & 0.023206 & 0.2127 & 0.416044 \tabularnewline
32 & 0.054866 & 0.5029 & 0.308191 \tabularnewline
33 & 0.064368 & 0.5899 & 0.278408 \tabularnewline
34 & 0.001608 & 0.0147 & 0.494137 \tabularnewline
35 & 0.003094 & 0.0284 & 0.488722 \tabularnewline
36 & -0.010748 & -0.0985 & 0.460883 \tabularnewline
37 & 0.076137 & 0.6978 & 0.243613 \tabularnewline
38 & -0.011178 & -0.1024 & 0.459323 \tabularnewline
39 & -0.03416 & -0.3131 & 0.377496 \tabularnewline
40 & -0.025755 & -0.236 & 0.406986 \tabularnewline
41 & -0.042248 & -0.3872 & 0.349789 \tabularnewline
42 & -0.041786 & -0.383 & 0.351352 \tabularnewline
43 & 0.063648 & 0.5833 & 0.280612 \tabularnewline
44 & -0.076992 & -0.7056 & 0.241182 \tabularnewline
45 & 0.044358 & 0.4066 & 0.342685 \tabularnewline
46 & -0.031466 & -0.2884 & 0.386879 \tabularnewline
47 & 0.016697 & 0.153 & 0.439369 \tabularnewline
48 & -0.057867 & -0.5304 & 0.298632 \tabularnewline
\hline
\end{tabular}
%Source: https://freestatistics.org/blog/index.php?pk=282834&T=2

[TABLE]
[ROW][C]Partial Autocorrelation Function[/C][/ROW]
[ROW][C]Time lag k[/C][C]PACF(k)[/C][C]T-STAT[/C][C]P-value[/C][/ROW]
[ROW][C]1[/C][C]0.871576[/C][C]7.9881[/C][C]0[/C][/ROW]
[ROW][C]2[/C][C]-0.291792[/C][C]-2.6743[/C][C]0.004499[/C][/ROW]
[ROW][C]3[/C][C]0.281479[/C][C]2.5798[/C][C]0.005813[/C][/ROW]
[ROW][C]4[/C][C]0.131286[/C][C]1.2033[/C][C]0.116129[/C][/ROW]
[ROW][C]5[/C][C]0.101164[/C][C]0.9272[/C][C]0.178245[/C][/ROW]
[ROW][C]6[/C][C]-0.059304[/C][C]-0.5435[/C][C]0.294102[/C][/ROW]
[ROW][C]7[/C][C]-0.045077[/C][C]-0.4131[/C][C]0.34028[/C][/ROW]
[ROW][C]8[/C][C]-0.192657[/C][C]-1.7657[/C][C]0.040538[/C][/ROW]
[ROW][C]9[/C][C]0.040293[/C][C]0.3693[/C][C]0.356419[/C][/ROW]
[ROW][C]10[/C][C]0.091193[/C][C]0.8358[/C][C]0.20282[/C][/ROW]
[ROW][C]11[/C][C]0.219778[/C][C]2.0143[/C][C]0.023589[/C][/ROW]
[ROW][C]12[/C][C]-0.124708[/C][C]-1.143[/C][C]0.128149[/C][/ROW]
[ROW][C]13[/C][C]-0.479561[/C][C]-4.3952[/C][C]1.6e-05[/C][/ROW]
[ROW][C]14[/C][C]0.040827[/C][C]0.3742[/C][C]0.354603[/C][/ROW]
[ROW][C]15[/C][C]0.029291[/C][C]0.2685[/C][C]0.394504[/C][/ROW]
[ROW][C]16[/C][C]-0.064985[/C][C]-0.5956[/C][C]0.276524[/C][/ROW]
[ROW][C]17[/C][C]0.024629[/C][C]0.2257[/C][C]0.41098[/C][/ROW]
[ROW][C]18[/C][C]-0.031347[/C][C]-0.2873[/C][C]0.387295[/C][/ROW]
[ROW][C]19[/C][C]0.139283[/C][C]1.2765[/C][C]0.10264[/C][/ROW]
[ROW][C]20[/C][C]0.00563[/C][C]0.0516[/C][C]0.479485[/C][/ROW]
[ROW][C]21[/C][C]0.101258[/C][C]0.928[/C][C]0.178022[/C][/ROW]
[ROW][C]22[/C][C]0.020412[/C][C]0.1871[/C][C]0.426025[/C][/ROW]
[ROW][C]23[/C][C]0.133449[/C][C]1.2231[/C][C]0.112359[/C][/ROW]
[ROW][C]24[/C][C]0.085467[/C][C]0.7833[/C][C]0.217823[/C][/ROW]
[ROW][C]25[/C][C]-0.244567[/C][C]-2.2415[/C][C]0.013815[/C][/ROW]
[ROW][C]26[/C][C]0.029827[/C][C]0.2734[/C][C]0.392619[/C][/ROW]
[ROW][C]27[/C][C]-0.074682[/C][C]-0.6845[/C][C]0.247782[/C][/ROW]
[ROW][C]28[/C][C]-0.031488[/C][C]-0.2886[/C][C]0.386803[/C][/ROW]
[ROW][C]29[/C][C]-0.026843[/C][C]-0.246[/C][C]0.403133[/C][/ROW]
[ROW][C]30[/C][C]0.049074[/C][C]0.4498[/C][C]0.327016[/C][/ROW]
[ROW][C]31[/C][C]0.023206[/C][C]0.2127[/C][C]0.416044[/C][/ROW]
[ROW][C]32[/C][C]0.054866[/C][C]0.5029[/C][C]0.308191[/C][/ROW]
[ROW][C]33[/C][C]0.064368[/C][C]0.5899[/C][C]0.278408[/C][/ROW]
[ROW][C]34[/C][C]0.001608[/C][C]0.0147[/C][C]0.494137[/C][/ROW]
[ROW][C]35[/C][C]0.003094[/C][C]0.0284[/C][C]0.488722[/C][/ROW]
[ROW][C]36[/C][C]-0.010748[/C][C]-0.0985[/C][C]0.460883[/C][/ROW]
[ROW][C]37[/C][C]0.076137[/C][C]0.6978[/C][C]0.243613[/C][/ROW]
[ROW][C]38[/C][C]-0.011178[/C][C]-0.1024[/C][C]0.459323[/C][/ROW]
[ROW][C]39[/C][C]-0.03416[/C][C]-0.3131[/C][C]0.377496[/C][/ROW]
[ROW][C]40[/C][C]-0.025755[/C][C]-0.236[/C][C]0.406986[/C][/ROW]
[ROW][C]41[/C][C]-0.042248[/C][C]-0.3872[/C][C]0.349789[/C][/ROW]
[ROW][C]42[/C][C]-0.041786[/C][C]-0.383[/C][C]0.351352[/C][/ROW]
[ROW][C]43[/C][C]0.063648[/C][C]0.5833[/C][C]0.280612[/C][/ROW]
[ROW][C]44[/C][C]-0.076992[/C][C]-0.7056[/C][C]0.241182[/C][/ROW]
[ROW][C]45[/C][C]0.044358[/C][C]0.4066[/C][C]0.342685[/C][/ROW]
[ROW][C]46[/C][C]-0.031466[/C][C]-0.2884[/C][C]0.386879[/C][/ROW]
[ROW][C]47[/C][C]0.016697[/C][C]0.153[/C][C]0.439369[/C][/ROW]
[ROW][C]48[/C][C]-0.057867[/C][C]-0.5304[/C][C]0.298632[/C][/ROW]
[/TABLE]
Source: https://freestatistics.org/blog/index.php?pk=282834&T=2

Globally Unique Identifier (entire table): ba.freestatistics.org/blog/index.php?pk=282834&T=2

As an alternative you can also use a QR Code:  

The GUIDs for individual cells are displayed in the table below:

Partial Autocorrelation Function
Time lag kPACF(k)T-STATP-value
10.8715767.98810
2-0.291792-2.67430.004499
30.2814792.57980.005813
40.1312861.20330.116129
50.1011640.92720.178245
6-0.059304-0.54350.294102
7-0.045077-0.41310.34028
8-0.192657-1.76570.040538
90.0402930.36930.356419
100.0911930.83580.20282
110.2197782.01430.023589
12-0.124708-1.1430.128149
13-0.479561-4.39521.6e-05
140.0408270.37420.354603
150.0292910.26850.394504
16-0.064985-0.59560.276524
170.0246290.22570.41098
18-0.031347-0.28730.387295
190.1392831.27650.10264
200.005630.05160.479485
210.1012580.9280.178022
220.0204120.18710.426025
230.1334491.22310.112359
240.0854670.78330.217823
25-0.244567-2.24150.013815
260.0298270.27340.392619
27-0.074682-0.68450.247782
28-0.031488-0.28860.386803
29-0.026843-0.2460.403133
300.0490740.44980.327016
310.0232060.21270.416044
320.0548660.50290.308191
330.0643680.58990.278408
340.0016080.01470.494137
350.0030940.02840.488722
36-0.010748-0.09850.460883
370.0761370.69780.243613
38-0.011178-0.10240.459323
39-0.03416-0.31310.377496
40-0.025755-0.2360.406986
41-0.042248-0.38720.349789
42-0.041786-0.3830.351352
430.0636480.58330.280612
44-0.076992-0.70560.241182
450.0443580.40660.342685
46-0.031466-0.28840.386879
470.0166970.1530.439369
48-0.057867-0.53040.298632


Parameters (Session):
par1 = 48 ; par2 = 1 ; par3 = 0 ; par4 = 0 ; par5 = 12 ; par6 = White Noise ; par7 = 0.95 ;
Parameters (R input):
par1 = 48 ; par2 = 1 ; par3 = 0 ; par4 = 0 ; par5 = 12 ; par6 = White Noise ; par7 = 0.95 ; par8 = ;
R code (references can be found in the software module):
if (par1 == 'Default') {
par1 = 10*log10(length(x))
} else {
par1 <- as.numeric(par1)
}
par2 <- as.numeric(par2)
par3 <- as.numeric(par3)
par4 <- as.numeric(par4)
par5 <- as.numeric(par5)
if (par6 == 'White Noise') par6 <- 'white' else par6 <- 'ma'
par7 <- as.numeric(par7)
if (par8 != '') par8 <- as.numeric(par8)
ox <- x
if (par8 == '') {
if (par2 == 0) {
x <- log(x)
} else {
x <- (x ^ par2 - 1) / par2
}
} else {
x <- log(x,base=par8)
}
if (par3 > 0) x <- diff(x,lag=1,difference=par3)
if (par4 > 0) x <- diff(x,lag=par5,difference=par4)
bitmap(file='picts.png')
op <- par(mfrow=c(2,1))
plot(ox,type='l',main='Original Time Series',xlab='time',ylab='value')
if (par8=='') {
mytitle <- paste('Working Time Series (lambda=',par2,', d=',par3,', D=',par4,')',sep='')
mysub <- paste('(lambda=',par2,', d=',par3,', D=',par4,', CI=', par7, ', CI type=',par6,')',sep='')
} else {
mytitle <- paste('Working Time Series (base=',par8,', d=',par3,', D=',par4,')',sep='')
mysub <- paste('(base=',par8,', d=',par3,', D=',par4,', CI=', par7, ', CI type=',par6,')',sep='')
}
plot(x,type='l', main=mytitle,xlab='time',ylab='value')
par(op)
dev.off()
bitmap(file='pic1.png')
racf <- acf(x, par1, main='Autocorrelation', xlab='time lag', ylab='ACF', ci.type=par6, ci=par7, sub=mysub)
dev.off()
bitmap(file='pic2.png')
rpacf <- pacf(x,par1,main='Partial Autocorrelation',xlab='lags',ylab='PACF',sub=mysub)
dev.off()
(myacf <- c(racf$acf))
(mypacf <- c(rpacf$acf))
lengthx <- length(x)
sqrtn <- sqrt(lengthx)
load(file='createtable')
a<-table.start()
a<-table.row.start(a)
a<-table.element(a,'Autocorrelation Function',4,TRUE)
a<-table.row.end(a)
a<-table.row.start(a)
a<-table.element(a,'Time lag k',header=TRUE)
a<-table.element(a,hyperlink('basics.htm','ACF(k)','click here for more information about the Autocorrelation Function'),header=TRUE)
a<-table.element(a,'T-STAT',header=TRUE)
a<-table.element(a,'P-value',header=TRUE)
a<-table.row.end(a)
for (i in 2:(par1+1)) {
a<-table.row.start(a)
a<-table.element(a,i-1,header=TRUE)
a<-table.element(a,round(myacf[i],6))
mytstat <- myacf[i]*sqrtn
a<-table.element(a,round(mytstat,4))
a<-table.element(a,round(1-pt(abs(mytstat),lengthx),6))
a<-table.row.end(a)
}
a<-table.end(a)
table.save(a,file='mytable.tab')
a<-table.start()
a<-table.row.start(a)
a<-table.element(a,'Partial Autocorrelation Function',4,TRUE)
a<-table.row.end(a)
a<-table.row.start(a)
a<-table.element(a,'Time lag k',header=TRUE)
a<-table.element(a,hyperlink('basics.htm','PACF(k)','click here for more information about the Partial Autocorrelation Function'),header=TRUE)
a<-table.element(a,'T-STAT',header=TRUE)
a<-table.element(a,'P-value',header=TRUE)
a<-table.row.end(a)
for (i in 1:par1) {
a<-table.row.start(a)
a<-table.element(a,i,header=TRUE)
a<-table.element(a,round(mypacf[i],6))
mytstat <- mypacf[i]*sqrtn
a<-table.element(a,round(mytstat,4))
a<-table.element(a,round(1-pt(abs(mytstat),lengthx),6))
a<-table.row.end(a)
}
a<-table.end(a)
table.save(a,file='mytable1.tab')