Free Statistics

of Irreproducible Research!

Author's title

Author*Unverified author*
R Software Modulerwasp_autocorrelation.wasp
Title produced by software(Partial) Autocorrelation Function
Date of computationFri, 23 Oct 2015 09:40:58 +0100
Cite this page as followsStatistical Computations at FreeStatistics.org, Office for Research Development and Education, URL https://freestatistics.org/blog/index.php?v=date/2015/Oct/23/t14455896779f820y88t8vf17w.htm/, Retrieved Tue, 14 May 2024 22:18:12 +0000
Statistical Computations at FreeStatistics.org, Office for Research Development and Education, URL https://freestatistics.org/blog/index.php?pk=282839, Retrieved Tue, 14 May 2024 22:18:12 +0000
QR Codes:

Original text written by user:
IsPrivate?No (this computation is public)
User-defined keywords
Estimated Impact135
Family? (F = Feedback message, R = changed R code, M = changed R Module, P = changed Parameters, D = changed Data)
-       [(Partial) Autocorrelation Function] [] [2015-10-23 08:40:58] [4b4e0ace64f044c9dde59b15676ee69f] [Current]
- R PD    [(Partial) Autocorrelation Function] [] [2015-12-24 16:47:40] [b63ade344763e232a60872be122cd067]
Feedback Forum

Post a new message
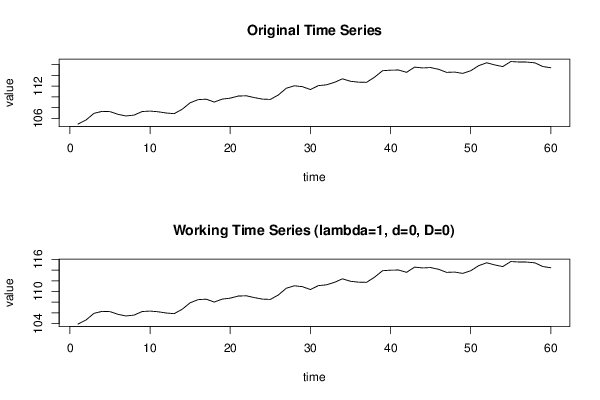
Dataseries X:
104,93
105,68
106,93
107,29
107,25
106,74
106,44
106,6
107,26
107,35
107,22
106,99
106,87
107,68
108,9
109,48
109,57
109,03
109,58
109,76
110,15
110,2
109,86
109,58
109,52
110,35
111,61
112,06
111,9
111,36
112,09
112,24
112,7
113,36
112,9
112,74
112,7
113,66
114,87
114,97
115
114,57
115,54
115,39
115,46
115,13
114,56
114,62
114,37
114,86
115,82
116,35
115,95
115,64
116,58
116,5
116,48
116,34
115,65
115,42


Summary of computational transaction
Raw Inputview raw input (R code)
Raw Outputview raw output of R engine
Computing time1 seconds
R Server'Gwilym Jenkins' @ jenkins.wessa.net

\begin{tabular}{lllllllll}
\hline
Summary of computational transaction \tabularnewline
Raw Input & view raw input (R code)  \tabularnewline
Raw Output & view raw output of R engine  \tabularnewline
Computing time & 1 seconds \tabularnewline
R Server & 'Gwilym Jenkins' @ jenkins.wessa.net \tabularnewline
\hline
\end{tabular}
%Source: https://freestatistics.org/blog/index.php?pk=282839&T=0

[TABLE]
[ROW][C]Summary of computational transaction[/C][/ROW]
[ROW][C]Raw Input[/C][C]view raw input (R code) [/C][/ROW]
[ROW][C]Raw Output[/C][C]view raw output of R engine [/C][/ROW]
[ROW][C]Computing time[/C][C]1 seconds[/C][/ROW]
[ROW][C]R Server[/C][C]'Gwilym Jenkins' @ jenkins.wessa.net[/C][/ROW]
[/TABLE]
Source: https://freestatistics.org/blog/index.php?pk=282839&T=0

Globally Unique Identifier (entire table): ba.freestatistics.org/blog/index.php?pk=282839&T=0

As an alternative you can also use a QR Code:  

The GUIDs for individual cells are displayed in the table below:

Summary of computational transaction
Raw Inputview raw input (R code)
Raw Outputview raw output of R engine
Computing time1 seconds
R Server'Gwilym Jenkins' @ jenkins.wessa.net


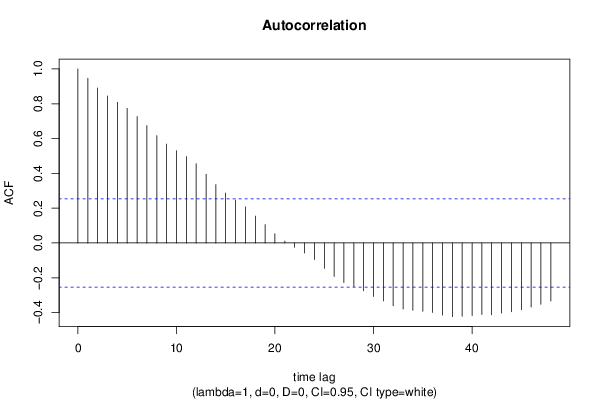
Autocorrelation Function
Time lag kACF(k)T-STATP-value
10.9466547.33280
20.8905866.89850
30.8444846.54130
40.808016.25880
50.7735985.99230
60.726655.62860
70.67455.22471e-06
80.6167234.77716e-06
90.5681344.40072.2e-05
100.5300584.10586.2e-05
110.4964293.84530.000147
120.4556493.52940.000403
130.3946493.05690.001668
140.3356212.59970.005864
150.2864092.21850.015157
160.2464461.9090.030527
170.2074071.60660.0567
180.1543631.19570.118261
190.1053880.81630.20877
200.0535240.41460.33996
210.0109640.08490.4663
22-0.024674-0.19110.424537
23-0.057616-0.44630.328495
24-0.095056-0.73630.232208
25-0.145882-1.130.131487
26-0.192772-1.49320.070312
27-0.227584-1.76290.041508
28-0.250856-1.94310.028349
29-0.274252-2.12430.018886
30-0.307278-2.38020.01025
31-0.332886-2.57850.006197
32-0.360336-2.79110.003517
33-0.379886-2.94260.002311
34-0.386764-2.99590.001987
35-0.39221-3.0380.001761
36-0.399518-3.09470.001496
37-0.414482-3.21060.001065
38-0.423275-3.27870.000869
39-0.421118-3.2620.000914
40-0.416451-3.22580.001018
41-0.411375-3.18650.001143
42-0.412342-3.1940.001118
43-0.402283-3.11610.001406
44-0.395166-3.06090.001649
45-0.382998-2.96670.002159
46-0.368015-2.85060.002987
47-0.352337-2.72920.00416
48-0.333783-2.58550.006086

\begin{tabular}{lllllllll}
\hline
Autocorrelation Function \tabularnewline
Time lag k & ACF(k) & T-STAT & P-value \tabularnewline
1 & 0.946654 & 7.3328 & 0 \tabularnewline
2 & 0.890586 & 6.8985 & 0 \tabularnewline
3 & 0.844484 & 6.5413 & 0 \tabularnewline
4 & 0.80801 & 6.2588 & 0 \tabularnewline
5 & 0.773598 & 5.9923 & 0 \tabularnewline
6 & 0.72665 & 5.6286 & 0 \tabularnewline
7 & 0.6745 & 5.2247 & 1e-06 \tabularnewline
8 & 0.616723 & 4.7771 & 6e-06 \tabularnewline
9 & 0.568134 & 4.4007 & 2.2e-05 \tabularnewline
10 & 0.530058 & 4.1058 & 6.2e-05 \tabularnewline
11 & 0.496429 & 3.8453 & 0.000147 \tabularnewline
12 & 0.455649 & 3.5294 & 0.000403 \tabularnewline
13 & 0.394649 & 3.0569 & 0.001668 \tabularnewline
14 & 0.335621 & 2.5997 & 0.005864 \tabularnewline
15 & 0.286409 & 2.2185 & 0.015157 \tabularnewline
16 & 0.246446 & 1.909 & 0.030527 \tabularnewline
17 & 0.207407 & 1.6066 & 0.0567 \tabularnewline
18 & 0.154363 & 1.1957 & 0.118261 \tabularnewline
19 & 0.105388 & 0.8163 & 0.20877 \tabularnewline
20 & 0.053524 & 0.4146 & 0.33996 \tabularnewline
21 & 0.010964 & 0.0849 & 0.4663 \tabularnewline
22 & -0.024674 & -0.1911 & 0.424537 \tabularnewline
23 & -0.057616 & -0.4463 & 0.328495 \tabularnewline
24 & -0.095056 & -0.7363 & 0.232208 \tabularnewline
25 & -0.145882 & -1.13 & 0.131487 \tabularnewline
26 & -0.192772 & -1.4932 & 0.070312 \tabularnewline
27 & -0.227584 & -1.7629 & 0.041508 \tabularnewline
28 & -0.250856 & -1.9431 & 0.028349 \tabularnewline
29 & -0.274252 & -2.1243 & 0.018886 \tabularnewline
30 & -0.307278 & -2.3802 & 0.01025 \tabularnewline
31 & -0.332886 & -2.5785 & 0.006197 \tabularnewline
32 & -0.360336 & -2.7911 & 0.003517 \tabularnewline
33 & -0.379886 & -2.9426 & 0.002311 \tabularnewline
34 & -0.386764 & -2.9959 & 0.001987 \tabularnewline
35 & -0.39221 & -3.038 & 0.001761 \tabularnewline
36 & -0.399518 & -3.0947 & 0.001496 \tabularnewline
37 & -0.414482 & -3.2106 & 0.001065 \tabularnewline
38 & -0.423275 & -3.2787 & 0.000869 \tabularnewline
39 & -0.421118 & -3.262 & 0.000914 \tabularnewline
40 & -0.416451 & -3.2258 & 0.001018 \tabularnewline
41 & -0.411375 & -3.1865 & 0.001143 \tabularnewline
42 & -0.412342 & -3.194 & 0.001118 \tabularnewline
43 & -0.402283 & -3.1161 & 0.001406 \tabularnewline
44 & -0.395166 & -3.0609 & 0.001649 \tabularnewline
45 & -0.382998 & -2.9667 & 0.002159 \tabularnewline
46 & -0.368015 & -2.8506 & 0.002987 \tabularnewline
47 & -0.352337 & -2.7292 & 0.00416 \tabularnewline
48 & -0.333783 & -2.5855 & 0.006086 \tabularnewline
\hline
\end{tabular}
%Source: https://freestatistics.org/blog/index.php?pk=282839&T=1

[TABLE]
[ROW][C]Autocorrelation Function[/C][/ROW]
[ROW][C]Time lag k[/C][C]ACF(k)[/C][C]T-STAT[/C][C]P-value[/C][/ROW]
[ROW][C]1[/C][C]0.946654[/C][C]7.3328[/C][C]0[/C][/ROW]
[ROW][C]2[/C][C]0.890586[/C][C]6.8985[/C][C]0[/C][/ROW]
[ROW][C]3[/C][C]0.844484[/C][C]6.5413[/C][C]0[/C][/ROW]
[ROW][C]4[/C][C]0.80801[/C][C]6.2588[/C][C]0[/C][/ROW]
[ROW][C]5[/C][C]0.773598[/C][C]5.9923[/C][C]0[/C][/ROW]
[ROW][C]6[/C][C]0.72665[/C][C]5.6286[/C][C]0[/C][/ROW]
[ROW][C]7[/C][C]0.6745[/C][C]5.2247[/C][C]1e-06[/C][/ROW]
[ROW][C]8[/C][C]0.616723[/C][C]4.7771[/C][C]6e-06[/C][/ROW]
[ROW][C]9[/C][C]0.568134[/C][C]4.4007[/C][C]2.2e-05[/C][/ROW]
[ROW][C]10[/C][C]0.530058[/C][C]4.1058[/C][C]6.2e-05[/C][/ROW]
[ROW][C]11[/C][C]0.496429[/C][C]3.8453[/C][C]0.000147[/C][/ROW]
[ROW][C]12[/C][C]0.455649[/C][C]3.5294[/C][C]0.000403[/C][/ROW]
[ROW][C]13[/C][C]0.394649[/C][C]3.0569[/C][C]0.001668[/C][/ROW]
[ROW][C]14[/C][C]0.335621[/C][C]2.5997[/C][C]0.005864[/C][/ROW]
[ROW][C]15[/C][C]0.286409[/C][C]2.2185[/C][C]0.015157[/C][/ROW]
[ROW][C]16[/C][C]0.246446[/C][C]1.909[/C][C]0.030527[/C][/ROW]
[ROW][C]17[/C][C]0.207407[/C][C]1.6066[/C][C]0.0567[/C][/ROW]
[ROW][C]18[/C][C]0.154363[/C][C]1.1957[/C][C]0.118261[/C][/ROW]
[ROW][C]19[/C][C]0.105388[/C][C]0.8163[/C][C]0.20877[/C][/ROW]
[ROW][C]20[/C][C]0.053524[/C][C]0.4146[/C][C]0.33996[/C][/ROW]
[ROW][C]21[/C][C]0.010964[/C][C]0.0849[/C][C]0.4663[/C][/ROW]
[ROW][C]22[/C][C]-0.024674[/C][C]-0.1911[/C][C]0.424537[/C][/ROW]
[ROW][C]23[/C][C]-0.057616[/C][C]-0.4463[/C][C]0.328495[/C][/ROW]
[ROW][C]24[/C][C]-0.095056[/C][C]-0.7363[/C][C]0.232208[/C][/ROW]
[ROW][C]25[/C][C]-0.145882[/C][C]-1.13[/C][C]0.131487[/C][/ROW]
[ROW][C]26[/C][C]-0.192772[/C][C]-1.4932[/C][C]0.070312[/C][/ROW]
[ROW][C]27[/C][C]-0.227584[/C][C]-1.7629[/C][C]0.041508[/C][/ROW]
[ROW][C]28[/C][C]-0.250856[/C][C]-1.9431[/C][C]0.028349[/C][/ROW]
[ROW][C]29[/C][C]-0.274252[/C][C]-2.1243[/C][C]0.018886[/C][/ROW]
[ROW][C]30[/C][C]-0.307278[/C][C]-2.3802[/C][C]0.01025[/C][/ROW]
[ROW][C]31[/C][C]-0.332886[/C][C]-2.5785[/C][C]0.006197[/C][/ROW]
[ROW][C]32[/C][C]-0.360336[/C][C]-2.7911[/C][C]0.003517[/C][/ROW]
[ROW][C]33[/C][C]-0.379886[/C][C]-2.9426[/C][C]0.002311[/C][/ROW]
[ROW][C]34[/C][C]-0.386764[/C][C]-2.9959[/C][C]0.001987[/C][/ROW]
[ROW][C]35[/C][C]-0.39221[/C][C]-3.038[/C][C]0.001761[/C][/ROW]
[ROW][C]36[/C][C]-0.399518[/C][C]-3.0947[/C][C]0.001496[/C][/ROW]
[ROW][C]37[/C][C]-0.414482[/C][C]-3.2106[/C][C]0.001065[/C][/ROW]
[ROW][C]38[/C][C]-0.423275[/C][C]-3.2787[/C][C]0.000869[/C][/ROW]
[ROW][C]39[/C][C]-0.421118[/C][C]-3.262[/C][C]0.000914[/C][/ROW]
[ROW][C]40[/C][C]-0.416451[/C][C]-3.2258[/C][C]0.001018[/C][/ROW]
[ROW][C]41[/C][C]-0.411375[/C][C]-3.1865[/C][C]0.001143[/C][/ROW]
[ROW][C]42[/C][C]-0.412342[/C][C]-3.194[/C][C]0.001118[/C][/ROW]
[ROW][C]43[/C][C]-0.402283[/C][C]-3.1161[/C][C]0.001406[/C][/ROW]
[ROW][C]44[/C][C]-0.395166[/C][C]-3.0609[/C][C]0.001649[/C][/ROW]
[ROW][C]45[/C][C]-0.382998[/C][C]-2.9667[/C][C]0.002159[/C][/ROW]
[ROW][C]46[/C][C]-0.368015[/C][C]-2.8506[/C][C]0.002987[/C][/ROW]
[ROW][C]47[/C][C]-0.352337[/C][C]-2.7292[/C][C]0.00416[/C][/ROW]
[ROW][C]48[/C][C]-0.333783[/C][C]-2.5855[/C][C]0.006086[/C][/ROW]
[/TABLE]
Source: https://freestatistics.org/blog/index.php?pk=282839&T=1

Globally Unique Identifier (entire table): ba.freestatistics.org/blog/index.php?pk=282839&T=1

As an alternative you can also use a QR Code:  

The GUIDs for individual cells are displayed in the table below:

Autocorrelation Function
Time lag kACF(k)T-STATP-value
10.9466547.33280
20.8905866.89850
30.8444846.54130
40.808016.25880
50.7735985.99230
60.726655.62860
70.67455.22471e-06
80.6167234.77716e-06
90.5681344.40072.2e-05
100.5300584.10586.2e-05
110.4964293.84530.000147
120.4556493.52940.000403
130.3946493.05690.001668
140.3356212.59970.005864
150.2864092.21850.015157
160.2464461.9090.030527
170.2074071.60660.0567
180.1543631.19570.118261
190.1053880.81630.20877
200.0535240.41460.33996
210.0109640.08490.4663
22-0.024674-0.19110.424537
23-0.057616-0.44630.328495
24-0.095056-0.73630.232208
25-0.145882-1.130.131487
26-0.192772-1.49320.070312
27-0.227584-1.76290.041508
28-0.250856-1.94310.028349
29-0.274252-2.12430.018886
30-0.307278-2.38020.01025
31-0.332886-2.57850.006197
32-0.360336-2.79110.003517
33-0.379886-2.94260.002311
34-0.386764-2.99590.001987
35-0.39221-3.0380.001761
36-0.399518-3.09470.001496
37-0.414482-3.21060.001065
38-0.423275-3.27870.000869
39-0.421118-3.2620.000914
40-0.416451-3.22580.001018
41-0.411375-3.18650.001143
42-0.412342-3.1940.001118
43-0.402283-3.11610.001406
44-0.395166-3.06090.001649
45-0.382998-2.96670.002159
46-0.368015-2.85060.002987
47-0.352337-2.72920.00416
48-0.333783-2.58550.006086


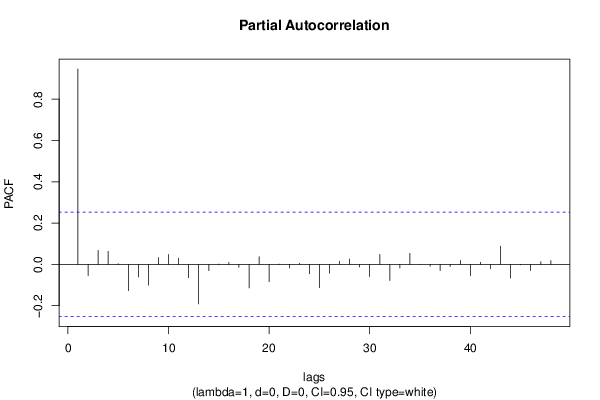
Partial Autocorrelation Function
Time lag kPACF(k)T-STATP-value
10.9466547.33280
2-0.05362-0.41530.339688
30.0672170.52070.302259
40.0630240.48820.313599
50.0031680.02450.490252
6-0.127063-0.98420.164479
7-0.061298-0.47480.318323
8-0.100451-0.77810.219787
90.0328510.25450.400004
100.0479360.37130.355857
110.0298640.23130.408926
12-0.063973-0.49550.311017
13-0.191242-1.48140.071873
14-0.030133-0.23340.408118
150.0014270.01110.495607
160.0093040.07210.471393
17-0.013422-0.1040.45877
18-0.113874-0.88210.190631
190.0369940.28660.387721
20-0.083382-0.64590.260411
210.0006740.00520.497924
22-0.016996-0.13170.447849
230.0055310.04280.482985
24-0.045251-0.35050.363591
25-0.11256-0.87190.193372
26-0.042491-0.32910.3716
270.0152060.11780.453316
280.0265450.20560.418893
29-0.012705-0.09840.460967
30-0.058848-0.45580.325076
310.0479210.37120.3559
32-0.078268-0.60630.273315
33-0.017202-0.13320.447221
340.0533840.41350.340355
351.5e-051e-040.499954
36-0.009294-0.0720.471425
37-0.029223-0.22640.410845
38-0.009831-0.07620.469776
390.0192770.14930.440902
40-0.054807-0.42450.336347
410.0104190.08070.467973
42-0.021321-0.16520.434689
430.0884370.6850.247982
44-0.066031-0.51150.305449
45-0.00156-0.01210.495198
46-0.02944-0.2280.410193
470.0127170.09850.460929
480.0185560.14370.443097

\begin{tabular}{lllllllll}
\hline
Partial Autocorrelation Function \tabularnewline
Time lag k & PACF(k) & T-STAT & P-value \tabularnewline
1 & 0.946654 & 7.3328 & 0 \tabularnewline
2 & -0.05362 & -0.4153 & 0.339688 \tabularnewline
3 & 0.067217 & 0.5207 & 0.302259 \tabularnewline
4 & 0.063024 & 0.4882 & 0.313599 \tabularnewline
5 & 0.003168 & 0.0245 & 0.490252 \tabularnewline
6 & -0.127063 & -0.9842 & 0.164479 \tabularnewline
7 & -0.061298 & -0.4748 & 0.318323 \tabularnewline
8 & -0.100451 & -0.7781 & 0.219787 \tabularnewline
9 & 0.032851 & 0.2545 & 0.400004 \tabularnewline
10 & 0.047936 & 0.3713 & 0.355857 \tabularnewline
11 & 0.029864 & 0.2313 & 0.408926 \tabularnewline
12 & -0.063973 & -0.4955 & 0.311017 \tabularnewline
13 & -0.191242 & -1.4814 & 0.071873 \tabularnewline
14 & -0.030133 & -0.2334 & 0.408118 \tabularnewline
15 & 0.001427 & 0.0111 & 0.495607 \tabularnewline
16 & 0.009304 & 0.0721 & 0.471393 \tabularnewline
17 & -0.013422 & -0.104 & 0.45877 \tabularnewline
18 & -0.113874 & -0.8821 & 0.190631 \tabularnewline
19 & 0.036994 & 0.2866 & 0.387721 \tabularnewline
20 & -0.083382 & -0.6459 & 0.260411 \tabularnewline
21 & 0.000674 & 0.0052 & 0.497924 \tabularnewline
22 & -0.016996 & -0.1317 & 0.447849 \tabularnewline
23 & 0.005531 & 0.0428 & 0.482985 \tabularnewline
24 & -0.045251 & -0.3505 & 0.363591 \tabularnewline
25 & -0.11256 & -0.8719 & 0.193372 \tabularnewline
26 & -0.042491 & -0.3291 & 0.3716 \tabularnewline
27 & 0.015206 & 0.1178 & 0.453316 \tabularnewline
28 & 0.026545 & 0.2056 & 0.418893 \tabularnewline
29 & -0.012705 & -0.0984 & 0.460967 \tabularnewline
30 & -0.058848 & -0.4558 & 0.325076 \tabularnewline
31 & 0.047921 & 0.3712 & 0.3559 \tabularnewline
32 & -0.078268 & -0.6063 & 0.273315 \tabularnewline
33 & -0.017202 & -0.1332 & 0.447221 \tabularnewline
34 & 0.053384 & 0.4135 & 0.340355 \tabularnewline
35 & 1.5e-05 & 1e-04 & 0.499954 \tabularnewline
36 & -0.009294 & -0.072 & 0.471425 \tabularnewline
37 & -0.029223 & -0.2264 & 0.410845 \tabularnewline
38 & -0.009831 & -0.0762 & 0.469776 \tabularnewline
39 & 0.019277 & 0.1493 & 0.440902 \tabularnewline
40 & -0.054807 & -0.4245 & 0.336347 \tabularnewline
41 & 0.010419 & 0.0807 & 0.467973 \tabularnewline
42 & -0.021321 & -0.1652 & 0.434689 \tabularnewline
43 & 0.088437 & 0.685 & 0.247982 \tabularnewline
44 & -0.066031 & -0.5115 & 0.305449 \tabularnewline
45 & -0.00156 & -0.0121 & 0.495198 \tabularnewline
46 & -0.02944 & -0.228 & 0.410193 \tabularnewline
47 & 0.012717 & 0.0985 & 0.460929 \tabularnewline
48 & 0.018556 & 0.1437 & 0.443097 \tabularnewline
\hline
\end{tabular}
%Source: https://freestatistics.org/blog/index.php?pk=282839&T=2

[TABLE]
[ROW][C]Partial Autocorrelation Function[/C][/ROW]
[ROW][C]Time lag k[/C][C]PACF(k)[/C][C]T-STAT[/C][C]P-value[/C][/ROW]
[ROW][C]1[/C][C]0.946654[/C][C]7.3328[/C][C]0[/C][/ROW]
[ROW][C]2[/C][C]-0.05362[/C][C]-0.4153[/C][C]0.339688[/C][/ROW]
[ROW][C]3[/C][C]0.067217[/C][C]0.5207[/C][C]0.302259[/C][/ROW]
[ROW][C]4[/C][C]0.063024[/C][C]0.4882[/C][C]0.313599[/C][/ROW]
[ROW][C]5[/C][C]0.003168[/C][C]0.0245[/C][C]0.490252[/C][/ROW]
[ROW][C]6[/C][C]-0.127063[/C][C]-0.9842[/C][C]0.164479[/C][/ROW]
[ROW][C]7[/C][C]-0.061298[/C][C]-0.4748[/C][C]0.318323[/C][/ROW]
[ROW][C]8[/C][C]-0.100451[/C][C]-0.7781[/C][C]0.219787[/C][/ROW]
[ROW][C]9[/C][C]0.032851[/C][C]0.2545[/C][C]0.400004[/C][/ROW]
[ROW][C]10[/C][C]0.047936[/C][C]0.3713[/C][C]0.355857[/C][/ROW]
[ROW][C]11[/C][C]0.029864[/C][C]0.2313[/C][C]0.408926[/C][/ROW]
[ROW][C]12[/C][C]-0.063973[/C][C]-0.4955[/C][C]0.311017[/C][/ROW]
[ROW][C]13[/C][C]-0.191242[/C][C]-1.4814[/C][C]0.071873[/C][/ROW]
[ROW][C]14[/C][C]-0.030133[/C][C]-0.2334[/C][C]0.408118[/C][/ROW]
[ROW][C]15[/C][C]0.001427[/C][C]0.0111[/C][C]0.495607[/C][/ROW]
[ROW][C]16[/C][C]0.009304[/C][C]0.0721[/C][C]0.471393[/C][/ROW]
[ROW][C]17[/C][C]-0.013422[/C][C]-0.104[/C][C]0.45877[/C][/ROW]
[ROW][C]18[/C][C]-0.113874[/C][C]-0.8821[/C][C]0.190631[/C][/ROW]
[ROW][C]19[/C][C]0.036994[/C][C]0.2866[/C][C]0.387721[/C][/ROW]
[ROW][C]20[/C][C]-0.083382[/C][C]-0.6459[/C][C]0.260411[/C][/ROW]
[ROW][C]21[/C][C]0.000674[/C][C]0.0052[/C][C]0.497924[/C][/ROW]
[ROW][C]22[/C][C]-0.016996[/C][C]-0.1317[/C][C]0.447849[/C][/ROW]
[ROW][C]23[/C][C]0.005531[/C][C]0.0428[/C][C]0.482985[/C][/ROW]
[ROW][C]24[/C][C]-0.045251[/C][C]-0.3505[/C][C]0.363591[/C][/ROW]
[ROW][C]25[/C][C]-0.11256[/C][C]-0.8719[/C][C]0.193372[/C][/ROW]
[ROW][C]26[/C][C]-0.042491[/C][C]-0.3291[/C][C]0.3716[/C][/ROW]
[ROW][C]27[/C][C]0.015206[/C][C]0.1178[/C][C]0.453316[/C][/ROW]
[ROW][C]28[/C][C]0.026545[/C][C]0.2056[/C][C]0.418893[/C][/ROW]
[ROW][C]29[/C][C]-0.012705[/C][C]-0.0984[/C][C]0.460967[/C][/ROW]
[ROW][C]30[/C][C]-0.058848[/C][C]-0.4558[/C][C]0.325076[/C][/ROW]
[ROW][C]31[/C][C]0.047921[/C][C]0.3712[/C][C]0.3559[/C][/ROW]
[ROW][C]32[/C][C]-0.078268[/C][C]-0.6063[/C][C]0.273315[/C][/ROW]
[ROW][C]33[/C][C]-0.017202[/C][C]-0.1332[/C][C]0.447221[/C][/ROW]
[ROW][C]34[/C][C]0.053384[/C][C]0.4135[/C][C]0.340355[/C][/ROW]
[ROW][C]35[/C][C]1.5e-05[/C][C]1e-04[/C][C]0.499954[/C][/ROW]
[ROW][C]36[/C][C]-0.009294[/C][C]-0.072[/C][C]0.471425[/C][/ROW]
[ROW][C]37[/C][C]-0.029223[/C][C]-0.2264[/C][C]0.410845[/C][/ROW]
[ROW][C]38[/C][C]-0.009831[/C][C]-0.0762[/C][C]0.469776[/C][/ROW]
[ROW][C]39[/C][C]0.019277[/C][C]0.1493[/C][C]0.440902[/C][/ROW]
[ROW][C]40[/C][C]-0.054807[/C][C]-0.4245[/C][C]0.336347[/C][/ROW]
[ROW][C]41[/C][C]0.010419[/C][C]0.0807[/C][C]0.467973[/C][/ROW]
[ROW][C]42[/C][C]-0.021321[/C][C]-0.1652[/C][C]0.434689[/C][/ROW]
[ROW][C]43[/C][C]0.088437[/C][C]0.685[/C][C]0.247982[/C][/ROW]
[ROW][C]44[/C][C]-0.066031[/C][C]-0.5115[/C][C]0.305449[/C][/ROW]
[ROW][C]45[/C][C]-0.00156[/C][C]-0.0121[/C][C]0.495198[/C][/ROW]
[ROW][C]46[/C][C]-0.02944[/C][C]-0.228[/C][C]0.410193[/C][/ROW]
[ROW][C]47[/C][C]0.012717[/C][C]0.0985[/C][C]0.460929[/C][/ROW]
[ROW][C]48[/C][C]0.018556[/C][C]0.1437[/C][C]0.443097[/C][/ROW]
[/TABLE]
Source: https://freestatistics.org/blog/index.php?pk=282839&T=2

Globally Unique Identifier (entire table): ba.freestatistics.org/blog/index.php?pk=282839&T=2

As an alternative you can also use a QR Code:  

The GUIDs for individual cells are displayed in the table below:

Partial Autocorrelation Function
Time lag kPACF(k)T-STATP-value
10.9466547.33280
2-0.05362-0.41530.339688
30.0672170.52070.302259
40.0630240.48820.313599
50.0031680.02450.490252
6-0.127063-0.98420.164479
7-0.061298-0.47480.318323
8-0.100451-0.77810.219787
90.0328510.25450.400004
100.0479360.37130.355857
110.0298640.23130.408926
12-0.063973-0.49550.311017
13-0.191242-1.48140.071873
14-0.030133-0.23340.408118
150.0014270.01110.495607
160.0093040.07210.471393
17-0.013422-0.1040.45877
18-0.113874-0.88210.190631
190.0369940.28660.387721
20-0.083382-0.64590.260411
210.0006740.00520.497924
22-0.016996-0.13170.447849
230.0055310.04280.482985
24-0.045251-0.35050.363591
25-0.11256-0.87190.193372
26-0.042491-0.32910.3716
270.0152060.11780.453316
280.0265450.20560.418893
29-0.012705-0.09840.460967
30-0.058848-0.45580.325076
310.0479210.37120.3559
32-0.078268-0.60630.273315
33-0.017202-0.13320.447221
340.0533840.41350.340355
351.5e-051e-040.499954
36-0.009294-0.0720.471425
37-0.029223-0.22640.410845
38-0.009831-0.07620.469776
390.0192770.14930.440902
40-0.054807-0.42450.336347
410.0104190.08070.467973
42-0.021321-0.16520.434689
430.0884370.6850.247982
44-0.066031-0.51150.305449
45-0.00156-0.01210.495198
46-0.02944-0.2280.410193
470.0127170.09850.460929
480.0185560.14370.443097


Parameters (Session):
par1 = 48 ; par2 = 1 ; par3 = 0 ; par4 = 0 ; par5 = 12 ; par6 = White Noise ; par7 = 0.95 ;
Parameters (R input):
par1 = 48 ; par2 = 1 ; par3 = 0 ; par4 = 0 ; par5 = 12 ; par6 = White Noise ; par7 = 0.95 ; par8 = ;
R code (references can be found in the software module):
if (par1 == 'Default') {
par1 = 10*log10(length(x))
} else {
par1 <- as.numeric(par1)
}
par2 <- as.numeric(par2)
par3 <- as.numeric(par3)
par4 <- as.numeric(par4)
par5 <- as.numeric(par5)
if (par6 == 'White Noise') par6 <- 'white' else par6 <- 'ma'
par7 <- as.numeric(par7)
if (par8 != '') par8 <- as.numeric(par8)
ox <- x
if (par8 == '') {
if (par2 == 0) {
x <- log(x)
} else {
x <- (x ^ par2 - 1) / par2
}
} else {
x <- log(x,base=par8)
}
if (par3 > 0) x <- diff(x,lag=1,difference=par3)
if (par4 > 0) x <- diff(x,lag=par5,difference=par4)
bitmap(file='picts.png')
op <- par(mfrow=c(2,1))
plot(ox,type='l',main='Original Time Series',xlab='time',ylab='value')
if (par8=='') {
mytitle <- paste('Working Time Series (lambda=',par2,', d=',par3,', D=',par4,')',sep='')
mysub <- paste('(lambda=',par2,', d=',par3,', D=',par4,', CI=', par7, ', CI type=',par6,')',sep='')
} else {
mytitle <- paste('Working Time Series (base=',par8,', d=',par3,', D=',par4,')',sep='')
mysub <- paste('(base=',par8,', d=',par3,', D=',par4,', CI=', par7, ', CI type=',par6,')',sep='')
}
plot(x,type='l', main=mytitle,xlab='time',ylab='value')
par(op)
dev.off()
bitmap(file='pic1.png')
racf <- acf(x, par1, main='Autocorrelation', xlab='time lag', ylab='ACF', ci.type=par6, ci=par7, sub=mysub)
dev.off()
bitmap(file='pic2.png')
rpacf <- pacf(x,par1,main='Partial Autocorrelation',xlab='lags',ylab='PACF',sub=mysub)
dev.off()
(myacf <- c(racf$acf))
(mypacf <- c(rpacf$acf))
lengthx <- length(x)
sqrtn <- sqrt(lengthx)
load(file='createtable')
a<-table.start()
a<-table.row.start(a)
a<-table.element(a,'Autocorrelation Function',4,TRUE)
a<-table.row.end(a)
a<-table.row.start(a)
a<-table.element(a,'Time lag k',header=TRUE)
a<-table.element(a,hyperlink('basics.htm','ACF(k)','click here for more information about the Autocorrelation Function'),header=TRUE)
a<-table.element(a,'T-STAT',header=TRUE)
a<-table.element(a,'P-value',header=TRUE)
a<-table.row.end(a)
for (i in 2:(par1+1)) {
a<-table.row.start(a)
a<-table.element(a,i-1,header=TRUE)
a<-table.element(a,round(myacf[i],6))
mytstat <- myacf[i]*sqrtn
a<-table.element(a,round(mytstat,4))
a<-table.element(a,round(1-pt(abs(mytstat),lengthx),6))
a<-table.row.end(a)
}
a<-table.end(a)
table.save(a,file='mytable.tab')
a<-table.start()
a<-table.row.start(a)
a<-table.element(a,'Partial Autocorrelation Function',4,TRUE)
a<-table.row.end(a)
a<-table.row.start(a)
a<-table.element(a,'Time lag k',header=TRUE)
a<-table.element(a,hyperlink('basics.htm','PACF(k)','click here for more information about the Partial Autocorrelation Function'),header=TRUE)
a<-table.element(a,'T-STAT',header=TRUE)
a<-table.element(a,'P-value',header=TRUE)
a<-table.row.end(a)
for (i in 1:par1) {
a<-table.row.start(a)
a<-table.element(a,i,header=TRUE)
a<-table.element(a,round(mypacf[i],6))
mytstat <- mypacf[i]*sqrtn
a<-table.element(a,round(mytstat,4))
a<-table.element(a,round(1-pt(abs(mytstat),lengthx),6))
a<-table.row.end(a)
}
a<-table.end(a)
table.save(a,file='mytable1.tab')