Free Statistics

of Irreproducible Research!

Author's title

Author*Unverified author*
R Software Modulerwasp_autocorrelation.wasp
Title produced by software(Partial) Autocorrelation Function
Date of computationFri, 23 Oct 2015 09:57:56 +0100
Cite this page as followsStatistical Computations at FreeStatistics.org, Office for Research Development and Education, URL https://freestatistics.org/blog/index.php?v=date/2015/Oct/23/t1445590813z0t7jvdsvlxapl4.htm/, Retrieved Tue, 14 May 2024 22:21:03 +0000
Statistical Computations at FreeStatistics.org, Office for Research Development and Education, URL https://freestatistics.org/blog/index.php?pk=282851, Retrieved Tue, 14 May 2024 22:21:03 +0000
QR Codes:

Original text written by user:
IsPrivate?No (this computation is public)
User-defined keywords
Estimated Impact93
Family? (F = Feedback message, R = changed R code, M = changed R Module, P = changed Parameters, D = changed Data)
-       [(Partial) Autocorrelation Function] [cijfergegevens-op...] [2015-10-23 08:57:56] [df110f336183c9d15b985c5fac87d8f5] [Current]
Feedback Forum

Post a new message
Dataseries X:
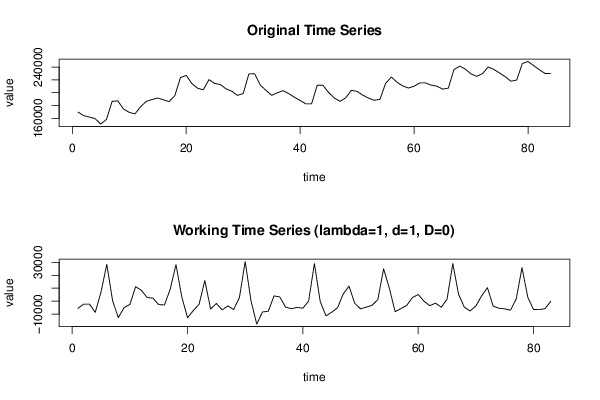
169701
164182
161914
159612
151001
158114
186530
187069
174330
169362
166827
178037
186412
189226
191563
188906
186005
195309
223532
226899
214126
206903
204442
220376
214320
212588
205816
202196
195722
198563
229139
229527
211868
203555
195770
199834
203089
198480
192684
187827
182414
182510
211524
211451
200140
191568
186424
191987
203583
201920
195978
191395
188222
189422
214419
224325
216222
210506
207221
210027
215191
215177
211701
210176
205491
206996
235980
241292
236675
229127
225436
229570
239973
236168
230703
224790
217811
219576
245472
248511
242084
235572
229827
229697


Summary of computational transaction
Raw Inputview raw input (R code)
Raw Outputview raw output of R engine
Computing time1 seconds
R Server'Gwilym Jenkins' @ jenkins.wessa.net
R Framework error message
Warning: there are blank lines in the 'Data' field.
Please, use NA for missing data - blank lines are simply
 deleted and are NOT treated as missing values.

\begin{tabular}{lllllllll}
\hline
Summary of computational transaction \tabularnewline
Raw Input & view raw input (R code)  \tabularnewline
Raw Output & view raw output of R engine  \tabularnewline
Computing time & 1 seconds \tabularnewline
R Server & 'Gwilym Jenkins' @ jenkins.wessa.net \tabularnewline
R Framework error message & 
Warning: there are blank lines in the 'Data' field.
Please, use NA for missing data - blank lines are simply
 deleted and are NOT treated as missing values.
\tabularnewline \hline \end{tabular} %Source: https://freestatistics.org/blog/index.php?pk=282851&T=0

[TABLE]
[ROW][C]Summary of computational transaction[/C][/ROW]
[ROW][C]Raw Input[/C][C]view raw input (R code) [/C][/ROW]
[ROW][C]Raw Output[/C][C]view raw output of R engine [/C][/ROW]
[ROW][C]Computing time[/C][C]1 seconds[/C][/ROW]
[ROW][C]R Server[/C][C]'Gwilym Jenkins' @ jenkins.wessa.net[/C][/ROW]
[ROW][C]R Framework error message[/C][C]
Warning: there are blank lines in the 'Data' field.
Please, use NA for missing data - blank lines are simply
 deleted and are NOT treated as missing values.
[/C][/ROW] [/TABLE] Source: https://freestatistics.org/blog/index.php?pk=282851&T=0

Globally Unique Identifier (entire table): ba.freestatistics.org/blog/index.php?pk=282851&T=0

As an alternative you can also use a QR Code:  

The GUIDs for individual cells are displayed in the table below:

Summary of computational transaction
Raw Inputview raw input (R code)
Raw Outputview raw output of R engine
Computing time1 seconds
R Server'Gwilym Jenkins' @ jenkins.wessa.net
R Framework error message
Warning: there are blank lines in the 'Data' field.
Please, use NA for missing data - blank lines are simply
 deleted and are NOT treated as missing values.


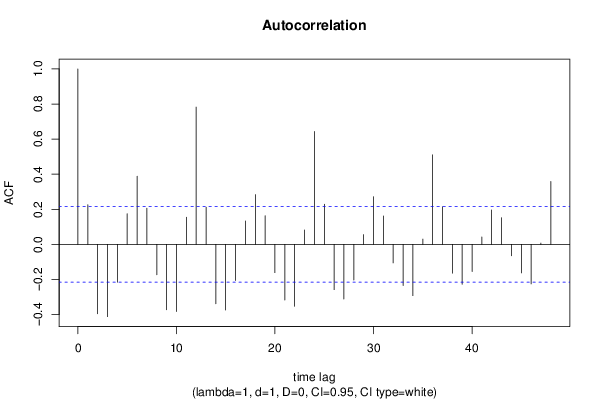
Autocorrelation Function
Time lag kACF(k)T-STATP-value
10.2263642.06230.021154
2-0.395447-3.60270.000268
3-0.412086-3.75430.000161
4-0.215442-1.96280.026511
50.1749531.59390.05738
60.3885743.54010.000329
70.20561.87310.032287
8-0.17356-1.58120.058817
9-0.372588-3.39440.000528
10-0.38274-3.48690.000392
110.1550471.41250.080764
120.7824517.12850
130.2114851.92670.028718
14-0.338384-3.08280.001392
15-0.373777-3.40530.00051
16-0.206023-1.8770.032019
170.1337011.21810.113324
180.2836632.58430.005754
190.1632271.48710.070393
20-0.160994-1.46670.073114
21-0.317178-2.88960.00246
22-0.352945-3.21550.000928
230.0816560.74390.229512
240.6430485.85840
250.2291792.08790.019935
26-0.258251-2.35280.0105
27-0.311919-2.84170.002822
28-0.202844-1.8480.034083
290.0557810.50820.306335
300.2718362.47650.007649
310.1617961.4740.072127
32-0.105763-0.96350.169036
33-0.234677-2.1380.017729
34-0.292418-2.66410.004637
350.0300830.27410.392356
360.5102294.64846e-06
370.2139321.9490.027336
38-0.163947-1.49360.069533
39-0.227406-2.07180.020696
40-0.154678-1.40920.081259
410.042490.38710.349836
420.196061.78620.03886
430.1519281.38410.085015
44-0.064877-0.59110.278045
45-0.162669-1.4820.071066
46-0.225181-2.05150.021686
470.0072210.06580.473854
480.3582673.2640.000798

\begin{tabular}{lllllllll}
\hline
Autocorrelation Function \tabularnewline
Time lag k & ACF(k) & T-STAT & P-value \tabularnewline
1 & 0.226364 & 2.0623 & 0.021154 \tabularnewline
2 & -0.395447 & -3.6027 & 0.000268 \tabularnewline
3 & -0.412086 & -3.7543 & 0.000161 \tabularnewline
4 & -0.215442 & -1.9628 & 0.026511 \tabularnewline
5 & 0.174953 & 1.5939 & 0.05738 \tabularnewline
6 & 0.388574 & 3.5401 & 0.000329 \tabularnewline
7 & 0.2056 & 1.8731 & 0.032287 \tabularnewline
8 & -0.17356 & -1.5812 & 0.058817 \tabularnewline
9 & -0.372588 & -3.3944 & 0.000528 \tabularnewline
10 & -0.38274 & -3.4869 & 0.000392 \tabularnewline
11 & 0.155047 & 1.4125 & 0.080764 \tabularnewline
12 & 0.782451 & 7.1285 & 0 \tabularnewline
13 & 0.211485 & 1.9267 & 0.028718 \tabularnewline
14 & -0.338384 & -3.0828 & 0.001392 \tabularnewline
15 & -0.373777 & -3.4053 & 0.00051 \tabularnewline
16 & -0.206023 & -1.877 & 0.032019 \tabularnewline
17 & 0.133701 & 1.2181 & 0.113324 \tabularnewline
18 & 0.283663 & 2.5843 & 0.005754 \tabularnewline
19 & 0.163227 & 1.4871 & 0.070393 \tabularnewline
20 & -0.160994 & -1.4667 & 0.073114 \tabularnewline
21 & -0.317178 & -2.8896 & 0.00246 \tabularnewline
22 & -0.352945 & -3.2155 & 0.000928 \tabularnewline
23 & 0.081656 & 0.7439 & 0.229512 \tabularnewline
24 & 0.643048 & 5.8584 & 0 \tabularnewline
25 & 0.229179 & 2.0879 & 0.019935 \tabularnewline
26 & -0.258251 & -2.3528 & 0.0105 \tabularnewline
27 & -0.311919 & -2.8417 & 0.002822 \tabularnewline
28 & -0.202844 & -1.848 & 0.034083 \tabularnewline
29 & 0.055781 & 0.5082 & 0.306335 \tabularnewline
30 & 0.271836 & 2.4765 & 0.007649 \tabularnewline
31 & 0.161796 & 1.474 & 0.072127 \tabularnewline
32 & -0.105763 & -0.9635 & 0.169036 \tabularnewline
33 & -0.234677 & -2.138 & 0.017729 \tabularnewline
34 & -0.292418 & -2.6641 & 0.004637 \tabularnewline
35 & 0.030083 & 0.2741 & 0.392356 \tabularnewline
36 & 0.510229 & 4.6484 & 6e-06 \tabularnewline
37 & 0.213932 & 1.949 & 0.027336 \tabularnewline
38 & -0.163947 & -1.4936 & 0.069533 \tabularnewline
39 & -0.227406 & -2.0718 & 0.020696 \tabularnewline
40 & -0.154678 & -1.4092 & 0.081259 \tabularnewline
41 & 0.04249 & 0.3871 & 0.349836 \tabularnewline
42 & 0.19606 & 1.7862 & 0.03886 \tabularnewline
43 & 0.151928 & 1.3841 & 0.085015 \tabularnewline
44 & -0.064877 & -0.5911 & 0.278045 \tabularnewline
45 & -0.162669 & -1.482 & 0.071066 \tabularnewline
46 & -0.225181 & -2.0515 & 0.021686 \tabularnewline
47 & 0.007221 & 0.0658 & 0.473854 \tabularnewline
48 & 0.358267 & 3.264 & 0.000798 \tabularnewline
\hline
\end{tabular}
%Source: https://freestatistics.org/blog/index.php?pk=282851&T=1

[TABLE]
[ROW][C]Autocorrelation Function[/C][/ROW]
[ROW][C]Time lag k[/C][C]ACF(k)[/C][C]T-STAT[/C][C]P-value[/C][/ROW]
[ROW][C]1[/C][C]0.226364[/C][C]2.0623[/C][C]0.021154[/C][/ROW]
[ROW][C]2[/C][C]-0.395447[/C][C]-3.6027[/C][C]0.000268[/C][/ROW]
[ROW][C]3[/C][C]-0.412086[/C][C]-3.7543[/C][C]0.000161[/C][/ROW]
[ROW][C]4[/C][C]-0.215442[/C][C]-1.9628[/C][C]0.026511[/C][/ROW]
[ROW][C]5[/C][C]0.174953[/C][C]1.5939[/C][C]0.05738[/C][/ROW]
[ROW][C]6[/C][C]0.388574[/C][C]3.5401[/C][C]0.000329[/C][/ROW]
[ROW][C]7[/C][C]0.2056[/C][C]1.8731[/C][C]0.032287[/C][/ROW]
[ROW][C]8[/C][C]-0.17356[/C][C]-1.5812[/C][C]0.058817[/C][/ROW]
[ROW][C]9[/C][C]-0.372588[/C][C]-3.3944[/C][C]0.000528[/C][/ROW]
[ROW][C]10[/C][C]-0.38274[/C][C]-3.4869[/C][C]0.000392[/C][/ROW]
[ROW][C]11[/C][C]0.155047[/C][C]1.4125[/C][C]0.080764[/C][/ROW]
[ROW][C]12[/C][C]0.782451[/C][C]7.1285[/C][C]0[/C][/ROW]
[ROW][C]13[/C][C]0.211485[/C][C]1.9267[/C][C]0.028718[/C][/ROW]
[ROW][C]14[/C][C]-0.338384[/C][C]-3.0828[/C][C]0.001392[/C][/ROW]
[ROW][C]15[/C][C]-0.373777[/C][C]-3.4053[/C][C]0.00051[/C][/ROW]
[ROW][C]16[/C][C]-0.206023[/C][C]-1.877[/C][C]0.032019[/C][/ROW]
[ROW][C]17[/C][C]0.133701[/C][C]1.2181[/C][C]0.113324[/C][/ROW]
[ROW][C]18[/C][C]0.283663[/C][C]2.5843[/C][C]0.005754[/C][/ROW]
[ROW][C]19[/C][C]0.163227[/C][C]1.4871[/C][C]0.070393[/C][/ROW]
[ROW][C]20[/C][C]-0.160994[/C][C]-1.4667[/C][C]0.073114[/C][/ROW]
[ROW][C]21[/C][C]-0.317178[/C][C]-2.8896[/C][C]0.00246[/C][/ROW]
[ROW][C]22[/C][C]-0.352945[/C][C]-3.2155[/C][C]0.000928[/C][/ROW]
[ROW][C]23[/C][C]0.081656[/C][C]0.7439[/C][C]0.229512[/C][/ROW]
[ROW][C]24[/C][C]0.643048[/C][C]5.8584[/C][C]0[/C][/ROW]
[ROW][C]25[/C][C]0.229179[/C][C]2.0879[/C][C]0.019935[/C][/ROW]
[ROW][C]26[/C][C]-0.258251[/C][C]-2.3528[/C][C]0.0105[/C][/ROW]
[ROW][C]27[/C][C]-0.311919[/C][C]-2.8417[/C][C]0.002822[/C][/ROW]
[ROW][C]28[/C][C]-0.202844[/C][C]-1.848[/C][C]0.034083[/C][/ROW]
[ROW][C]29[/C][C]0.055781[/C][C]0.5082[/C][C]0.306335[/C][/ROW]
[ROW][C]30[/C][C]0.271836[/C][C]2.4765[/C][C]0.007649[/C][/ROW]
[ROW][C]31[/C][C]0.161796[/C][C]1.474[/C][C]0.072127[/C][/ROW]
[ROW][C]32[/C][C]-0.105763[/C][C]-0.9635[/C][C]0.169036[/C][/ROW]
[ROW][C]33[/C][C]-0.234677[/C][C]-2.138[/C][C]0.017729[/C][/ROW]
[ROW][C]34[/C][C]-0.292418[/C][C]-2.6641[/C][C]0.004637[/C][/ROW]
[ROW][C]35[/C][C]0.030083[/C][C]0.2741[/C][C]0.392356[/C][/ROW]
[ROW][C]36[/C][C]0.510229[/C][C]4.6484[/C][C]6e-06[/C][/ROW]
[ROW][C]37[/C][C]0.213932[/C][C]1.949[/C][C]0.027336[/C][/ROW]
[ROW][C]38[/C][C]-0.163947[/C][C]-1.4936[/C][C]0.069533[/C][/ROW]
[ROW][C]39[/C][C]-0.227406[/C][C]-2.0718[/C][C]0.020696[/C][/ROW]
[ROW][C]40[/C][C]-0.154678[/C][C]-1.4092[/C][C]0.081259[/C][/ROW]
[ROW][C]41[/C][C]0.04249[/C][C]0.3871[/C][C]0.349836[/C][/ROW]
[ROW][C]42[/C][C]0.19606[/C][C]1.7862[/C][C]0.03886[/C][/ROW]
[ROW][C]43[/C][C]0.151928[/C][C]1.3841[/C][C]0.085015[/C][/ROW]
[ROW][C]44[/C][C]-0.064877[/C][C]-0.5911[/C][C]0.278045[/C][/ROW]
[ROW][C]45[/C][C]-0.162669[/C][C]-1.482[/C][C]0.071066[/C][/ROW]
[ROW][C]46[/C][C]-0.225181[/C][C]-2.0515[/C][C]0.021686[/C][/ROW]
[ROW][C]47[/C][C]0.007221[/C][C]0.0658[/C][C]0.473854[/C][/ROW]
[ROW][C]48[/C][C]0.358267[/C][C]3.264[/C][C]0.000798[/C][/ROW]
[/TABLE]
Source: https://freestatistics.org/blog/index.php?pk=282851&T=1

Globally Unique Identifier (entire table): ba.freestatistics.org/blog/index.php?pk=282851&T=1

As an alternative you can also use a QR Code:  

The GUIDs for individual cells are displayed in the table below:

Autocorrelation Function
Time lag kACF(k)T-STATP-value
10.2263642.06230.021154
2-0.395447-3.60270.000268
3-0.412086-3.75430.000161
4-0.215442-1.96280.026511
50.1749531.59390.05738
60.3885743.54010.000329
70.20561.87310.032287
8-0.17356-1.58120.058817
9-0.372588-3.39440.000528
10-0.38274-3.48690.000392
110.1550471.41250.080764
120.7824517.12850
130.2114851.92670.028718
14-0.338384-3.08280.001392
15-0.373777-3.40530.00051
16-0.206023-1.8770.032019
170.1337011.21810.113324
180.2836632.58430.005754
190.1632271.48710.070393
20-0.160994-1.46670.073114
21-0.317178-2.88960.00246
22-0.352945-3.21550.000928
230.0816560.74390.229512
240.6430485.85840
250.2291792.08790.019935
26-0.258251-2.35280.0105
27-0.311919-2.84170.002822
28-0.202844-1.8480.034083
290.0557810.50820.306335
300.2718362.47650.007649
310.1617961.4740.072127
32-0.105763-0.96350.169036
33-0.234677-2.1380.017729
34-0.292418-2.66410.004637
350.0300830.27410.392356
360.5102294.64846e-06
370.2139321.9490.027336
38-0.163947-1.49360.069533
39-0.227406-2.07180.020696
40-0.154678-1.40920.081259
410.042490.38710.349836
420.196061.78620.03886
430.1519281.38410.085015
44-0.064877-0.59110.278045
45-0.162669-1.4820.071066
46-0.225181-2.05150.021686
470.0072210.06580.473854
480.3582673.2640.000798


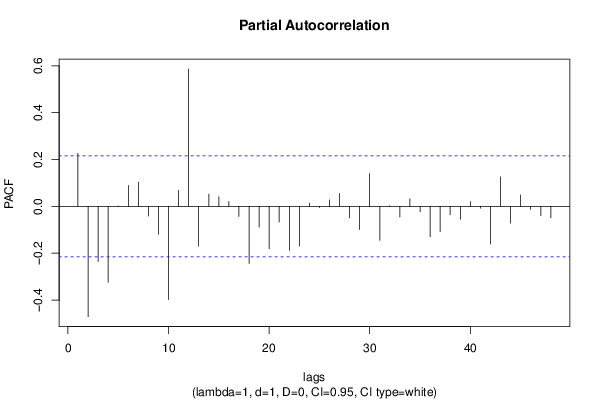
Partial Autocorrelation Function
Time lag kPACF(k)T-STATP-value
10.2263642.06230.021154
2-0.470813-4.28932.4e-05
3-0.235426-2.14480.017445
4-0.323734-2.94940.002068
50.0014910.01360.494597
60.0890320.81110.209809
70.1024560.93340.176657
8-0.041142-0.37480.354375
9-0.118956-1.08370.140808
10-0.397882-3.62490.000249
110.0680890.62030.268375
120.586735.34540
13-0.169809-1.5470.06283
140.0516190.47030.319697
150.0407930.37160.355554
160.0211250.19250.423926
17-0.042636-0.38840.349346
18-0.243888-2.22190.014505
19-0.088697-0.80810.210681
20-0.181-1.6490.051465
21-0.06696-0.610.271752
22-0.188387-1.71630.04492
23-0.169261-1.5420.063434
240.0139980.12750.449415
25-0.004716-0.0430.482916
260.0268990.24510.403507
270.0548750.49990.309221
28-0.048154-0.43870.331009
29-0.099067-0.90250.18469
300.140331.27850.102324
31-0.144374-1.31530.096014
320.0024540.02240.491107
33-0.045521-0.41470.339709
340.032620.29720.383535
35-0.022836-0.2080.417853
36-0.129787-1.18240.120209
37-0.107018-0.9750.166202
38-0.035664-0.32490.373032
39-0.054815-0.49940.309413
400.0202290.18430.427114
41-0.00756-0.06890.472628
42-0.160717-1.46420.073458
430.126041.14830.127077
44-0.071693-0.65320.25773
450.0480060.43740.331496
46-0.012528-0.11410.454701
47-0.040007-0.36450.358212
48-0.048968-0.44610.328337

\begin{tabular}{lllllllll}
\hline
Partial Autocorrelation Function \tabularnewline
Time lag k & PACF(k) & T-STAT & P-value \tabularnewline
1 & 0.226364 & 2.0623 & 0.021154 \tabularnewline
2 & -0.470813 & -4.2893 & 2.4e-05 \tabularnewline
3 & -0.235426 & -2.1448 & 0.017445 \tabularnewline
4 & -0.323734 & -2.9494 & 0.002068 \tabularnewline
5 & 0.001491 & 0.0136 & 0.494597 \tabularnewline
6 & 0.089032 & 0.8111 & 0.209809 \tabularnewline
7 & 0.102456 & 0.9334 & 0.176657 \tabularnewline
8 & -0.041142 & -0.3748 & 0.354375 \tabularnewline
9 & -0.118956 & -1.0837 & 0.140808 \tabularnewline
10 & -0.397882 & -3.6249 & 0.000249 \tabularnewline
11 & 0.068089 & 0.6203 & 0.268375 \tabularnewline
12 & 0.58673 & 5.3454 & 0 \tabularnewline
13 & -0.169809 & -1.547 & 0.06283 \tabularnewline
14 & 0.051619 & 0.4703 & 0.319697 \tabularnewline
15 & 0.040793 & 0.3716 & 0.355554 \tabularnewline
16 & 0.021125 & 0.1925 & 0.423926 \tabularnewline
17 & -0.042636 & -0.3884 & 0.349346 \tabularnewline
18 & -0.243888 & -2.2219 & 0.014505 \tabularnewline
19 & -0.088697 & -0.8081 & 0.210681 \tabularnewline
20 & -0.181 & -1.649 & 0.051465 \tabularnewline
21 & -0.06696 & -0.61 & 0.271752 \tabularnewline
22 & -0.188387 & -1.7163 & 0.04492 \tabularnewline
23 & -0.169261 & -1.542 & 0.063434 \tabularnewline
24 & 0.013998 & 0.1275 & 0.449415 \tabularnewline
25 & -0.004716 & -0.043 & 0.482916 \tabularnewline
26 & 0.026899 & 0.2451 & 0.403507 \tabularnewline
27 & 0.054875 & 0.4999 & 0.309221 \tabularnewline
28 & -0.048154 & -0.4387 & 0.331009 \tabularnewline
29 & -0.099067 & -0.9025 & 0.18469 \tabularnewline
30 & 0.14033 & 1.2785 & 0.102324 \tabularnewline
31 & -0.144374 & -1.3153 & 0.096014 \tabularnewline
32 & 0.002454 & 0.0224 & 0.491107 \tabularnewline
33 & -0.045521 & -0.4147 & 0.339709 \tabularnewline
34 & 0.03262 & 0.2972 & 0.383535 \tabularnewline
35 & -0.022836 & -0.208 & 0.417853 \tabularnewline
36 & -0.129787 & -1.1824 & 0.120209 \tabularnewline
37 & -0.107018 & -0.975 & 0.166202 \tabularnewline
38 & -0.035664 & -0.3249 & 0.373032 \tabularnewline
39 & -0.054815 & -0.4994 & 0.309413 \tabularnewline
40 & 0.020229 & 0.1843 & 0.427114 \tabularnewline
41 & -0.00756 & -0.0689 & 0.472628 \tabularnewline
42 & -0.160717 & -1.4642 & 0.073458 \tabularnewline
43 & 0.12604 & 1.1483 & 0.127077 \tabularnewline
44 & -0.071693 & -0.6532 & 0.25773 \tabularnewline
45 & 0.048006 & 0.4374 & 0.331496 \tabularnewline
46 & -0.012528 & -0.1141 & 0.454701 \tabularnewline
47 & -0.040007 & -0.3645 & 0.358212 \tabularnewline
48 & -0.048968 & -0.4461 & 0.328337 \tabularnewline
\hline
\end{tabular}
%Source: https://freestatistics.org/blog/index.php?pk=282851&T=2

[TABLE]
[ROW][C]Partial Autocorrelation Function[/C][/ROW]
[ROW][C]Time lag k[/C][C]PACF(k)[/C][C]T-STAT[/C][C]P-value[/C][/ROW]
[ROW][C]1[/C][C]0.226364[/C][C]2.0623[/C][C]0.021154[/C][/ROW]
[ROW][C]2[/C][C]-0.470813[/C][C]-4.2893[/C][C]2.4e-05[/C][/ROW]
[ROW][C]3[/C][C]-0.235426[/C][C]-2.1448[/C][C]0.017445[/C][/ROW]
[ROW][C]4[/C][C]-0.323734[/C][C]-2.9494[/C][C]0.002068[/C][/ROW]
[ROW][C]5[/C][C]0.001491[/C][C]0.0136[/C][C]0.494597[/C][/ROW]
[ROW][C]6[/C][C]0.089032[/C][C]0.8111[/C][C]0.209809[/C][/ROW]
[ROW][C]7[/C][C]0.102456[/C][C]0.9334[/C][C]0.176657[/C][/ROW]
[ROW][C]8[/C][C]-0.041142[/C][C]-0.3748[/C][C]0.354375[/C][/ROW]
[ROW][C]9[/C][C]-0.118956[/C][C]-1.0837[/C][C]0.140808[/C][/ROW]
[ROW][C]10[/C][C]-0.397882[/C][C]-3.6249[/C][C]0.000249[/C][/ROW]
[ROW][C]11[/C][C]0.068089[/C][C]0.6203[/C][C]0.268375[/C][/ROW]
[ROW][C]12[/C][C]0.58673[/C][C]5.3454[/C][C]0[/C][/ROW]
[ROW][C]13[/C][C]-0.169809[/C][C]-1.547[/C][C]0.06283[/C][/ROW]
[ROW][C]14[/C][C]0.051619[/C][C]0.4703[/C][C]0.319697[/C][/ROW]
[ROW][C]15[/C][C]0.040793[/C][C]0.3716[/C][C]0.355554[/C][/ROW]
[ROW][C]16[/C][C]0.021125[/C][C]0.1925[/C][C]0.423926[/C][/ROW]
[ROW][C]17[/C][C]-0.042636[/C][C]-0.3884[/C][C]0.349346[/C][/ROW]
[ROW][C]18[/C][C]-0.243888[/C][C]-2.2219[/C][C]0.014505[/C][/ROW]
[ROW][C]19[/C][C]-0.088697[/C][C]-0.8081[/C][C]0.210681[/C][/ROW]
[ROW][C]20[/C][C]-0.181[/C][C]-1.649[/C][C]0.051465[/C][/ROW]
[ROW][C]21[/C][C]-0.06696[/C][C]-0.61[/C][C]0.271752[/C][/ROW]
[ROW][C]22[/C][C]-0.188387[/C][C]-1.7163[/C][C]0.04492[/C][/ROW]
[ROW][C]23[/C][C]-0.169261[/C][C]-1.542[/C][C]0.063434[/C][/ROW]
[ROW][C]24[/C][C]0.013998[/C][C]0.1275[/C][C]0.449415[/C][/ROW]
[ROW][C]25[/C][C]-0.004716[/C][C]-0.043[/C][C]0.482916[/C][/ROW]
[ROW][C]26[/C][C]0.026899[/C][C]0.2451[/C][C]0.403507[/C][/ROW]
[ROW][C]27[/C][C]0.054875[/C][C]0.4999[/C][C]0.309221[/C][/ROW]
[ROW][C]28[/C][C]-0.048154[/C][C]-0.4387[/C][C]0.331009[/C][/ROW]
[ROW][C]29[/C][C]-0.099067[/C][C]-0.9025[/C][C]0.18469[/C][/ROW]
[ROW][C]30[/C][C]0.14033[/C][C]1.2785[/C][C]0.102324[/C][/ROW]
[ROW][C]31[/C][C]-0.144374[/C][C]-1.3153[/C][C]0.096014[/C][/ROW]
[ROW][C]32[/C][C]0.002454[/C][C]0.0224[/C][C]0.491107[/C][/ROW]
[ROW][C]33[/C][C]-0.045521[/C][C]-0.4147[/C][C]0.339709[/C][/ROW]
[ROW][C]34[/C][C]0.03262[/C][C]0.2972[/C][C]0.383535[/C][/ROW]
[ROW][C]35[/C][C]-0.022836[/C][C]-0.208[/C][C]0.417853[/C][/ROW]
[ROW][C]36[/C][C]-0.129787[/C][C]-1.1824[/C][C]0.120209[/C][/ROW]
[ROW][C]37[/C][C]-0.107018[/C][C]-0.975[/C][C]0.166202[/C][/ROW]
[ROW][C]38[/C][C]-0.035664[/C][C]-0.3249[/C][C]0.373032[/C][/ROW]
[ROW][C]39[/C][C]-0.054815[/C][C]-0.4994[/C][C]0.309413[/C][/ROW]
[ROW][C]40[/C][C]0.020229[/C][C]0.1843[/C][C]0.427114[/C][/ROW]
[ROW][C]41[/C][C]-0.00756[/C][C]-0.0689[/C][C]0.472628[/C][/ROW]
[ROW][C]42[/C][C]-0.160717[/C][C]-1.4642[/C][C]0.073458[/C][/ROW]
[ROW][C]43[/C][C]0.12604[/C][C]1.1483[/C][C]0.127077[/C][/ROW]
[ROW][C]44[/C][C]-0.071693[/C][C]-0.6532[/C][C]0.25773[/C][/ROW]
[ROW][C]45[/C][C]0.048006[/C][C]0.4374[/C][C]0.331496[/C][/ROW]
[ROW][C]46[/C][C]-0.012528[/C][C]-0.1141[/C][C]0.454701[/C][/ROW]
[ROW][C]47[/C][C]-0.040007[/C][C]-0.3645[/C][C]0.358212[/C][/ROW]
[ROW][C]48[/C][C]-0.048968[/C][C]-0.4461[/C][C]0.328337[/C][/ROW]
[/TABLE]
Source: https://freestatistics.org/blog/index.php?pk=282851&T=2

Globally Unique Identifier (entire table): ba.freestatistics.org/blog/index.php?pk=282851&T=2

As an alternative you can also use a QR Code:  

The GUIDs for individual cells are displayed in the table below:

Partial Autocorrelation Function
Time lag kPACF(k)T-STATP-value
10.2263642.06230.021154
2-0.470813-4.28932.4e-05
3-0.235426-2.14480.017445
4-0.323734-2.94940.002068
50.0014910.01360.494597
60.0890320.81110.209809
70.1024560.93340.176657
8-0.041142-0.37480.354375
9-0.118956-1.08370.140808
10-0.397882-3.62490.000249
110.0680890.62030.268375
120.586735.34540
13-0.169809-1.5470.06283
140.0516190.47030.319697
150.0407930.37160.355554
160.0211250.19250.423926
17-0.042636-0.38840.349346
18-0.243888-2.22190.014505
19-0.088697-0.80810.210681
20-0.181-1.6490.051465
21-0.06696-0.610.271752
22-0.188387-1.71630.04492
23-0.169261-1.5420.063434
240.0139980.12750.449415
25-0.004716-0.0430.482916
260.0268990.24510.403507
270.0548750.49990.309221
28-0.048154-0.43870.331009
29-0.099067-0.90250.18469
300.140331.27850.102324
31-0.144374-1.31530.096014
320.0024540.02240.491107
33-0.045521-0.41470.339709
340.032620.29720.383535
35-0.022836-0.2080.417853
36-0.129787-1.18240.120209
37-0.107018-0.9750.166202
38-0.035664-0.32490.373032
39-0.054815-0.49940.309413
400.0202290.18430.427114
41-0.00756-0.06890.472628
42-0.160717-1.46420.073458
430.126041.14830.127077
44-0.071693-0.65320.25773
450.0480060.43740.331496
46-0.012528-0.11410.454701
47-0.040007-0.36450.358212
48-0.048968-0.44610.328337


Parameters (Session):
par1 = 48 ; par2 = 1 ; par3 = 1 ; par4 = 0 ; par5 = 12 ; par6 = White Noise ; par7 = 0.95 ;
Parameters (R input):
par1 = 48 ; par2 = 1 ; par3 = 1 ; par4 = 0 ; par5 = 12 ; par6 = White Noise ; par7 = 0.95 ; par8 = ;
R code (references can be found in the software module):
if (par1 == 'Default') {
par1 = 10*log10(length(x))
} else {
par1 <- as.numeric(par1)
}
par2 <- as.numeric(par2)
par3 <- as.numeric(par3)
par4 <- as.numeric(par4)
par5 <- as.numeric(par5)
if (par6 == 'White Noise') par6 <- 'white' else par6 <- 'ma'
par7 <- as.numeric(par7)
if (par8 != '') par8 <- as.numeric(par8)
ox <- x
if (par8 == '') {
if (par2 == 0) {
x <- log(x)
} else {
x <- (x ^ par2 - 1) / par2
}
} else {
x <- log(x,base=par8)
}
if (par3 > 0) x <- diff(x,lag=1,difference=par3)
if (par4 > 0) x <- diff(x,lag=par5,difference=par4)
bitmap(file='picts.png')
op <- par(mfrow=c(2,1))
plot(ox,type='l',main='Original Time Series',xlab='time',ylab='value')
if (par8=='') {
mytitle <- paste('Working Time Series (lambda=',par2,', d=',par3,', D=',par4,')',sep='')
mysub <- paste('(lambda=',par2,', d=',par3,', D=',par4,', CI=', par7, ', CI type=',par6,')',sep='')
} else {
mytitle <- paste('Working Time Series (base=',par8,', d=',par3,', D=',par4,')',sep='')
mysub <- paste('(base=',par8,', d=',par3,', D=',par4,', CI=', par7, ', CI type=',par6,')',sep='')
}
plot(x,type='l', main=mytitle,xlab='time',ylab='value')
par(op)
dev.off()
bitmap(file='pic1.png')
racf <- acf(x, par1, main='Autocorrelation', xlab='time lag', ylab='ACF', ci.type=par6, ci=par7, sub=mysub)
dev.off()
bitmap(file='pic2.png')
rpacf <- pacf(x,par1,main='Partial Autocorrelation',xlab='lags',ylab='PACF',sub=mysub)
dev.off()
(myacf <- c(racf$acf))
(mypacf <- c(rpacf$acf))
lengthx <- length(x)
sqrtn <- sqrt(lengthx)
load(file='createtable')
a<-table.start()
a<-table.row.start(a)
a<-table.element(a,'Autocorrelation Function',4,TRUE)
a<-table.row.end(a)
a<-table.row.start(a)
a<-table.element(a,'Time lag k',header=TRUE)
a<-table.element(a,hyperlink('basics.htm','ACF(k)','click here for more information about the Autocorrelation Function'),header=TRUE)
a<-table.element(a,'T-STAT',header=TRUE)
a<-table.element(a,'P-value',header=TRUE)
a<-table.row.end(a)
for (i in 2:(par1+1)) {
a<-table.row.start(a)
a<-table.element(a,i-1,header=TRUE)
a<-table.element(a,round(myacf[i],6))
mytstat <- myacf[i]*sqrtn
a<-table.element(a,round(mytstat,4))
a<-table.element(a,round(1-pt(abs(mytstat),lengthx),6))
a<-table.row.end(a)
}
a<-table.end(a)
table.save(a,file='mytable.tab')
a<-table.start()
a<-table.row.start(a)
a<-table.element(a,'Partial Autocorrelation Function',4,TRUE)
a<-table.row.end(a)
a<-table.row.start(a)
a<-table.element(a,'Time lag k',header=TRUE)
a<-table.element(a,hyperlink('basics.htm','PACF(k)','click here for more information about the Partial Autocorrelation Function'),header=TRUE)
a<-table.element(a,'T-STAT',header=TRUE)
a<-table.element(a,'P-value',header=TRUE)
a<-table.row.end(a)
for (i in 1:par1) {
a<-table.row.start(a)
a<-table.element(a,i,header=TRUE)
a<-table.element(a,round(mypacf[i],6))
mytstat <- mypacf[i]*sqrtn
a<-table.element(a,round(mytstat,4))
a<-table.element(a,round(1-pt(abs(mytstat),lengthx),6))
a<-table.row.end(a)
}
a<-table.end(a)
table.save(a,file='mytable1.tab')