Free Statistics

of Irreproducible Research!

Author's title

Author*Unverified author*
R Software Modulerwasp_autocorrelation.wasp
Title produced by software(Partial) Autocorrelation Function
Date of computationFri, 23 Oct 2015 10:15:04 +0100
Cite this page as followsStatistical Computations at FreeStatistics.org, Office for Research Development and Education, URL https://freestatistics.org/blog/index.php?v=date/2015/Oct/23/t1445591764emcx2hkd1tg8jlm.htm/, Retrieved Tue, 14 May 2024 21:34:34 +0000
Statistical Computations at FreeStatistics.org, Office for Research Development and Education, URL https://freestatistics.org/blog/index.php?pk=282856, Retrieved Tue, 14 May 2024 21:34:34 +0000
QR Codes:

Original text written by user:
IsPrivate?No (this computation is public)
User-defined keywords
Estimated Impact77
Family? (F = Feedback message, R = changed R code, M = changed R Module, P = changed Parameters, D = changed Data)
-       [(Partial) Autocorrelation Function] [Aantal niet-werke...] [2015-10-23 09:15:04] [f442d180d44854b5d66611a6a05f7502] [Current]
Feedback Forum

Post a new message
Dataseries X:
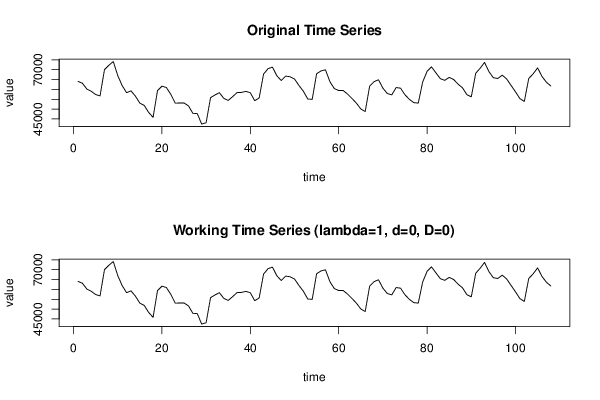
64076
63136
60198
59057
57388
56708
70019
72263
74152
67057
61941
58331
59252
56568
53031
51840
48290
45817
59421
61621
60976
57497
53037
53088
53119
51644
47866
47691
42401
43069
55797
57170
58335
55439
54399
56316
58381
58468
59025
58298
54255
55670
67816
70485
71361
66953
64505
66770
66418
65277
62008
59096
55106
54954
67943
69411
69951
63966
60410
59440
59445
57614
55396
53030
50090
48764
61658
63943
64878
60634
57905
57224
60953
60621
57258
54903
53278
53042
63753
69210
71446
68408
65427
64630
66086
65058
62689
60841
57346
56222
68202
70745
73690
68992
65925
65546
67221
65315
62038
58774
55320
53900
65544
67906
70911
66544
63657
61720


Summary of computational transaction
Raw Inputview raw input (R code)
Raw Outputview raw output of R engine
Computing time2 seconds
R Server'Gwilym Jenkins' @ jenkins.wessa.net

\begin{tabular}{lllllllll}
\hline
Summary of computational transaction \tabularnewline
Raw Input & view raw input (R code)  \tabularnewline
Raw Output & view raw output of R engine  \tabularnewline
Computing time & 2 seconds \tabularnewline
R Server & 'Gwilym Jenkins' @ jenkins.wessa.net \tabularnewline
\hline
\end{tabular}
%Source: https://freestatistics.org/blog/index.php?pk=282856&T=0

[TABLE]
[ROW][C]Summary of computational transaction[/C][/ROW]
[ROW][C]Raw Input[/C][C]view raw input (R code) [/C][/ROW]
[ROW][C]Raw Output[/C][C]view raw output of R engine [/C][/ROW]
[ROW][C]Computing time[/C][C]2 seconds[/C][/ROW]
[ROW][C]R Server[/C][C]'Gwilym Jenkins' @ jenkins.wessa.net[/C][/ROW]
[/TABLE]
Source: https://freestatistics.org/blog/index.php?pk=282856&T=0

Globally Unique Identifier (entire table): ba.freestatistics.org/blog/index.php?pk=282856&T=0

As an alternative you can also use a QR Code:  

The GUIDs for individual cells are displayed in the table below:

Summary of computational transaction
Raw Inputview raw input (R code)
Raw Outputview raw output of R engine
Computing time2 seconds
R Server'Gwilym Jenkins' @ jenkins.wessa.net


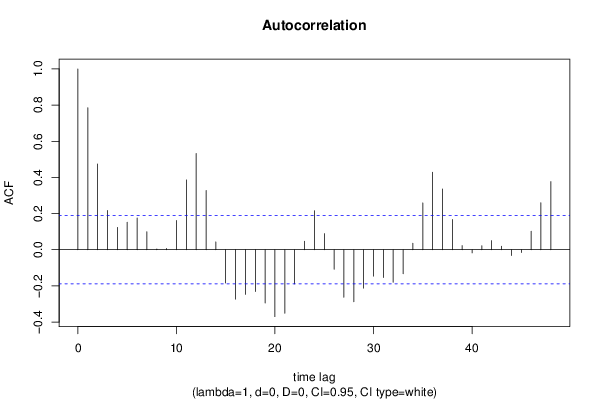
Autocorrelation Function
Time lag kACF(k)T-STATP-value
10.7851738.15980
20.4740834.92682e-06
30.2174542.25990.012918
40.1235591.28410.100935
50.1519951.57960.058564
60.1760621.82970.035028
70.0992721.03170.152266
80.0039840.04140.483527
90.0071210.0740.470572
100.1614151.67750.048171
110.3863154.01475.5e-05
120.5323195.5320
130.3276223.40470.000465
140.0433790.45080.326517
15-0.184419-1.91650.02897
16-0.273406-2.84130.002686
17-0.246948-2.56640.005824
18-0.231007-2.40070.009037
19-0.294601-3.06160.001389
20-0.370121-3.84640.000102
21-0.351314-3.6510.000202
22-0.188868-1.96280.026122
230.0469710.48810.313222
240.2156192.24080.013543
250.089020.92510.178482
26-0.108402-1.12650.131217
27-0.263248-2.73570.003639
28-0.288132-2.99440.001705
29-0.21224-2.20570.014763
30-0.145868-1.51590.066233
31-0.1538-1.59830.056445
32-0.17955-1.86590.032382
33-0.132443-1.37640.085775
340.0361480.37570.353953
350.2590632.69230.004114
360.4284074.45211e-05
370.3356683.48840.000352
380.1671241.73680.042637
390.0227520.23640.406766
40-0.017573-0.18260.427718
410.0218540.22710.410381
420.0506790.52670.299752
430.0189630.19710.422073
44-0.031517-0.32750.371947
45-0.015211-0.15810.437346
460.1019521.05950.145865
470.2598212.70010.004024
480.376733.91517.9e-05

\begin{tabular}{lllllllll}
\hline
Autocorrelation Function \tabularnewline
Time lag k & ACF(k) & T-STAT & P-value \tabularnewline
1 & 0.785173 & 8.1598 & 0 \tabularnewline
2 & 0.474083 & 4.9268 & 2e-06 \tabularnewline
3 & 0.217454 & 2.2599 & 0.012918 \tabularnewline
4 & 0.123559 & 1.2841 & 0.100935 \tabularnewline
5 & 0.151995 & 1.5796 & 0.058564 \tabularnewline
6 & 0.176062 & 1.8297 & 0.035028 \tabularnewline
7 & 0.099272 & 1.0317 & 0.152266 \tabularnewline
8 & 0.003984 & 0.0414 & 0.483527 \tabularnewline
9 & 0.007121 & 0.074 & 0.470572 \tabularnewline
10 & 0.161415 & 1.6775 & 0.048171 \tabularnewline
11 & 0.386315 & 4.0147 & 5.5e-05 \tabularnewline
12 & 0.532319 & 5.532 & 0 \tabularnewline
13 & 0.327622 & 3.4047 & 0.000465 \tabularnewline
14 & 0.043379 & 0.4508 & 0.326517 \tabularnewline
15 & -0.184419 & -1.9165 & 0.02897 \tabularnewline
16 & -0.273406 & -2.8413 & 0.002686 \tabularnewline
17 & -0.246948 & -2.5664 & 0.005824 \tabularnewline
18 & -0.231007 & -2.4007 & 0.009037 \tabularnewline
19 & -0.294601 & -3.0616 & 0.001389 \tabularnewline
20 & -0.370121 & -3.8464 & 0.000102 \tabularnewline
21 & -0.351314 & -3.651 & 0.000202 \tabularnewline
22 & -0.188868 & -1.9628 & 0.026122 \tabularnewline
23 & 0.046971 & 0.4881 & 0.313222 \tabularnewline
24 & 0.215619 & 2.2408 & 0.013543 \tabularnewline
25 & 0.08902 & 0.9251 & 0.178482 \tabularnewline
26 & -0.108402 & -1.1265 & 0.131217 \tabularnewline
27 & -0.263248 & -2.7357 & 0.003639 \tabularnewline
28 & -0.288132 & -2.9944 & 0.001705 \tabularnewline
29 & -0.21224 & -2.2057 & 0.014763 \tabularnewline
30 & -0.145868 & -1.5159 & 0.066233 \tabularnewline
31 & -0.1538 & -1.5983 & 0.056445 \tabularnewline
32 & -0.17955 & -1.8659 & 0.032382 \tabularnewline
33 & -0.132443 & -1.3764 & 0.085775 \tabularnewline
34 & 0.036148 & 0.3757 & 0.353953 \tabularnewline
35 & 0.259063 & 2.6923 & 0.004114 \tabularnewline
36 & 0.428407 & 4.4521 & 1e-05 \tabularnewline
37 & 0.335668 & 3.4884 & 0.000352 \tabularnewline
38 & 0.167124 & 1.7368 & 0.042637 \tabularnewline
39 & 0.022752 & 0.2364 & 0.406766 \tabularnewline
40 & -0.017573 & -0.1826 & 0.427718 \tabularnewline
41 & 0.021854 & 0.2271 & 0.410381 \tabularnewline
42 & 0.050679 & 0.5267 & 0.299752 \tabularnewline
43 & 0.018963 & 0.1971 & 0.422073 \tabularnewline
44 & -0.031517 & -0.3275 & 0.371947 \tabularnewline
45 & -0.015211 & -0.1581 & 0.437346 \tabularnewline
46 & 0.101952 & 1.0595 & 0.145865 \tabularnewline
47 & 0.259821 & 2.7001 & 0.004024 \tabularnewline
48 & 0.37673 & 3.9151 & 7.9e-05 \tabularnewline
\hline
\end{tabular}
%Source: https://freestatistics.org/blog/index.php?pk=282856&T=1

[TABLE]
[ROW][C]Autocorrelation Function[/C][/ROW]
[ROW][C]Time lag k[/C][C]ACF(k)[/C][C]T-STAT[/C][C]P-value[/C][/ROW]
[ROW][C]1[/C][C]0.785173[/C][C]8.1598[/C][C]0[/C][/ROW]
[ROW][C]2[/C][C]0.474083[/C][C]4.9268[/C][C]2e-06[/C][/ROW]
[ROW][C]3[/C][C]0.217454[/C][C]2.2599[/C][C]0.012918[/C][/ROW]
[ROW][C]4[/C][C]0.123559[/C][C]1.2841[/C][C]0.100935[/C][/ROW]
[ROW][C]5[/C][C]0.151995[/C][C]1.5796[/C][C]0.058564[/C][/ROW]
[ROW][C]6[/C][C]0.176062[/C][C]1.8297[/C][C]0.035028[/C][/ROW]
[ROW][C]7[/C][C]0.099272[/C][C]1.0317[/C][C]0.152266[/C][/ROW]
[ROW][C]8[/C][C]0.003984[/C][C]0.0414[/C][C]0.483527[/C][/ROW]
[ROW][C]9[/C][C]0.007121[/C][C]0.074[/C][C]0.470572[/C][/ROW]
[ROW][C]10[/C][C]0.161415[/C][C]1.6775[/C][C]0.048171[/C][/ROW]
[ROW][C]11[/C][C]0.386315[/C][C]4.0147[/C][C]5.5e-05[/C][/ROW]
[ROW][C]12[/C][C]0.532319[/C][C]5.532[/C][C]0[/C][/ROW]
[ROW][C]13[/C][C]0.327622[/C][C]3.4047[/C][C]0.000465[/C][/ROW]
[ROW][C]14[/C][C]0.043379[/C][C]0.4508[/C][C]0.326517[/C][/ROW]
[ROW][C]15[/C][C]-0.184419[/C][C]-1.9165[/C][C]0.02897[/C][/ROW]
[ROW][C]16[/C][C]-0.273406[/C][C]-2.8413[/C][C]0.002686[/C][/ROW]
[ROW][C]17[/C][C]-0.246948[/C][C]-2.5664[/C][C]0.005824[/C][/ROW]
[ROW][C]18[/C][C]-0.231007[/C][C]-2.4007[/C][C]0.009037[/C][/ROW]
[ROW][C]19[/C][C]-0.294601[/C][C]-3.0616[/C][C]0.001389[/C][/ROW]
[ROW][C]20[/C][C]-0.370121[/C][C]-3.8464[/C][C]0.000102[/C][/ROW]
[ROW][C]21[/C][C]-0.351314[/C][C]-3.651[/C][C]0.000202[/C][/ROW]
[ROW][C]22[/C][C]-0.188868[/C][C]-1.9628[/C][C]0.026122[/C][/ROW]
[ROW][C]23[/C][C]0.046971[/C][C]0.4881[/C][C]0.313222[/C][/ROW]
[ROW][C]24[/C][C]0.215619[/C][C]2.2408[/C][C]0.013543[/C][/ROW]
[ROW][C]25[/C][C]0.08902[/C][C]0.9251[/C][C]0.178482[/C][/ROW]
[ROW][C]26[/C][C]-0.108402[/C][C]-1.1265[/C][C]0.131217[/C][/ROW]
[ROW][C]27[/C][C]-0.263248[/C][C]-2.7357[/C][C]0.003639[/C][/ROW]
[ROW][C]28[/C][C]-0.288132[/C][C]-2.9944[/C][C]0.001705[/C][/ROW]
[ROW][C]29[/C][C]-0.21224[/C][C]-2.2057[/C][C]0.014763[/C][/ROW]
[ROW][C]30[/C][C]-0.145868[/C][C]-1.5159[/C][C]0.066233[/C][/ROW]
[ROW][C]31[/C][C]-0.1538[/C][C]-1.5983[/C][C]0.056445[/C][/ROW]
[ROW][C]32[/C][C]-0.17955[/C][C]-1.8659[/C][C]0.032382[/C][/ROW]
[ROW][C]33[/C][C]-0.132443[/C][C]-1.3764[/C][C]0.085775[/C][/ROW]
[ROW][C]34[/C][C]0.036148[/C][C]0.3757[/C][C]0.353953[/C][/ROW]
[ROW][C]35[/C][C]0.259063[/C][C]2.6923[/C][C]0.004114[/C][/ROW]
[ROW][C]36[/C][C]0.428407[/C][C]4.4521[/C][C]1e-05[/C][/ROW]
[ROW][C]37[/C][C]0.335668[/C][C]3.4884[/C][C]0.000352[/C][/ROW]
[ROW][C]38[/C][C]0.167124[/C][C]1.7368[/C][C]0.042637[/C][/ROW]
[ROW][C]39[/C][C]0.022752[/C][C]0.2364[/C][C]0.406766[/C][/ROW]
[ROW][C]40[/C][C]-0.017573[/C][C]-0.1826[/C][C]0.427718[/C][/ROW]
[ROW][C]41[/C][C]0.021854[/C][C]0.2271[/C][C]0.410381[/C][/ROW]
[ROW][C]42[/C][C]0.050679[/C][C]0.5267[/C][C]0.299752[/C][/ROW]
[ROW][C]43[/C][C]0.018963[/C][C]0.1971[/C][C]0.422073[/C][/ROW]
[ROW][C]44[/C][C]-0.031517[/C][C]-0.3275[/C][C]0.371947[/C][/ROW]
[ROW][C]45[/C][C]-0.015211[/C][C]-0.1581[/C][C]0.437346[/C][/ROW]
[ROW][C]46[/C][C]0.101952[/C][C]1.0595[/C][C]0.145865[/C][/ROW]
[ROW][C]47[/C][C]0.259821[/C][C]2.7001[/C][C]0.004024[/C][/ROW]
[ROW][C]48[/C][C]0.37673[/C][C]3.9151[/C][C]7.9e-05[/C][/ROW]
[/TABLE]
Source: https://freestatistics.org/blog/index.php?pk=282856&T=1

Globally Unique Identifier (entire table): ba.freestatistics.org/blog/index.php?pk=282856&T=1

As an alternative you can also use a QR Code:  

The GUIDs for individual cells are displayed in the table below:

Autocorrelation Function
Time lag kACF(k)T-STATP-value
10.7851738.15980
20.4740834.92682e-06
30.2174542.25990.012918
40.1235591.28410.100935
50.1519951.57960.058564
60.1760621.82970.035028
70.0992721.03170.152266
80.0039840.04140.483527
90.0071210.0740.470572
100.1614151.67750.048171
110.3863154.01475.5e-05
120.5323195.5320
130.3276223.40470.000465
140.0433790.45080.326517
15-0.184419-1.91650.02897
16-0.273406-2.84130.002686
17-0.246948-2.56640.005824
18-0.231007-2.40070.009037
19-0.294601-3.06160.001389
20-0.370121-3.84640.000102
21-0.351314-3.6510.000202
22-0.188868-1.96280.026122
230.0469710.48810.313222
240.2156192.24080.013543
250.089020.92510.178482
26-0.108402-1.12650.131217
27-0.263248-2.73570.003639
28-0.288132-2.99440.001705
29-0.21224-2.20570.014763
30-0.145868-1.51590.066233
31-0.1538-1.59830.056445
32-0.17955-1.86590.032382
33-0.132443-1.37640.085775
340.0361480.37570.353953
350.2590632.69230.004114
360.4284074.45211e-05
370.3356683.48840.000352
380.1671241.73680.042637
390.0227520.23640.406766
40-0.017573-0.18260.427718
410.0218540.22710.410381
420.0506790.52670.299752
430.0189630.19710.422073
44-0.031517-0.32750.371947
45-0.015211-0.15810.437346
460.1019521.05950.145865
470.2598212.70010.004024
480.376733.91517.9e-05


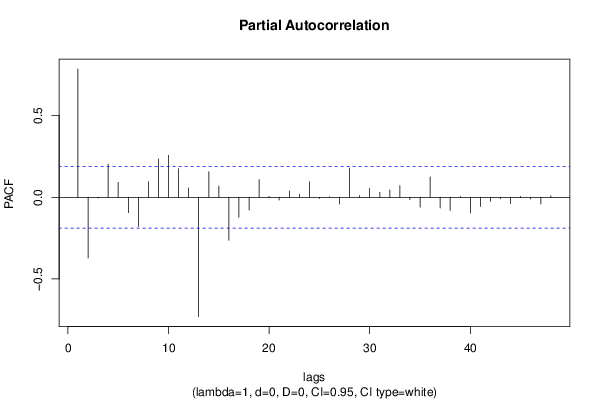
Partial Autocorrelation Function
Time lag kPACF(k)T-STATP-value
10.7851738.15980
2-0.37135-3.85929.7e-05
3-0.004351-0.04520.48201
40.2026922.10640.018741
50.0909790.94550.173261
6-0.094236-0.97930.164803
7-0.178809-1.85820.032929
80.0953640.99110.161937
90.2340392.43220.008325
100.2566712.66740.00441
110.1750771.81950.035806
120.0565740.58790.278901
13-0.730584-7.59250
140.1563341.62470.053574
150.0683060.70990.23966
16-0.262767-2.73080.003691
17-0.122531-1.27340.102808
18-0.077749-0.8080.210436
190.1079991.12240.1321
200.0056250.05850.476748
21-0.01697-0.17640.430171
220.038880.40410.343485
230.0178330.18530.42666
240.0947210.98440.163566
25-0.00714-0.07420.470495
260.0030580.03180.487355
27-0.041733-0.43370.332686
280.1790371.86060.03276
290.0099520.10340.45891
300.0538610.55970.288408
310.0309850.3220.374034
320.0448040.46560.321215
330.0708140.73590.231686
34-0.014914-0.1550.43856
35-0.060272-0.62640.266199
360.124021.28890.100101
37-0.065965-0.68550.247239
38-0.080667-0.83830.201852
390.0043670.04540.481943
40-0.095406-0.99150.161833
41-0.056124-0.58330.280469
42-0.025359-0.26350.396319
43-0.009423-0.09790.461087
44-0.039238-0.40780.342124
450.0055180.05730.477189
46-0.010165-0.10560.458032
47-0.041091-0.4270.335105
480.0084320.08760.465168

\begin{tabular}{lllllllll}
\hline
Partial Autocorrelation Function \tabularnewline
Time lag k & PACF(k) & T-STAT & P-value \tabularnewline
1 & 0.785173 & 8.1598 & 0 \tabularnewline
2 & -0.37135 & -3.8592 & 9.7e-05 \tabularnewline
3 & -0.004351 & -0.0452 & 0.48201 \tabularnewline
4 & 0.202692 & 2.1064 & 0.018741 \tabularnewline
5 & 0.090979 & 0.9455 & 0.173261 \tabularnewline
6 & -0.094236 & -0.9793 & 0.164803 \tabularnewline
7 & -0.178809 & -1.8582 & 0.032929 \tabularnewline
8 & 0.095364 & 0.9911 & 0.161937 \tabularnewline
9 & 0.234039 & 2.4322 & 0.008325 \tabularnewline
10 & 0.256671 & 2.6674 & 0.00441 \tabularnewline
11 & 0.175077 & 1.8195 & 0.035806 \tabularnewline
12 & 0.056574 & 0.5879 & 0.278901 \tabularnewline
13 & -0.730584 & -7.5925 & 0 \tabularnewline
14 & 0.156334 & 1.6247 & 0.053574 \tabularnewline
15 & 0.068306 & 0.7099 & 0.23966 \tabularnewline
16 & -0.262767 & -2.7308 & 0.003691 \tabularnewline
17 & -0.122531 & -1.2734 & 0.102808 \tabularnewline
18 & -0.077749 & -0.808 & 0.210436 \tabularnewline
19 & 0.107999 & 1.1224 & 0.1321 \tabularnewline
20 & 0.005625 & 0.0585 & 0.476748 \tabularnewline
21 & -0.01697 & -0.1764 & 0.430171 \tabularnewline
22 & 0.03888 & 0.4041 & 0.343485 \tabularnewline
23 & 0.017833 & 0.1853 & 0.42666 \tabularnewline
24 & 0.094721 & 0.9844 & 0.163566 \tabularnewline
25 & -0.00714 & -0.0742 & 0.470495 \tabularnewline
26 & 0.003058 & 0.0318 & 0.487355 \tabularnewline
27 & -0.041733 & -0.4337 & 0.332686 \tabularnewline
28 & 0.179037 & 1.8606 & 0.03276 \tabularnewline
29 & 0.009952 & 0.1034 & 0.45891 \tabularnewline
30 & 0.053861 & 0.5597 & 0.288408 \tabularnewline
31 & 0.030985 & 0.322 & 0.374034 \tabularnewline
32 & 0.044804 & 0.4656 & 0.321215 \tabularnewline
33 & 0.070814 & 0.7359 & 0.231686 \tabularnewline
34 & -0.014914 & -0.155 & 0.43856 \tabularnewline
35 & -0.060272 & -0.6264 & 0.266199 \tabularnewline
36 & 0.12402 & 1.2889 & 0.100101 \tabularnewline
37 & -0.065965 & -0.6855 & 0.247239 \tabularnewline
38 & -0.080667 & -0.8383 & 0.201852 \tabularnewline
39 & 0.004367 & 0.0454 & 0.481943 \tabularnewline
40 & -0.095406 & -0.9915 & 0.161833 \tabularnewline
41 & -0.056124 & -0.5833 & 0.280469 \tabularnewline
42 & -0.025359 & -0.2635 & 0.396319 \tabularnewline
43 & -0.009423 & -0.0979 & 0.461087 \tabularnewline
44 & -0.039238 & -0.4078 & 0.342124 \tabularnewline
45 & 0.005518 & 0.0573 & 0.477189 \tabularnewline
46 & -0.010165 & -0.1056 & 0.458032 \tabularnewline
47 & -0.041091 & -0.427 & 0.335105 \tabularnewline
48 & 0.008432 & 0.0876 & 0.465168 \tabularnewline
\hline
\end{tabular}
%Source: https://freestatistics.org/blog/index.php?pk=282856&T=2

[TABLE]
[ROW][C]Partial Autocorrelation Function[/C][/ROW]
[ROW][C]Time lag k[/C][C]PACF(k)[/C][C]T-STAT[/C][C]P-value[/C][/ROW]
[ROW][C]1[/C][C]0.785173[/C][C]8.1598[/C][C]0[/C][/ROW]
[ROW][C]2[/C][C]-0.37135[/C][C]-3.8592[/C][C]9.7e-05[/C][/ROW]
[ROW][C]3[/C][C]-0.004351[/C][C]-0.0452[/C][C]0.48201[/C][/ROW]
[ROW][C]4[/C][C]0.202692[/C][C]2.1064[/C][C]0.018741[/C][/ROW]
[ROW][C]5[/C][C]0.090979[/C][C]0.9455[/C][C]0.173261[/C][/ROW]
[ROW][C]6[/C][C]-0.094236[/C][C]-0.9793[/C][C]0.164803[/C][/ROW]
[ROW][C]7[/C][C]-0.178809[/C][C]-1.8582[/C][C]0.032929[/C][/ROW]
[ROW][C]8[/C][C]0.095364[/C][C]0.9911[/C][C]0.161937[/C][/ROW]
[ROW][C]9[/C][C]0.234039[/C][C]2.4322[/C][C]0.008325[/C][/ROW]
[ROW][C]10[/C][C]0.256671[/C][C]2.6674[/C][C]0.00441[/C][/ROW]
[ROW][C]11[/C][C]0.175077[/C][C]1.8195[/C][C]0.035806[/C][/ROW]
[ROW][C]12[/C][C]0.056574[/C][C]0.5879[/C][C]0.278901[/C][/ROW]
[ROW][C]13[/C][C]-0.730584[/C][C]-7.5925[/C][C]0[/C][/ROW]
[ROW][C]14[/C][C]0.156334[/C][C]1.6247[/C][C]0.053574[/C][/ROW]
[ROW][C]15[/C][C]0.068306[/C][C]0.7099[/C][C]0.23966[/C][/ROW]
[ROW][C]16[/C][C]-0.262767[/C][C]-2.7308[/C][C]0.003691[/C][/ROW]
[ROW][C]17[/C][C]-0.122531[/C][C]-1.2734[/C][C]0.102808[/C][/ROW]
[ROW][C]18[/C][C]-0.077749[/C][C]-0.808[/C][C]0.210436[/C][/ROW]
[ROW][C]19[/C][C]0.107999[/C][C]1.1224[/C][C]0.1321[/C][/ROW]
[ROW][C]20[/C][C]0.005625[/C][C]0.0585[/C][C]0.476748[/C][/ROW]
[ROW][C]21[/C][C]-0.01697[/C][C]-0.1764[/C][C]0.430171[/C][/ROW]
[ROW][C]22[/C][C]0.03888[/C][C]0.4041[/C][C]0.343485[/C][/ROW]
[ROW][C]23[/C][C]0.017833[/C][C]0.1853[/C][C]0.42666[/C][/ROW]
[ROW][C]24[/C][C]0.094721[/C][C]0.9844[/C][C]0.163566[/C][/ROW]
[ROW][C]25[/C][C]-0.00714[/C][C]-0.0742[/C][C]0.470495[/C][/ROW]
[ROW][C]26[/C][C]0.003058[/C][C]0.0318[/C][C]0.487355[/C][/ROW]
[ROW][C]27[/C][C]-0.041733[/C][C]-0.4337[/C][C]0.332686[/C][/ROW]
[ROW][C]28[/C][C]0.179037[/C][C]1.8606[/C][C]0.03276[/C][/ROW]
[ROW][C]29[/C][C]0.009952[/C][C]0.1034[/C][C]0.45891[/C][/ROW]
[ROW][C]30[/C][C]0.053861[/C][C]0.5597[/C][C]0.288408[/C][/ROW]
[ROW][C]31[/C][C]0.030985[/C][C]0.322[/C][C]0.374034[/C][/ROW]
[ROW][C]32[/C][C]0.044804[/C][C]0.4656[/C][C]0.321215[/C][/ROW]
[ROW][C]33[/C][C]0.070814[/C][C]0.7359[/C][C]0.231686[/C][/ROW]
[ROW][C]34[/C][C]-0.014914[/C][C]-0.155[/C][C]0.43856[/C][/ROW]
[ROW][C]35[/C][C]-0.060272[/C][C]-0.6264[/C][C]0.266199[/C][/ROW]
[ROW][C]36[/C][C]0.12402[/C][C]1.2889[/C][C]0.100101[/C][/ROW]
[ROW][C]37[/C][C]-0.065965[/C][C]-0.6855[/C][C]0.247239[/C][/ROW]
[ROW][C]38[/C][C]-0.080667[/C][C]-0.8383[/C][C]0.201852[/C][/ROW]
[ROW][C]39[/C][C]0.004367[/C][C]0.0454[/C][C]0.481943[/C][/ROW]
[ROW][C]40[/C][C]-0.095406[/C][C]-0.9915[/C][C]0.161833[/C][/ROW]
[ROW][C]41[/C][C]-0.056124[/C][C]-0.5833[/C][C]0.280469[/C][/ROW]
[ROW][C]42[/C][C]-0.025359[/C][C]-0.2635[/C][C]0.396319[/C][/ROW]
[ROW][C]43[/C][C]-0.009423[/C][C]-0.0979[/C][C]0.461087[/C][/ROW]
[ROW][C]44[/C][C]-0.039238[/C][C]-0.4078[/C][C]0.342124[/C][/ROW]
[ROW][C]45[/C][C]0.005518[/C][C]0.0573[/C][C]0.477189[/C][/ROW]
[ROW][C]46[/C][C]-0.010165[/C][C]-0.1056[/C][C]0.458032[/C][/ROW]
[ROW][C]47[/C][C]-0.041091[/C][C]-0.427[/C][C]0.335105[/C][/ROW]
[ROW][C]48[/C][C]0.008432[/C][C]0.0876[/C][C]0.465168[/C][/ROW]
[/TABLE]
Source: https://freestatistics.org/blog/index.php?pk=282856&T=2

Globally Unique Identifier (entire table): ba.freestatistics.org/blog/index.php?pk=282856&T=2

As an alternative you can also use a QR Code:  

The GUIDs for individual cells are displayed in the table below:

Partial Autocorrelation Function
Time lag kPACF(k)T-STATP-value
10.7851738.15980
2-0.37135-3.85929.7e-05
3-0.004351-0.04520.48201
40.2026922.10640.018741
50.0909790.94550.173261
6-0.094236-0.97930.164803
7-0.178809-1.85820.032929
80.0953640.99110.161937
90.2340392.43220.008325
100.2566712.66740.00441
110.1750771.81950.035806
120.0565740.58790.278901
13-0.730584-7.59250
140.1563341.62470.053574
150.0683060.70990.23966
16-0.262767-2.73080.003691
17-0.122531-1.27340.102808
18-0.077749-0.8080.210436
190.1079991.12240.1321
200.0056250.05850.476748
21-0.01697-0.17640.430171
220.038880.40410.343485
230.0178330.18530.42666
240.0947210.98440.163566
25-0.00714-0.07420.470495
260.0030580.03180.487355
27-0.041733-0.43370.332686
280.1790371.86060.03276
290.0099520.10340.45891
300.0538610.55970.288408
310.0309850.3220.374034
320.0448040.46560.321215
330.0708140.73590.231686
34-0.014914-0.1550.43856
35-0.060272-0.62640.266199
360.124021.28890.100101
37-0.065965-0.68550.247239
38-0.080667-0.83830.201852
390.0043670.04540.481943
40-0.095406-0.99150.161833
41-0.056124-0.58330.280469
42-0.025359-0.26350.396319
43-0.009423-0.09790.461087
44-0.039238-0.40780.342124
450.0055180.05730.477189
46-0.010165-0.10560.458032
47-0.041091-0.4270.335105
480.0084320.08760.465168


Parameters (Session):
par1 = 48 ; par2 = 1 ; par3 = 0 ; par4 = 0 ; par5 = 12 ; par6 = White Noise ; par7 = 0.95 ;
Parameters (R input):
par1 = 48 ; par2 = 1 ; par3 = 0 ; par4 = 0 ; par5 = 12 ; par6 = White Noise ; par7 = 0.95 ; par8 = ;
R code (references can be found in the software module):
if (par1 == 'Default') {
par1 = 10*log10(length(x))
} else {
par1 <- as.numeric(par1)
}
par2 <- as.numeric(par2)
par3 <- as.numeric(par3)
par4 <- as.numeric(par4)
par5 <- as.numeric(par5)
if (par6 == 'White Noise') par6 <- 'white' else par6 <- 'ma'
par7 <- as.numeric(par7)
if (par8 != '') par8 <- as.numeric(par8)
ox <- x
if (par8 == '') {
if (par2 == 0) {
x <- log(x)
} else {
x <- (x ^ par2 - 1) / par2
}
} else {
x <- log(x,base=par8)
}
if (par3 > 0) x <- diff(x,lag=1,difference=par3)
if (par4 > 0) x <- diff(x,lag=par5,difference=par4)
bitmap(file='picts.png')
op <- par(mfrow=c(2,1))
plot(ox,type='l',main='Original Time Series',xlab='time',ylab='value')
if (par8=='') {
mytitle <- paste('Working Time Series (lambda=',par2,', d=',par3,', D=',par4,')',sep='')
mysub <- paste('(lambda=',par2,', d=',par3,', D=',par4,', CI=', par7, ', CI type=',par6,')',sep='')
} else {
mytitle <- paste('Working Time Series (base=',par8,', d=',par3,', D=',par4,')',sep='')
mysub <- paste('(base=',par8,', d=',par3,', D=',par4,', CI=', par7, ', CI type=',par6,')',sep='')
}
plot(x,type='l', main=mytitle,xlab='time',ylab='value')
par(op)
dev.off()
bitmap(file='pic1.png')
racf <- acf(x, par1, main='Autocorrelation', xlab='time lag', ylab='ACF', ci.type=par6, ci=par7, sub=mysub)
dev.off()
bitmap(file='pic2.png')
rpacf <- pacf(x,par1,main='Partial Autocorrelation',xlab='lags',ylab='PACF',sub=mysub)
dev.off()
(myacf <- c(racf$acf))
(mypacf <- c(rpacf$acf))
lengthx <- length(x)
sqrtn <- sqrt(lengthx)
load(file='createtable')
a<-table.start()
a<-table.row.start(a)
a<-table.element(a,'Autocorrelation Function',4,TRUE)
a<-table.row.end(a)
a<-table.row.start(a)
a<-table.element(a,'Time lag k',header=TRUE)
a<-table.element(a,hyperlink('basics.htm','ACF(k)','click here for more information about the Autocorrelation Function'),header=TRUE)
a<-table.element(a,'T-STAT',header=TRUE)
a<-table.element(a,'P-value',header=TRUE)
a<-table.row.end(a)
for (i in 2:(par1+1)) {
a<-table.row.start(a)
a<-table.element(a,i-1,header=TRUE)
a<-table.element(a,round(myacf[i],6))
mytstat <- myacf[i]*sqrtn
a<-table.element(a,round(mytstat,4))
a<-table.element(a,round(1-pt(abs(mytstat),lengthx),6))
a<-table.row.end(a)
}
a<-table.end(a)
table.save(a,file='mytable.tab')
a<-table.start()
a<-table.row.start(a)
a<-table.element(a,'Partial Autocorrelation Function',4,TRUE)
a<-table.row.end(a)
a<-table.row.start(a)
a<-table.element(a,'Time lag k',header=TRUE)
a<-table.element(a,hyperlink('basics.htm','PACF(k)','click here for more information about the Partial Autocorrelation Function'),header=TRUE)
a<-table.element(a,'T-STAT',header=TRUE)
a<-table.element(a,'P-value',header=TRUE)
a<-table.row.end(a)
for (i in 1:par1) {
a<-table.row.start(a)
a<-table.element(a,i,header=TRUE)
a<-table.element(a,round(mypacf[i],6))
mytstat <- mypacf[i]*sqrtn
a<-table.element(a,round(mytstat,4))
a<-table.element(a,round(1-pt(abs(mytstat),lengthx),6))
a<-table.row.end(a)
}
a<-table.end(a)
table.save(a,file='mytable1.tab')