Free Statistics

of Irreproducible Research!

Author's title

Author*Unverified author*
R Software Modulerwasp_autocorrelation.wasp
Title produced by software(Partial) Autocorrelation Function
Date of computationFri, 23 Oct 2015 11:17:24 +0100
Cite this page as followsStatistical Computations at FreeStatistics.org, Office for Research Development and Education, URL https://freestatistics.org/blog/index.php?v=date/2015/Oct/23/t144559546713a7brjo87bge8j.htm/, Retrieved Tue, 14 May 2024 20:04:48 +0000
Statistical Computations at FreeStatistics.org, Office for Research Development and Education, URL https://freestatistics.org/blog/index.php?pk=282872, Retrieved Tue, 14 May 2024 20:04:48 +0000
QR Codes:

Original text written by user:
IsPrivate?No (this computation is public)
User-defined keywords
Estimated Impact71
Family? (F = Feedback message, R = changed R code, M = changed R Module, P = changed Parameters, D = changed Data)
-       [(Partial) Autocorrelation Function] [] [2015-10-23 10:17:24] [6e9c8a19a65400226bf8d1f1815bc708] [Current]
Feedback Forum

Post a new message
Dataseries X:
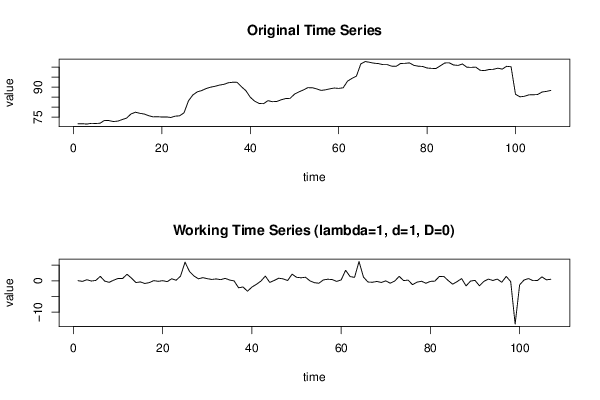
71.59
71.65
71.47
71.82
71.76
71.88
73.31
73.22
72.74
72.95
73.71
74.45
76.54
77.41
76.87
76.51
75.66
75.09
75.16
75
75.05
74.78
75.43
75.61
77.12
83.09
86.09
87.64
88.29
89.3
89.99
90.43
91.03
91.4
92.19
92.45
92.42
90.2
88.23
84.91
82.92
81.8
81.7
83.22
82.7
82.83
83.66
84.28
84.37
86.49
87.62
88.59
89.74
89.73
89.14
88.37
88.65
89.16
89.56
89.37
89.67
93.04
94.4
95.5
101.66
102.86
102.48
102.02
101.83
101.3
101.29
100.53
100.45
101.88
101.95
102.18
100.95
100.52
100.39
99.61
99.43
99.34
100.73
102.14
102.22
101.14
100.91
101.62
100
99.92
100.07
98.48
98.3
98.86
98.96
99.52
99.06
100.47
100.24
86.43
85.14
85.41
86.13
86.19
86.29
87.55
87.87
88.37


Summary of computational transaction
Raw Inputview raw input (R code)
Raw Outputview raw output of R engine
Computing time2 seconds
R Server'Gertrude Mary Cox' @ cox.wessa.net

\begin{tabular}{lllllllll}
\hline
Summary of computational transaction \tabularnewline
Raw Input & view raw input (R code)  \tabularnewline
Raw Output & view raw output of R engine  \tabularnewline
Computing time & 2 seconds \tabularnewline
R Server & 'Gertrude Mary Cox' @ cox.wessa.net \tabularnewline
\hline
\end{tabular}
%Source: https://freestatistics.org/blog/index.php?pk=282872&T=0

[TABLE]
[ROW][C]Summary of computational transaction[/C][/ROW]
[ROW][C]Raw Input[/C][C]view raw input (R code) [/C][/ROW]
[ROW][C]Raw Output[/C][C]view raw output of R engine [/C][/ROW]
[ROW][C]Computing time[/C][C]2 seconds[/C][/ROW]
[ROW][C]R Server[/C][C]'Gertrude Mary Cox' @ cox.wessa.net[/C][/ROW]
[/TABLE]
Source: https://freestatistics.org/blog/index.php?pk=282872&T=0

Globally Unique Identifier (entire table): ba.freestatistics.org/blog/index.php?pk=282872&T=0

As an alternative you can also use a QR Code:  

The GUIDs for individual cells are displayed in the table below:

Summary of computational transaction
Raw Inputview raw input (R code)
Raw Outputview raw output of R engine
Computing time2 seconds
R Server'Gertrude Mary Cox' @ cox.wessa.net


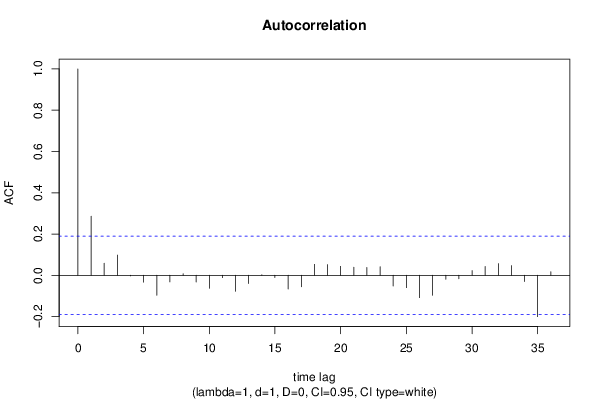
Autocorrelation Function
Time lag kACF(k)T-STATP-value
10.2864892.96350.001875
20.0585250.60540.2731
30.0978891.01260.156775
4-0.002871-0.02970.488181
5-0.03326-0.3440.365744
6-0.097127-1.00470.158657
7-0.031969-0.33070.370762
80.0075910.07850.46878
9-0.032503-0.33620.368684
10-0.063098-0.65270.257677
11-0.011584-0.11980.452424
12-0.077685-0.80360.21171
13-0.039624-0.40990.341359
140.0030210.03120.487564
15-0.010546-0.10910.456669
16-0.066158-0.68430.24762
17-0.055366-0.57270.28402
180.0529190.54740.292622
190.0515360.53310.297538
200.0432530.44740.327741
210.0393530.40710.342384
220.0377560.39060.348453
230.0417240.43160.333452
24-0.051954-0.53740.296048
25-0.059737-0.61790.26897
26-0.108187-1.11910.132802
27-0.096562-0.99880.160062
28-0.019306-0.19970.421047
29-0.016447-0.17010.432614
300.0225060.23280.408181
310.0424420.4390.330764
320.0567360.58690.279259
330.0466680.48270.315134
34-0.03059-0.31640.376147
35-0.200497-2.0740.020242
360.0172870.17880.429209

\begin{tabular}{lllllllll}
\hline
Autocorrelation Function \tabularnewline
Time lag k & ACF(k) & T-STAT & P-value \tabularnewline
1 & 0.286489 & 2.9635 & 0.001875 \tabularnewline
2 & 0.058525 & 0.6054 & 0.2731 \tabularnewline
3 & 0.097889 & 1.0126 & 0.156775 \tabularnewline
4 & -0.002871 & -0.0297 & 0.488181 \tabularnewline
5 & -0.03326 & -0.344 & 0.365744 \tabularnewline
6 & -0.097127 & -1.0047 & 0.158657 \tabularnewline
7 & -0.031969 & -0.3307 & 0.370762 \tabularnewline
8 & 0.007591 & 0.0785 & 0.46878 \tabularnewline
9 & -0.032503 & -0.3362 & 0.368684 \tabularnewline
10 & -0.063098 & -0.6527 & 0.257677 \tabularnewline
11 & -0.011584 & -0.1198 & 0.452424 \tabularnewline
12 & -0.077685 & -0.8036 & 0.21171 \tabularnewline
13 & -0.039624 & -0.4099 & 0.341359 \tabularnewline
14 & 0.003021 & 0.0312 & 0.487564 \tabularnewline
15 & -0.010546 & -0.1091 & 0.456669 \tabularnewline
16 & -0.066158 & -0.6843 & 0.24762 \tabularnewline
17 & -0.055366 & -0.5727 & 0.28402 \tabularnewline
18 & 0.052919 & 0.5474 & 0.292622 \tabularnewline
19 & 0.051536 & 0.5331 & 0.297538 \tabularnewline
20 & 0.043253 & 0.4474 & 0.327741 \tabularnewline
21 & 0.039353 & 0.4071 & 0.342384 \tabularnewline
22 & 0.037756 & 0.3906 & 0.348453 \tabularnewline
23 & 0.041724 & 0.4316 & 0.333452 \tabularnewline
24 & -0.051954 & -0.5374 & 0.296048 \tabularnewline
25 & -0.059737 & -0.6179 & 0.26897 \tabularnewline
26 & -0.108187 & -1.1191 & 0.132802 \tabularnewline
27 & -0.096562 & -0.9988 & 0.160062 \tabularnewline
28 & -0.019306 & -0.1997 & 0.421047 \tabularnewline
29 & -0.016447 & -0.1701 & 0.432614 \tabularnewline
30 & 0.022506 & 0.2328 & 0.408181 \tabularnewline
31 & 0.042442 & 0.439 & 0.330764 \tabularnewline
32 & 0.056736 & 0.5869 & 0.279259 \tabularnewline
33 & 0.046668 & 0.4827 & 0.315134 \tabularnewline
34 & -0.03059 & -0.3164 & 0.376147 \tabularnewline
35 & -0.200497 & -2.074 & 0.020242 \tabularnewline
36 & 0.017287 & 0.1788 & 0.429209 \tabularnewline
\hline
\end{tabular}
%Source: https://freestatistics.org/blog/index.php?pk=282872&T=1

[TABLE]
[ROW][C]Autocorrelation Function[/C][/ROW]
[ROW][C]Time lag k[/C][C]ACF(k)[/C][C]T-STAT[/C][C]P-value[/C][/ROW]
[ROW][C]1[/C][C]0.286489[/C][C]2.9635[/C][C]0.001875[/C][/ROW]
[ROW][C]2[/C][C]0.058525[/C][C]0.6054[/C][C]0.2731[/C][/ROW]
[ROW][C]3[/C][C]0.097889[/C][C]1.0126[/C][C]0.156775[/C][/ROW]
[ROW][C]4[/C][C]-0.002871[/C][C]-0.0297[/C][C]0.488181[/C][/ROW]
[ROW][C]5[/C][C]-0.03326[/C][C]-0.344[/C][C]0.365744[/C][/ROW]
[ROW][C]6[/C][C]-0.097127[/C][C]-1.0047[/C][C]0.158657[/C][/ROW]
[ROW][C]7[/C][C]-0.031969[/C][C]-0.3307[/C][C]0.370762[/C][/ROW]
[ROW][C]8[/C][C]0.007591[/C][C]0.0785[/C][C]0.46878[/C][/ROW]
[ROW][C]9[/C][C]-0.032503[/C][C]-0.3362[/C][C]0.368684[/C][/ROW]
[ROW][C]10[/C][C]-0.063098[/C][C]-0.6527[/C][C]0.257677[/C][/ROW]
[ROW][C]11[/C][C]-0.011584[/C][C]-0.1198[/C][C]0.452424[/C][/ROW]
[ROW][C]12[/C][C]-0.077685[/C][C]-0.8036[/C][C]0.21171[/C][/ROW]
[ROW][C]13[/C][C]-0.039624[/C][C]-0.4099[/C][C]0.341359[/C][/ROW]
[ROW][C]14[/C][C]0.003021[/C][C]0.0312[/C][C]0.487564[/C][/ROW]
[ROW][C]15[/C][C]-0.010546[/C][C]-0.1091[/C][C]0.456669[/C][/ROW]
[ROW][C]16[/C][C]-0.066158[/C][C]-0.6843[/C][C]0.24762[/C][/ROW]
[ROW][C]17[/C][C]-0.055366[/C][C]-0.5727[/C][C]0.28402[/C][/ROW]
[ROW][C]18[/C][C]0.052919[/C][C]0.5474[/C][C]0.292622[/C][/ROW]
[ROW][C]19[/C][C]0.051536[/C][C]0.5331[/C][C]0.297538[/C][/ROW]
[ROW][C]20[/C][C]0.043253[/C][C]0.4474[/C][C]0.327741[/C][/ROW]
[ROW][C]21[/C][C]0.039353[/C][C]0.4071[/C][C]0.342384[/C][/ROW]
[ROW][C]22[/C][C]0.037756[/C][C]0.3906[/C][C]0.348453[/C][/ROW]
[ROW][C]23[/C][C]0.041724[/C][C]0.4316[/C][C]0.333452[/C][/ROW]
[ROW][C]24[/C][C]-0.051954[/C][C]-0.5374[/C][C]0.296048[/C][/ROW]
[ROW][C]25[/C][C]-0.059737[/C][C]-0.6179[/C][C]0.26897[/C][/ROW]
[ROW][C]26[/C][C]-0.108187[/C][C]-1.1191[/C][C]0.132802[/C][/ROW]
[ROW][C]27[/C][C]-0.096562[/C][C]-0.9988[/C][C]0.160062[/C][/ROW]
[ROW][C]28[/C][C]-0.019306[/C][C]-0.1997[/C][C]0.421047[/C][/ROW]
[ROW][C]29[/C][C]-0.016447[/C][C]-0.1701[/C][C]0.432614[/C][/ROW]
[ROW][C]30[/C][C]0.022506[/C][C]0.2328[/C][C]0.408181[/C][/ROW]
[ROW][C]31[/C][C]0.042442[/C][C]0.439[/C][C]0.330764[/C][/ROW]
[ROW][C]32[/C][C]0.056736[/C][C]0.5869[/C][C]0.279259[/C][/ROW]
[ROW][C]33[/C][C]0.046668[/C][C]0.4827[/C][C]0.315134[/C][/ROW]
[ROW][C]34[/C][C]-0.03059[/C][C]-0.3164[/C][C]0.376147[/C][/ROW]
[ROW][C]35[/C][C]-0.200497[/C][C]-2.074[/C][C]0.020242[/C][/ROW]
[ROW][C]36[/C][C]0.017287[/C][C]0.1788[/C][C]0.429209[/C][/ROW]
[/TABLE]
Source: https://freestatistics.org/blog/index.php?pk=282872&T=1

Globally Unique Identifier (entire table): ba.freestatistics.org/blog/index.php?pk=282872&T=1

As an alternative you can also use a QR Code:  

The GUIDs for individual cells are displayed in the table below:

Autocorrelation Function
Time lag kACF(k)T-STATP-value
10.2864892.96350.001875
20.0585250.60540.2731
30.0978891.01260.156775
4-0.002871-0.02970.488181
5-0.03326-0.3440.365744
6-0.097127-1.00470.158657
7-0.031969-0.33070.370762
80.0075910.07850.46878
9-0.032503-0.33620.368684
10-0.063098-0.65270.257677
11-0.011584-0.11980.452424
12-0.077685-0.80360.21171
13-0.039624-0.40990.341359
140.0030210.03120.487564
15-0.010546-0.10910.456669
16-0.066158-0.68430.24762
17-0.055366-0.57270.28402
180.0529190.54740.292622
190.0515360.53310.297538
200.0432530.44740.327741
210.0393530.40710.342384
220.0377560.39060.348453
230.0417240.43160.333452
24-0.051954-0.53740.296048
25-0.059737-0.61790.26897
26-0.108187-1.11910.132802
27-0.096562-0.99880.160062
28-0.019306-0.19970.421047
29-0.016447-0.17010.432614
300.0225060.23280.408181
310.0424420.4390.330764
320.0567360.58690.279259
330.0466680.48270.315134
34-0.03059-0.31640.376147
35-0.200497-2.0740.020242
360.0172870.17880.429209


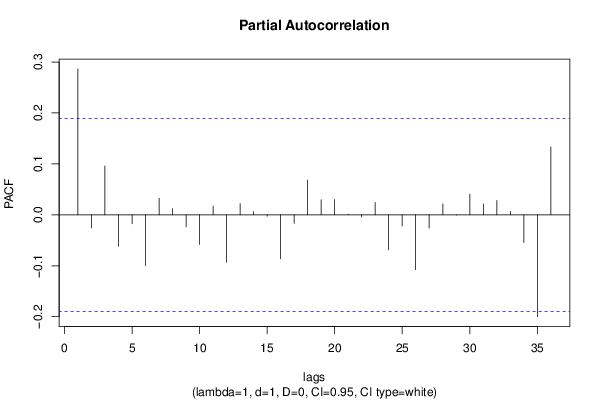
Partial Autocorrelation Function
Time lag kPACF(k)T-STATP-value
10.2864892.96350.001875
2-0.025656-0.26540.39561
30.0959770.99280.161525
4-0.061857-0.63990.261817
5-0.01741-0.18010.428713
6-0.099501-1.02920.152842
70.0326910.33820.367952
80.0122290.12650.449789
9-0.023623-0.24440.403712
10-0.058307-0.60310.27385
110.0173190.17920.429078
12-0.093061-0.96260.168953
130.0220530.22810.409996
140.0062350.06450.474349
15-0.002981-0.03080.487728
16-0.086431-0.8940.186652
17-0.016685-0.17260.43165
180.0681420.70490.241212
190.0295810.3060.380102
200.0302570.3130.377453
210.0012880.01330.494697
22-0.004303-0.04450.482289
230.0242560.25090.401182
24-0.068787-0.71150.239149
25-0.022014-0.22770.410152
26-0.107788-1.1150.133682
27-0.025816-0.2670.394975
280.021180.21910.413501
29-0.000481-0.0050.498021
300.0403760.41770.338517
310.0213310.22060.412893
320.0282590.29230.385308
330.0067530.06990.472218
34-0.054317-0.56190.287693
35-0.199975-2.06860.020499
360.1333841.37970.085272

\begin{tabular}{lllllllll}
\hline
Partial Autocorrelation Function \tabularnewline
Time lag k & PACF(k) & T-STAT & P-value \tabularnewline
1 & 0.286489 & 2.9635 & 0.001875 \tabularnewline
2 & -0.025656 & -0.2654 & 0.39561 \tabularnewline
3 & 0.095977 & 0.9928 & 0.161525 \tabularnewline
4 & -0.061857 & -0.6399 & 0.261817 \tabularnewline
5 & -0.01741 & -0.1801 & 0.428713 \tabularnewline
6 & -0.099501 & -1.0292 & 0.152842 \tabularnewline
7 & 0.032691 & 0.3382 & 0.367952 \tabularnewline
8 & 0.012229 & 0.1265 & 0.449789 \tabularnewline
9 & -0.023623 & -0.2444 & 0.403712 \tabularnewline
10 & -0.058307 & -0.6031 & 0.27385 \tabularnewline
11 & 0.017319 & 0.1792 & 0.429078 \tabularnewline
12 & -0.093061 & -0.9626 & 0.168953 \tabularnewline
13 & 0.022053 & 0.2281 & 0.409996 \tabularnewline
14 & 0.006235 & 0.0645 & 0.474349 \tabularnewline
15 & -0.002981 & -0.0308 & 0.487728 \tabularnewline
16 & -0.086431 & -0.894 & 0.186652 \tabularnewline
17 & -0.016685 & -0.1726 & 0.43165 \tabularnewline
18 & 0.068142 & 0.7049 & 0.241212 \tabularnewline
19 & 0.029581 & 0.306 & 0.380102 \tabularnewline
20 & 0.030257 & 0.313 & 0.377453 \tabularnewline
21 & 0.001288 & 0.0133 & 0.494697 \tabularnewline
22 & -0.004303 & -0.0445 & 0.482289 \tabularnewline
23 & 0.024256 & 0.2509 & 0.401182 \tabularnewline
24 & -0.068787 & -0.7115 & 0.239149 \tabularnewline
25 & -0.022014 & -0.2277 & 0.410152 \tabularnewline
26 & -0.107788 & -1.115 & 0.133682 \tabularnewline
27 & -0.025816 & -0.267 & 0.394975 \tabularnewline
28 & 0.02118 & 0.2191 & 0.413501 \tabularnewline
29 & -0.000481 & -0.005 & 0.498021 \tabularnewline
30 & 0.040376 & 0.4177 & 0.338517 \tabularnewline
31 & 0.021331 & 0.2206 & 0.412893 \tabularnewline
32 & 0.028259 & 0.2923 & 0.385308 \tabularnewline
33 & 0.006753 & 0.0699 & 0.472218 \tabularnewline
34 & -0.054317 & -0.5619 & 0.287693 \tabularnewline
35 & -0.199975 & -2.0686 & 0.020499 \tabularnewline
36 & 0.133384 & 1.3797 & 0.085272 \tabularnewline
\hline
\end{tabular}
%Source: https://freestatistics.org/blog/index.php?pk=282872&T=2

[TABLE]
[ROW][C]Partial Autocorrelation Function[/C][/ROW]
[ROW][C]Time lag k[/C][C]PACF(k)[/C][C]T-STAT[/C][C]P-value[/C][/ROW]
[ROW][C]1[/C][C]0.286489[/C][C]2.9635[/C][C]0.001875[/C][/ROW]
[ROW][C]2[/C][C]-0.025656[/C][C]-0.2654[/C][C]0.39561[/C][/ROW]
[ROW][C]3[/C][C]0.095977[/C][C]0.9928[/C][C]0.161525[/C][/ROW]
[ROW][C]4[/C][C]-0.061857[/C][C]-0.6399[/C][C]0.261817[/C][/ROW]
[ROW][C]5[/C][C]-0.01741[/C][C]-0.1801[/C][C]0.428713[/C][/ROW]
[ROW][C]6[/C][C]-0.099501[/C][C]-1.0292[/C][C]0.152842[/C][/ROW]
[ROW][C]7[/C][C]0.032691[/C][C]0.3382[/C][C]0.367952[/C][/ROW]
[ROW][C]8[/C][C]0.012229[/C][C]0.1265[/C][C]0.449789[/C][/ROW]
[ROW][C]9[/C][C]-0.023623[/C][C]-0.2444[/C][C]0.403712[/C][/ROW]
[ROW][C]10[/C][C]-0.058307[/C][C]-0.6031[/C][C]0.27385[/C][/ROW]
[ROW][C]11[/C][C]0.017319[/C][C]0.1792[/C][C]0.429078[/C][/ROW]
[ROW][C]12[/C][C]-0.093061[/C][C]-0.9626[/C][C]0.168953[/C][/ROW]
[ROW][C]13[/C][C]0.022053[/C][C]0.2281[/C][C]0.409996[/C][/ROW]
[ROW][C]14[/C][C]0.006235[/C][C]0.0645[/C][C]0.474349[/C][/ROW]
[ROW][C]15[/C][C]-0.002981[/C][C]-0.0308[/C][C]0.487728[/C][/ROW]
[ROW][C]16[/C][C]-0.086431[/C][C]-0.894[/C][C]0.186652[/C][/ROW]
[ROW][C]17[/C][C]-0.016685[/C][C]-0.1726[/C][C]0.43165[/C][/ROW]
[ROW][C]18[/C][C]0.068142[/C][C]0.7049[/C][C]0.241212[/C][/ROW]
[ROW][C]19[/C][C]0.029581[/C][C]0.306[/C][C]0.380102[/C][/ROW]
[ROW][C]20[/C][C]0.030257[/C][C]0.313[/C][C]0.377453[/C][/ROW]
[ROW][C]21[/C][C]0.001288[/C][C]0.0133[/C][C]0.494697[/C][/ROW]
[ROW][C]22[/C][C]-0.004303[/C][C]-0.0445[/C][C]0.482289[/C][/ROW]
[ROW][C]23[/C][C]0.024256[/C][C]0.2509[/C][C]0.401182[/C][/ROW]
[ROW][C]24[/C][C]-0.068787[/C][C]-0.7115[/C][C]0.239149[/C][/ROW]
[ROW][C]25[/C][C]-0.022014[/C][C]-0.2277[/C][C]0.410152[/C][/ROW]
[ROW][C]26[/C][C]-0.107788[/C][C]-1.115[/C][C]0.133682[/C][/ROW]
[ROW][C]27[/C][C]-0.025816[/C][C]-0.267[/C][C]0.394975[/C][/ROW]
[ROW][C]28[/C][C]0.02118[/C][C]0.2191[/C][C]0.413501[/C][/ROW]
[ROW][C]29[/C][C]-0.000481[/C][C]-0.005[/C][C]0.498021[/C][/ROW]
[ROW][C]30[/C][C]0.040376[/C][C]0.4177[/C][C]0.338517[/C][/ROW]
[ROW][C]31[/C][C]0.021331[/C][C]0.2206[/C][C]0.412893[/C][/ROW]
[ROW][C]32[/C][C]0.028259[/C][C]0.2923[/C][C]0.385308[/C][/ROW]
[ROW][C]33[/C][C]0.006753[/C][C]0.0699[/C][C]0.472218[/C][/ROW]
[ROW][C]34[/C][C]-0.054317[/C][C]-0.5619[/C][C]0.287693[/C][/ROW]
[ROW][C]35[/C][C]-0.199975[/C][C]-2.0686[/C][C]0.020499[/C][/ROW]
[ROW][C]36[/C][C]0.133384[/C][C]1.3797[/C][C]0.085272[/C][/ROW]
[/TABLE]
Source: https://freestatistics.org/blog/index.php?pk=282872&T=2

Globally Unique Identifier (entire table): ba.freestatistics.org/blog/index.php?pk=282872&T=2

As an alternative you can also use a QR Code:  

The GUIDs for individual cells are displayed in the table below:

Partial Autocorrelation Function
Time lag kPACF(k)T-STATP-value
10.2864892.96350.001875
2-0.025656-0.26540.39561
30.0959770.99280.161525
4-0.061857-0.63990.261817
5-0.01741-0.18010.428713
6-0.099501-1.02920.152842
70.0326910.33820.367952
80.0122290.12650.449789
9-0.023623-0.24440.403712
10-0.058307-0.60310.27385
110.0173190.17920.429078
12-0.093061-0.96260.168953
130.0220530.22810.409996
140.0062350.06450.474349
15-0.002981-0.03080.487728
16-0.086431-0.8940.186652
17-0.016685-0.17260.43165
180.0681420.70490.241212
190.0295810.3060.380102
200.0302570.3130.377453
210.0012880.01330.494697
22-0.004303-0.04450.482289
230.0242560.25090.401182
24-0.068787-0.71150.239149
25-0.022014-0.22770.410152
26-0.107788-1.1150.133682
27-0.025816-0.2670.394975
280.021180.21910.413501
29-0.000481-0.0050.498021
300.0403760.41770.338517
310.0213310.22060.412893
320.0282590.29230.385308
330.0067530.06990.472218
34-0.054317-0.56190.287693
35-0.199975-2.06860.020499
360.1333841.37970.085272


Parameters (Session):
par1 = 36 ; par2 = 1 ; par3 = 1 ; par4 = 0 ; par5 = 12 ; par6 = White Noise ; par7 = 0.95 ;
Parameters (R input):
par1 = 36 ; par2 = 1 ; par3 = 1 ; par4 = 0 ; par5 = 12 ; par6 = White Noise ; par7 = 0.95 ; par8 = ;
R code (references can be found in the software module):
par8 <- ''
par7 <- '0.95'
par6 <- 'White Noise'
par5 <- '12'
par4 <- '0'
par3 <- '1'
par2 <- '1'
par1 <- '48'
if (par1 == 'Default') {
par1 = 10*log10(length(x))
} else {
par1 <- as.numeric(par1)
}
par2 <- as.numeric(par2)
par3 <- as.numeric(par3)
par4 <- as.numeric(par4)
par5 <- as.numeric(par5)
if (par6 == 'White Noise') par6 <- 'white' else par6 <- 'ma'
par7 <- as.numeric(par7)
if (par8 != '') par8 <- as.numeric(par8)
ox <- x
if (par8 == '') {
if (par2 == 0) {
x <- log(x)
} else {
x <- (x ^ par2 - 1) / par2
}
} else {
x <- log(x,base=par8)
}
if (par3 > 0) x <- diff(x,lag=1,difference=par3)
if (par4 > 0) x <- diff(x,lag=par5,difference=par4)
bitmap(file='picts.png')
op <- par(mfrow=c(2,1))
plot(ox,type='l',main='Original Time Series',xlab='time',ylab='value')
if (par8=='') {
mytitle <- paste('Working Time Series (lambda=',par2,', d=',par3,', D=',par4,')',sep='')
mysub <- paste('(lambda=',par2,', d=',par3,', D=',par4,', CI=', par7, ', CI type=',par6,')',sep='')
} else {
mytitle <- paste('Working Time Series (base=',par8,', d=',par3,', D=',par4,')',sep='')
mysub <- paste('(base=',par8,', d=',par3,', D=',par4,', CI=', par7, ', CI type=',par6,')',sep='')
}
plot(x,type='l', main=mytitle,xlab='time',ylab='value')
par(op)
dev.off()
bitmap(file='pic1.png')
racf <- acf(x, par1, main='Autocorrelation', xlab='time lag', ylab='ACF', ci.type=par6, ci=par7, sub=mysub)
dev.off()
bitmap(file='pic2.png')
rpacf <- pacf(x,par1,main='Partial Autocorrelation',xlab='lags',ylab='PACF',sub=mysub)
dev.off()
(myacf <- c(racf$acf))
(mypacf <- c(rpacf$acf))
lengthx <- length(x)
sqrtn <- sqrt(lengthx)
load(file='createtable')
a<-table.start()
a<-table.row.start(a)
a<-table.element(a,'Autocorrelation Function',4,TRUE)
a<-table.row.end(a)
a<-table.row.start(a)
a<-table.element(a,'Time lag k',header=TRUE)
a<-table.element(a,hyperlink('basics.htm','ACF(k)','click here for more information about the Autocorrelation Function'),header=TRUE)
a<-table.element(a,'T-STAT',header=TRUE)
a<-table.element(a,'P-value',header=TRUE)
a<-table.row.end(a)
for (i in 2:(par1+1)) {
a<-table.row.start(a)
a<-table.element(a,i-1,header=TRUE)
a<-table.element(a,round(myacf[i],6))
mytstat <- myacf[i]*sqrtn
a<-table.element(a,round(mytstat,4))
a<-table.element(a,round(1-pt(abs(mytstat),lengthx),6))
a<-table.row.end(a)
}
a<-table.end(a)
table.save(a,file='mytable.tab')
a<-table.start()
a<-table.row.start(a)
a<-table.element(a,'Partial Autocorrelation Function',4,TRUE)
a<-table.row.end(a)
a<-table.row.start(a)
a<-table.element(a,'Time lag k',header=TRUE)
a<-table.element(a,hyperlink('basics.htm','PACF(k)','click here for more information about the Partial Autocorrelation Function'),header=TRUE)
a<-table.element(a,'T-STAT',header=TRUE)
a<-table.element(a,'P-value',header=TRUE)
a<-table.row.end(a)
for (i in 1:par1) {
a<-table.row.start(a)
a<-table.element(a,i,header=TRUE)
a<-table.element(a,round(mypacf[i],6))
mytstat <- mypacf[i]*sqrtn
a<-table.element(a,round(mytstat,4))
a<-table.element(a,round(1-pt(abs(mytstat),lengthx),6))
a<-table.row.end(a)
}
a<-table.end(a)
table.save(a,file='mytable1.tab')