Free Statistics

of Irreproducible Research!

Author's title

Author*Unverified author*
R Software Modulerwasp_autocorrelation.wasp
Title produced by software(Partial) Autocorrelation Function
Date of computationFri, 23 Oct 2015 11:36:38 +0100
Cite this page as followsStatistical Computations at FreeStatistics.org, Office for Research Development and Education, URL https://freestatistics.org/blog/index.php?v=date/2015/Oct/23/t1445596651d5gyzck8ec9lcnz.htm/, Retrieved Tue, 14 May 2024 21:38:25 +0000
Statistical Computations at FreeStatistics.org, Office for Research Development and Education, URL https://freestatistics.org/blog/index.php?pk=282881, Retrieved Tue, 14 May 2024 21:38:25 +0000
QR Codes:

Original text written by user:
IsPrivate?No (this computation is public)
User-defined keywords
Estimated Impact97
Family? (F = Feedback message, R = changed R code, M = changed R Module, P = changed Parameters, D = changed Data)
-       [(Partial) Autocorrelation Function] [Autocorrelation -...] [2015-10-23 10:36:38] [3f1a7081c5450f075552d8bc3f139f2c] [Current]
- R P     [(Partial) Autocorrelation Function] [Autocorrelation 1...] [2016-01-11 06:57:08] [b78554c675fd79077ee7678381a14583]
Feedback Forum

Post a new message
Dataseries X:
26.133
25.979
25.541
25.308
25.663
25.78
25.328
24.806
24.651
24.531
24.633
25.174
24.449
24.277
24.393
24.301
24.381
24.286
24.335
24.273
24.556
24.841
25.464
25.514
25.531
25.042
24.676
24.809
25.313
25.64
25.447
25.021
24.752
24.939
25.365
25.214
25.563
25.475
25.659
25.841
25.888
25.759
25.944
25.818
25.789
25.662
26.927
27.521
27.485
27.444
27.395
27.45
27.437
27.45
27.458
27.816
27.599
27.588
27.667
27.64


Summary of computational transaction
Raw Inputview raw input (R code)
Raw Outputview raw output of R engine
Computing time2 seconds
R Server'Gwilym Jenkins' @ jenkins.wessa.net

\begin{tabular}{lllllllll}
\hline
Summary of computational transaction \tabularnewline
Raw Input & view raw input (R code)  \tabularnewline
Raw Output & view raw output of R engine  \tabularnewline
Computing time & 2 seconds \tabularnewline
R Server & 'Gwilym Jenkins' @ jenkins.wessa.net \tabularnewline
\hline
\end{tabular}
%Source: https://freestatistics.org/blog/index.php?pk=282881&T=0

[TABLE]
[ROW][C]Summary of computational transaction[/C][/ROW]
[ROW][C]Raw Input[/C][C]view raw input (R code) [/C][/ROW]
[ROW][C]Raw Output[/C][C]view raw output of R engine [/C][/ROW]
[ROW][C]Computing time[/C][C]2 seconds[/C][/ROW]
[ROW][C]R Server[/C][C]'Gwilym Jenkins' @ jenkins.wessa.net[/C][/ROW]
[/TABLE]
Source: https://freestatistics.org/blog/index.php?pk=282881&T=0

Globally Unique Identifier (entire table): ba.freestatistics.org/blog/index.php?pk=282881&T=0

As an alternative you can also use a QR Code:  

The GUIDs for individual cells are displayed in the table below:

Summary of computational transaction
Raw Inputview raw input (R code)
Raw Outputview raw output of R engine
Computing time2 seconds
R Server'Gwilym Jenkins' @ jenkins.wessa.net


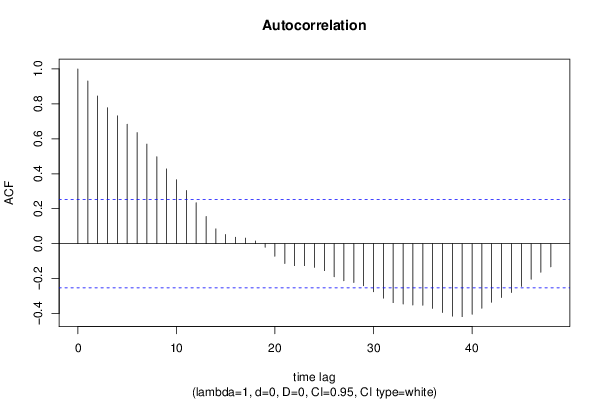
Autocorrelation Function
Time lag kACF(k)T-STATP-value
10.9313457.21420
20.8457056.55080
30.7776056.02330
40.7316165.66710
50.6839985.29821e-06
60.6355764.92323e-06
70.5699044.41452.1e-05
80.4975453.8540.000143
90.4279033.31450.00078
100.3658342.83370.003129
110.3043132.35720.010847
120.2339471.81210.037484
130.1559561.2080.115888
140.084650.65570.257263
150.0520120.40290.344233
160.0368690.28560.388089
170.0318040.24640.403124
180.0156460.12120.451971
19-0.020529-0.1590.437093
20-0.072438-0.56110.288408
21-0.11398-0.88290.190412
22-0.125741-0.9740.166986
23-0.125784-0.97430.166905
24-0.136003-1.05350.148174
25-0.154491-1.19670.118069
26-0.189951-1.47140.073211
27-0.212495-1.6460.052498
28-0.222073-1.72020.045278
29-0.240993-1.86670.033414
30-0.275003-2.13020.018634
31-0.311856-2.41560.009385
32-0.337492-2.61420.005646
33-0.345949-2.67970.004749
34-0.350766-2.7170.004298
35-0.352524-2.73060.004143
36-0.370298-2.86830.002844
37-0.39413-3.05290.001688
38-0.41499-3.21450.001052
39-0.41783-3.23650.000986
40-0.403665-3.12680.001362
41-0.36936-2.8610.002902
42-0.335104-2.59570.005926
43-0.308072-2.38630.010095
44-0.27983-2.16760.017086
45-0.244745-1.89580.031404
46-0.203424-1.57570.060175
47-0.163586-1.26710.105003
48-0.132785-1.02860.15391

\begin{tabular}{lllllllll}
\hline
Autocorrelation Function \tabularnewline
Time lag k & ACF(k) & T-STAT & P-value \tabularnewline
1 & 0.931345 & 7.2142 & 0 \tabularnewline
2 & 0.845705 & 6.5508 & 0 \tabularnewline
3 & 0.777605 & 6.0233 & 0 \tabularnewline
4 & 0.731616 & 5.6671 & 0 \tabularnewline
5 & 0.683998 & 5.2982 & 1e-06 \tabularnewline
6 & 0.635576 & 4.9232 & 3e-06 \tabularnewline
7 & 0.569904 & 4.4145 & 2.1e-05 \tabularnewline
8 & 0.497545 & 3.854 & 0.000143 \tabularnewline
9 & 0.427903 & 3.3145 & 0.00078 \tabularnewline
10 & 0.365834 & 2.8337 & 0.003129 \tabularnewline
11 & 0.304313 & 2.3572 & 0.010847 \tabularnewline
12 & 0.233947 & 1.8121 & 0.037484 \tabularnewline
13 & 0.155956 & 1.208 & 0.115888 \tabularnewline
14 & 0.08465 & 0.6557 & 0.257263 \tabularnewline
15 & 0.052012 & 0.4029 & 0.344233 \tabularnewline
16 & 0.036869 & 0.2856 & 0.388089 \tabularnewline
17 & 0.031804 & 0.2464 & 0.403124 \tabularnewline
18 & 0.015646 & 0.1212 & 0.451971 \tabularnewline
19 & -0.020529 & -0.159 & 0.437093 \tabularnewline
20 & -0.072438 & -0.5611 & 0.288408 \tabularnewline
21 & -0.11398 & -0.8829 & 0.190412 \tabularnewline
22 & -0.125741 & -0.974 & 0.166986 \tabularnewline
23 & -0.125784 & -0.9743 & 0.166905 \tabularnewline
24 & -0.136003 & -1.0535 & 0.148174 \tabularnewline
25 & -0.154491 & -1.1967 & 0.118069 \tabularnewline
26 & -0.189951 & -1.4714 & 0.073211 \tabularnewline
27 & -0.212495 & -1.646 & 0.052498 \tabularnewline
28 & -0.222073 & -1.7202 & 0.045278 \tabularnewline
29 & -0.240993 & -1.8667 & 0.033414 \tabularnewline
30 & -0.275003 & -2.1302 & 0.018634 \tabularnewline
31 & -0.311856 & -2.4156 & 0.009385 \tabularnewline
32 & -0.337492 & -2.6142 & 0.005646 \tabularnewline
33 & -0.345949 & -2.6797 & 0.004749 \tabularnewline
34 & -0.350766 & -2.717 & 0.004298 \tabularnewline
35 & -0.352524 & -2.7306 & 0.004143 \tabularnewline
36 & -0.370298 & -2.8683 & 0.002844 \tabularnewline
37 & -0.39413 & -3.0529 & 0.001688 \tabularnewline
38 & -0.41499 & -3.2145 & 0.001052 \tabularnewline
39 & -0.41783 & -3.2365 & 0.000986 \tabularnewline
40 & -0.403665 & -3.1268 & 0.001362 \tabularnewline
41 & -0.36936 & -2.861 & 0.002902 \tabularnewline
42 & -0.335104 & -2.5957 & 0.005926 \tabularnewline
43 & -0.308072 & -2.3863 & 0.010095 \tabularnewline
44 & -0.27983 & -2.1676 & 0.017086 \tabularnewline
45 & -0.244745 & -1.8958 & 0.031404 \tabularnewline
46 & -0.203424 & -1.5757 & 0.060175 \tabularnewline
47 & -0.163586 & -1.2671 & 0.105003 \tabularnewline
48 & -0.132785 & -1.0286 & 0.15391 \tabularnewline
\hline
\end{tabular}
%Source: https://freestatistics.org/blog/index.php?pk=282881&T=1

[TABLE]
[ROW][C]Autocorrelation Function[/C][/ROW]
[ROW][C]Time lag k[/C][C]ACF(k)[/C][C]T-STAT[/C][C]P-value[/C][/ROW]
[ROW][C]1[/C][C]0.931345[/C][C]7.2142[/C][C]0[/C][/ROW]
[ROW][C]2[/C][C]0.845705[/C][C]6.5508[/C][C]0[/C][/ROW]
[ROW][C]3[/C][C]0.777605[/C][C]6.0233[/C][C]0[/C][/ROW]
[ROW][C]4[/C][C]0.731616[/C][C]5.6671[/C][C]0[/C][/ROW]
[ROW][C]5[/C][C]0.683998[/C][C]5.2982[/C][C]1e-06[/C][/ROW]
[ROW][C]6[/C][C]0.635576[/C][C]4.9232[/C][C]3e-06[/C][/ROW]
[ROW][C]7[/C][C]0.569904[/C][C]4.4145[/C][C]2.1e-05[/C][/ROW]
[ROW][C]8[/C][C]0.497545[/C][C]3.854[/C][C]0.000143[/C][/ROW]
[ROW][C]9[/C][C]0.427903[/C][C]3.3145[/C][C]0.00078[/C][/ROW]
[ROW][C]10[/C][C]0.365834[/C][C]2.8337[/C][C]0.003129[/C][/ROW]
[ROW][C]11[/C][C]0.304313[/C][C]2.3572[/C][C]0.010847[/C][/ROW]
[ROW][C]12[/C][C]0.233947[/C][C]1.8121[/C][C]0.037484[/C][/ROW]
[ROW][C]13[/C][C]0.155956[/C][C]1.208[/C][C]0.115888[/C][/ROW]
[ROW][C]14[/C][C]0.08465[/C][C]0.6557[/C][C]0.257263[/C][/ROW]
[ROW][C]15[/C][C]0.052012[/C][C]0.4029[/C][C]0.344233[/C][/ROW]
[ROW][C]16[/C][C]0.036869[/C][C]0.2856[/C][C]0.388089[/C][/ROW]
[ROW][C]17[/C][C]0.031804[/C][C]0.2464[/C][C]0.403124[/C][/ROW]
[ROW][C]18[/C][C]0.015646[/C][C]0.1212[/C][C]0.451971[/C][/ROW]
[ROW][C]19[/C][C]-0.020529[/C][C]-0.159[/C][C]0.437093[/C][/ROW]
[ROW][C]20[/C][C]-0.072438[/C][C]-0.5611[/C][C]0.288408[/C][/ROW]
[ROW][C]21[/C][C]-0.11398[/C][C]-0.8829[/C][C]0.190412[/C][/ROW]
[ROW][C]22[/C][C]-0.125741[/C][C]-0.974[/C][C]0.166986[/C][/ROW]
[ROW][C]23[/C][C]-0.125784[/C][C]-0.9743[/C][C]0.166905[/C][/ROW]
[ROW][C]24[/C][C]-0.136003[/C][C]-1.0535[/C][C]0.148174[/C][/ROW]
[ROW][C]25[/C][C]-0.154491[/C][C]-1.1967[/C][C]0.118069[/C][/ROW]
[ROW][C]26[/C][C]-0.189951[/C][C]-1.4714[/C][C]0.073211[/C][/ROW]
[ROW][C]27[/C][C]-0.212495[/C][C]-1.646[/C][C]0.052498[/C][/ROW]
[ROW][C]28[/C][C]-0.222073[/C][C]-1.7202[/C][C]0.045278[/C][/ROW]
[ROW][C]29[/C][C]-0.240993[/C][C]-1.8667[/C][C]0.033414[/C][/ROW]
[ROW][C]30[/C][C]-0.275003[/C][C]-2.1302[/C][C]0.018634[/C][/ROW]
[ROW][C]31[/C][C]-0.311856[/C][C]-2.4156[/C][C]0.009385[/C][/ROW]
[ROW][C]32[/C][C]-0.337492[/C][C]-2.6142[/C][C]0.005646[/C][/ROW]
[ROW][C]33[/C][C]-0.345949[/C][C]-2.6797[/C][C]0.004749[/C][/ROW]
[ROW][C]34[/C][C]-0.350766[/C][C]-2.717[/C][C]0.004298[/C][/ROW]
[ROW][C]35[/C][C]-0.352524[/C][C]-2.7306[/C][C]0.004143[/C][/ROW]
[ROW][C]36[/C][C]-0.370298[/C][C]-2.8683[/C][C]0.002844[/C][/ROW]
[ROW][C]37[/C][C]-0.39413[/C][C]-3.0529[/C][C]0.001688[/C][/ROW]
[ROW][C]38[/C][C]-0.41499[/C][C]-3.2145[/C][C]0.001052[/C][/ROW]
[ROW][C]39[/C][C]-0.41783[/C][C]-3.2365[/C][C]0.000986[/C][/ROW]
[ROW][C]40[/C][C]-0.403665[/C][C]-3.1268[/C][C]0.001362[/C][/ROW]
[ROW][C]41[/C][C]-0.36936[/C][C]-2.861[/C][C]0.002902[/C][/ROW]
[ROW][C]42[/C][C]-0.335104[/C][C]-2.5957[/C][C]0.005926[/C][/ROW]
[ROW][C]43[/C][C]-0.308072[/C][C]-2.3863[/C][C]0.010095[/C][/ROW]
[ROW][C]44[/C][C]-0.27983[/C][C]-2.1676[/C][C]0.017086[/C][/ROW]
[ROW][C]45[/C][C]-0.244745[/C][C]-1.8958[/C][C]0.031404[/C][/ROW]
[ROW][C]46[/C][C]-0.203424[/C][C]-1.5757[/C][C]0.060175[/C][/ROW]
[ROW][C]47[/C][C]-0.163586[/C][C]-1.2671[/C][C]0.105003[/C][/ROW]
[ROW][C]48[/C][C]-0.132785[/C][C]-1.0286[/C][C]0.15391[/C][/ROW]
[/TABLE]
Source: https://freestatistics.org/blog/index.php?pk=282881&T=1

Globally Unique Identifier (entire table): ba.freestatistics.org/blog/index.php?pk=282881&T=1

As an alternative you can also use a QR Code:  

The GUIDs for individual cells are displayed in the table below:

Autocorrelation Function
Time lag kACF(k)T-STATP-value
10.9313457.21420
20.8457056.55080
30.7776056.02330
40.7316165.66710
50.6839985.29821e-06
60.6355764.92323e-06
70.5699044.41452.1e-05
80.4975453.8540.000143
90.4279033.31450.00078
100.3658342.83370.003129
110.3043132.35720.010847
120.2339471.81210.037484
130.1559561.2080.115888
140.084650.65570.257263
150.0520120.40290.344233
160.0368690.28560.388089
170.0318040.24640.403124
180.0156460.12120.451971
19-0.020529-0.1590.437093
20-0.072438-0.56110.288408
21-0.11398-0.88290.190412
22-0.125741-0.9740.166986
23-0.125784-0.97430.166905
24-0.136003-1.05350.148174
25-0.154491-1.19670.118069
26-0.189951-1.47140.073211
27-0.212495-1.6460.052498
28-0.222073-1.72020.045278
29-0.240993-1.86670.033414
30-0.275003-2.13020.018634
31-0.311856-2.41560.009385
32-0.337492-2.61420.005646
33-0.345949-2.67970.004749
34-0.350766-2.7170.004298
35-0.352524-2.73060.004143
36-0.370298-2.86830.002844
37-0.39413-3.05290.001688
38-0.41499-3.21450.001052
39-0.41783-3.23650.000986
40-0.403665-3.12680.001362
41-0.36936-2.8610.002902
42-0.335104-2.59570.005926
43-0.308072-2.38630.010095
44-0.27983-2.16760.017086
45-0.244745-1.89580.031404
46-0.203424-1.57570.060175
47-0.163586-1.26710.105003
48-0.132785-1.02860.15391


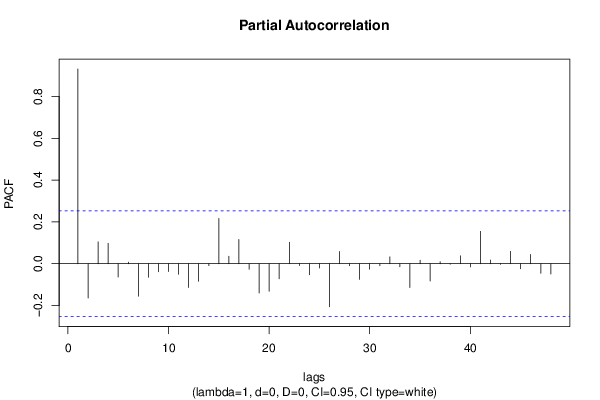
Partial Autocorrelation Function
Time lag kPACF(k)T-STATP-value
10.9313457.21420
2-0.163647-1.26760.104919
30.1044470.8090.210844
40.0974640.7550.226616
5-0.063482-0.49170.312352
60.0075630.05860.476741
7-0.154906-1.19990.117448
8-0.064391-0.49880.309883
9-0.038391-0.29740.383602
10-0.037284-0.28880.386866
11-0.050367-0.39010.348907
12-0.11331-0.87770.191806
13-0.083518-0.64690.260072
14-0.009237-0.07160.471598
150.2164011.67620.049448
160.0360510.27930.390506
170.1161640.89980.18591
18-0.026628-0.20630.418642
19-0.140216-1.08610.140888
20-0.131634-1.01960.155999
21-0.071731-0.55560.290266
220.1026270.79490.21489
23-0.008656-0.0670.473383
24-0.052743-0.40850.342163
25-0.020108-0.15580.438373
26-0.205845-1.59450.058043
270.0589050.45630.324918
28-0.010041-0.07780.469132
29-0.074809-0.57950.282221
30-0.025925-0.20080.420763
31-0.009981-0.07730.469316
320.0329310.25510.399766
33-0.014766-0.11440.45466
34-0.113883-0.88210.190612
350.0170510.13210.447682
36-0.082484-0.63890.262654
370.0092790.07190.47147
38-0.00272-0.02110.491629
390.0377210.29220.385575
40-0.015059-0.11660.453766
410.1547511.19870.117679
420.0182310.14120.444086
43-0.003114-0.02410.490418
440.0590440.45740.324534
45-0.023889-0.1850.426909
460.0444540.34430.365897
47-0.045859-0.35520.361834
48-0.048807-0.37810.353362

\begin{tabular}{lllllllll}
\hline
Partial Autocorrelation Function \tabularnewline
Time lag k & PACF(k) & T-STAT & P-value \tabularnewline
1 & 0.931345 & 7.2142 & 0 \tabularnewline
2 & -0.163647 & -1.2676 & 0.104919 \tabularnewline
3 & 0.104447 & 0.809 & 0.210844 \tabularnewline
4 & 0.097464 & 0.755 & 0.226616 \tabularnewline
5 & -0.063482 & -0.4917 & 0.312352 \tabularnewline
6 & 0.007563 & 0.0586 & 0.476741 \tabularnewline
7 & -0.154906 & -1.1999 & 0.117448 \tabularnewline
8 & -0.064391 & -0.4988 & 0.309883 \tabularnewline
9 & -0.038391 & -0.2974 & 0.383602 \tabularnewline
10 & -0.037284 & -0.2888 & 0.386866 \tabularnewline
11 & -0.050367 & -0.3901 & 0.348907 \tabularnewline
12 & -0.11331 & -0.8777 & 0.191806 \tabularnewline
13 & -0.083518 & -0.6469 & 0.260072 \tabularnewline
14 & -0.009237 & -0.0716 & 0.471598 \tabularnewline
15 & 0.216401 & 1.6762 & 0.049448 \tabularnewline
16 & 0.036051 & 0.2793 & 0.390506 \tabularnewline
17 & 0.116164 & 0.8998 & 0.18591 \tabularnewline
18 & -0.026628 & -0.2063 & 0.418642 \tabularnewline
19 & -0.140216 & -1.0861 & 0.140888 \tabularnewline
20 & -0.131634 & -1.0196 & 0.155999 \tabularnewline
21 & -0.071731 & -0.5556 & 0.290266 \tabularnewline
22 & 0.102627 & 0.7949 & 0.21489 \tabularnewline
23 & -0.008656 & -0.067 & 0.473383 \tabularnewline
24 & -0.052743 & -0.4085 & 0.342163 \tabularnewline
25 & -0.020108 & -0.1558 & 0.438373 \tabularnewline
26 & -0.205845 & -1.5945 & 0.058043 \tabularnewline
27 & 0.058905 & 0.4563 & 0.324918 \tabularnewline
28 & -0.010041 & -0.0778 & 0.469132 \tabularnewline
29 & -0.074809 & -0.5795 & 0.282221 \tabularnewline
30 & -0.025925 & -0.2008 & 0.420763 \tabularnewline
31 & -0.009981 & -0.0773 & 0.469316 \tabularnewline
32 & 0.032931 & 0.2551 & 0.399766 \tabularnewline
33 & -0.014766 & -0.1144 & 0.45466 \tabularnewline
34 & -0.113883 & -0.8821 & 0.190612 \tabularnewline
35 & 0.017051 & 0.1321 & 0.447682 \tabularnewline
36 & -0.082484 & -0.6389 & 0.262654 \tabularnewline
37 & 0.009279 & 0.0719 & 0.47147 \tabularnewline
38 & -0.00272 & -0.0211 & 0.491629 \tabularnewline
39 & 0.037721 & 0.2922 & 0.385575 \tabularnewline
40 & -0.015059 & -0.1166 & 0.453766 \tabularnewline
41 & 0.154751 & 1.1987 & 0.117679 \tabularnewline
42 & 0.018231 & 0.1412 & 0.444086 \tabularnewline
43 & -0.003114 & -0.0241 & 0.490418 \tabularnewline
44 & 0.059044 & 0.4574 & 0.324534 \tabularnewline
45 & -0.023889 & -0.185 & 0.426909 \tabularnewline
46 & 0.044454 & 0.3443 & 0.365897 \tabularnewline
47 & -0.045859 & -0.3552 & 0.361834 \tabularnewline
48 & -0.048807 & -0.3781 & 0.353362 \tabularnewline
\hline
\end{tabular}
%Source: https://freestatistics.org/blog/index.php?pk=282881&T=2

[TABLE]
[ROW][C]Partial Autocorrelation Function[/C][/ROW]
[ROW][C]Time lag k[/C][C]PACF(k)[/C][C]T-STAT[/C][C]P-value[/C][/ROW]
[ROW][C]1[/C][C]0.931345[/C][C]7.2142[/C][C]0[/C][/ROW]
[ROW][C]2[/C][C]-0.163647[/C][C]-1.2676[/C][C]0.104919[/C][/ROW]
[ROW][C]3[/C][C]0.104447[/C][C]0.809[/C][C]0.210844[/C][/ROW]
[ROW][C]4[/C][C]0.097464[/C][C]0.755[/C][C]0.226616[/C][/ROW]
[ROW][C]5[/C][C]-0.063482[/C][C]-0.4917[/C][C]0.312352[/C][/ROW]
[ROW][C]6[/C][C]0.007563[/C][C]0.0586[/C][C]0.476741[/C][/ROW]
[ROW][C]7[/C][C]-0.154906[/C][C]-1.1999[/C][C]0.117448[/C][/ROW]
[ROW][C]8[/C][C]-0.064391[/C][C]-0.4988[/C][C]0.309883[/C][/ROW]
[ROW][C]9[/C][C]-0.038391[/C][C]-0.2974[/C][C]0.383602[/C][/ROW]
[ROW][C]10[/C][C]-0.037284[/C][C]-0.2888[/C][C]0.386866[/C][/ROW]
[ROW][C]11[/C][C]-0.050367[/C][C]-0.3901[/C][C]0.348907[/C][/ROW]
[ROW][C]12[/C][C]-0.11331[/C][C]-0.8777[/C][C]0.191806[/C][/ROW]
[ROW][C]13[/C][C]-0.083518[/C][C]-0.6469[/C][C]0.260072[/C][/ROW]
[ROW][C]14[/C][C]-0.009237[/C][C]-0.0716[/C][C]0.471598[/C][/ROW]
[ROW][C]15[/C][C]0.216401[/C][C]1.6762[/C][C]0.049448[/C][/ROW]
[ROW][C]16[/C][C]0.036051[/C][C]0.2793[/C][C]0.390506[/C][/ROW]
[ROW][C]17[/C][C]0.116164[/C][C]0.8998[/C][C]0.18591[/C][/ROW]
[ROW][C]18[/C][C]-0.026628[/C][C]-0.2063[/C][C]0.418642[/C][/ROW]
[ROW][C]19[/C][C]-0.140216[/C][C]-1.0861[/C][C]0.140888[/C][/ROW]
[ROW][C]20[/C][C]-0.131634[/C][C]-1.0196[/C][C]0.155999[/C][/ROW]
[ROW][C]21[/C][C]-0.071731[/C][C]-0.5556[/C][C]0.290266[/C][/ROW]
[ROW][C]22[/C][C]0.102627[/C][C]0.7949[/C][C]0.21489[/C][/ROW]
[ROW][C]23[/C][C]-0.008656[/C][C]-0.067[/C][C]0.473383[/C][/ROW]
[ROW][C]24[/C][C]-0.052743[/C][C]-0.4085[/C][C]0.342163[/C][/ROW]
[ROW][C]25[/C][C]-0.020108[/C][C]-0.1558[/C][C]0.438373[/C][/ROW]
[ROW][C]26[/C][C]-0.205845[/C][C]-1.5945[/C][C]0.058043[/C][/ROW]
[ROW][C]27[/C][C]0.058905[/C][C]0.4563[/C][C]0.324918[/C][/ROW]
[ROW][C]28[/C][C]-0.010041[/C][C]-0.0778[/C][C]0.469132[/C][/ROW]
[ROW][C]29[/C][C]-0.074809[/C][C]-0.5795[/C][C]0.282221[/C][/ROW]
[ROW][C]30[/C][C]-0.025925[/C][C]-0.2008[/C][C]0.420763[/C][/ROW]
[ROW][C]31[/C][C]-0.009981[/C][C]-0.0773[/C][C]0.469316[/C][/ROW]
[ROW][C]32[/C][C]0.032931[/C][C]0.2551[/C][C]0.399766[/C][/ROW]
[ROW][C]33[/C][C]-0.014766[/C][C]-0.1144[/C][C]0.45466[/C][/ROW]
[ROW][C]34[/C][C]-0.113883[/C][C]-0.8821[/C][C]0.190612[/C][/ROW]
[ROW][C]35[/C][C]0.017051[/C][C]0.1321[/C][C]0.447682[/C][/ROW]
[ROW][C]36[/C][C]-0.082484[/C][C]-0.6389[/C][C]0.262654[/C][/ROW]
[ROW][C]37[/C][C]0.009279[/C][C]0.0719[/C][C]0.47147[/C][/ROW]
[ROW][C]38[/C][C]-0.00272[/C][C]-0.0211[/C][C]0.491629[/C][/ROW]
[ROW][C]39[/C][C]0.037721[/C][C]0.2922[/C][C]0.385575[/C][/ROW]
[ROW][C]40[/C][C]-0.015059[/C][C]-0.1166[/C][C]0.453766[/C][/ROW]
[ROW][C]41[/C][C]0.154751[/C][C]1.1987[/C][C]0.117679[/C][/ROW]
[ROW][C]42[/C][C]0.018231[/C][C]0.1412[/C][C]0.444086[/C][/ROW]
[ROW][C]43[/C][C]-0.003114[/C][C]-0.0241[/C][C]0.490418[/C][/ROW]
[ROW][C]44[/C][C]0.059044[/C][C]0.4574[/C][C]0.324534[/C][/ROW]
[ROW][C]45[/C][C]-0.023889[/C][C]-0.185[/C][C]0.426909[/C][/ROW]
[ROW][C]46[/C][C]0.044454[/C][C]0.3443[/C][C]0.365897[/C][/ROW]
[ROW][C]47[/C][C]-0.045859[/C][C]-0.3552[/C][C]0.361834[/C][/ROW]
[ROW][C]48[/C][C]-0.048807[/C][C]-0.3781[/C][C]0.353362[/C][/ROW]
[/TABLE]
Source: https://freestatistics.org/blog/index.php?pk=282881&T=2

Globally Unique Identifier (entire table): ba.freestatistics.org/blog/index.php?pk=282881&T=2

As an alternative you can also use a QR Code:  

The GUIDs for individual cells are displayed in the table below:

Partial Autocorrelation Function
Time lag kPACF(k)T-STATP-value
10.9313457.21420
2-0.163647-1.26760.104919
30.1044470.8090.210844
40.0974640.7550.226616
5-0.063482-0.49170.312352
60.0075630.05860.476741
7-0.154906-1.19990.117448
8-0.064391-0.49880.309883
9-0.038391-0.29740.383602
10-0.037284-0.28880.386866
11-0.050367-0.39010.348907
12-0.11331-0.87770.191806
13-0.083518-0.64690.260072
14-0.009237-0.07160.471598
150.2164011.67620.049448
160.0360510.27930.390506
170.1161640.89980.18591
18-0.026628-0.20630.418642
19-0.140216-1.08610.140888
20-0.131634-1.01960.155999
21-0.071731-0.55560.290266
220.1026270.79490.21489
23-0.008656-0.0670.473383
24-0.052743-0.40850.342163
25-0.020108-0.15580.438373
26-0.205845-1.59450.058043
270.0589050.45630.324918
28-0.010041-0.07780.469132
29-0.074809-0.57950.282221
30-0.025925-0.20080.420763
31-0.009981-0.07730.469316
320.0329310.25510.399766
33-0.014766-0.11440.45466
34-0.113883-0.88210.190612
350.0170510.13210.447682
36-0.082484-0.63890.262654
370.0092790.07190.47147
38-0.00272-0.02110.491629
390.0377210.29220.385575
40-0.015059-0.11660.453766
410.1547511.19870.117679
420.0182310.14120.444086
43-0.003114-0.02410.490418
440.0590440.45740.324534
45-0.023889-0.1850.426909
460.0444540.34430.365897
47-0.045859-0.35520.361834
48-0.048807-0.37810.353362


Parameters (Session):
par1 = 48 ; par2 = 1 ; par3 = 0 ; par4 = 0 ; par5 = 12 ; par6 = White Noise ; par7 = 0.95 ;
Parameters (R input):
par1 = 48 ; par2 = 1 ; par3 = 0 ; par4 = 0 ; par5 = 12 ; par6 = White Noise ; par7 = 0.95 ; par8 = ;
R code (references can be found in the software module):
if (par1 == 'Default') {
par1 = 10*log10(length(x))
} else {
par1 <- as.numeric(par1)
}
par2 <- as.numeric(par2)
par3 <- as.numeric(par3)
par4 <- as.numeric(par4)
par5 <- as.numeric(par5)
if (par6 == 'White Noise') par6 <- 'white' else par6 <- 'ma'
par7 <- as.numeric(par7)
if (par8 != '') par8 <- as.numeric(par8)
ox <- x
if (par8 == '') {
if (par2 == 0) {
x <- log(x)
} else {
x <- (x ^ par2 - 1) / par2
}
} else {
x <- log(x,base=par8)
}
if (par3 > 0) x <- diff(x,lag=1,difference=par3)
if (par4 > 0) x <- diff(x,lag=par5,difference=par4)
bitmap(file='picts.png')
op <- par(mfrow=c(2,1))
plot(ox,type='l',main='Original Time Series',xlab='time',ylab='value')
if (par8=='') {
mytitle <- paste('Working Time Series (lambda=',par2,', d=',par3,', D=',par4,')',sep='')
mysub <- paste('(lambda=',par2,', d=',par3,', D=',par4,', CI=', par7, ', CI type=',par6,')',sep='')
} else {
mytitle <- paste('Working Time Series (base=',par8,', d=',par3,', D=',par4,')',sep='')
mysub <- paste('(base=',par8,', d=',par3,', D=',par4,', CI=', par7, ', CI type=',par6,')',sep='')
}
plot(x,type='l', main=mytitle,xlab='time',ylab='value')
par(op)
dev.off()
bitmap(file='pic1.png')
racf <- acf(x, par1, main='Autocorrelation', xlab='time lag', ylab='ACF', ci.type=par6, ci=par7, sub=mysub)
dev.off()
bitmap(file='pic2.png')
rpacf <- pacf(x,par1,main='Partial Autocorrelation',xlab='lags',ylab='PACF',sub=mysub)
dev.off()
(myacf <- c(racf$acf))
(mypacf <- c(rpacf$acf))
lengthx <- length(x)
sqrtn <- sqrt(lengthx)
load(file='createtable')
a<-table.start()
a<-table.row.start(a)
a<-table.element(a,'Autocorrelation Function',4,TRUE)
a<-table.row.end(a)
a<-table.row.start(a)
a<-table.element(a,'Time lag k',header=TRUE)
a<-table.element(a,hyperlink('basics.htm','ACF(k)','click here for more information about the Autocorrelation Function'),header=TRUE)
a<-table.element(a,'T-STAT',header=TRUE)
a<-table.element(a,'P-value',header=TRUE)
a<-table.row.end(a)
for (i in 2:(par1+1)) {
a<-table.row.start(a)
a<-table.element(a,i-1,header=TRUE)
a<-table.element(a,round(myacf[i],6))
mytstat <- myacf[i]*sqrtn
a<-table.element(a,round(mytstat,4))
a<-table.element(a,round(1-pt(abs(mytstat),lengthx),6))
a<-table.row.end(a)
}
a<-table.end(a)
table.save(a,file='mytable.tab')
a<-table.start()
a<-table.row.start(a)
a<-table.element(a,'Partial Autocorrelation Function',4,TRUE)
a<-table.row.end(a)
a<-table.row.start(a)
a<-table.element(a,'Time lag k',header=TRUE)
a<-table.element(a,hyperlink('basics.htm','PACF(k)','click here for more information about the Partial Autocorrelation Function'),header=TRUE)
a<-table.element(a,'T-STAT',header=TRUE)
a<-table.element(a,'P-value',header=TRUE)
a<-table.row.end(a)
for (i in 1:par1) {
a<-table.row.start(a)
a<-table.element(a,i,header=TRUE)
a<-table.element(a,round(mypacf[i],6))
mytstat <- mypacf[i]*sqrtn
a<-table.element(a,round(mytstat,4))
a<-table.element(a,round(1-pt(abs(mytstat),lengthx),6))
a<-table.row.end(a)
}
a<-table.end(a)
table.save(a,file='mytable1.tab')