Free Statistics
of Irreproducible Research!
Description of Statistical Computation | |||||||||||||||||||||||||||||||||||||||||||||||||||||||||||||||||||||||||||
|---|---|---|---|---|---|---|---|---|---|---|---|---|---|---|---|---|---|---|---|---|---|---|---|---|---|---|---|---|---|---|---|---|---|---|---|---|---|---|---|---|---|---|---|---|---|---|---|---|---|---|---|---|---|---|---|---|---|---|---|---|---|---|---|---|---|---|---|---|---|---|---|---|---|---|---|
| Author's title | |||||||||||||||||||||||||||||||||||||||||||||||||||||||||||||||||||||||||||
| Author | *Unverified author* | ||||||||||||||||||||||||||||||||||||||||||||||||||||||||||||||||||||||||||
| R Software Module | rwasp_factor_analysis.wasp | ||||||||||||||||||||||||||||||||||||||||||||||||||||||||||||||||||||||||||
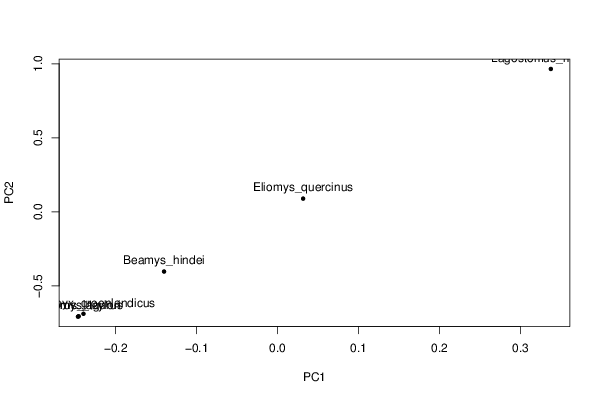
| Title produced by software | Factor Analysis | ||||||||||||||||||||||||||||||||||||||||||||||||||||||||||||||||||||||||||
| Date of computation | Fri, 23 Oct 2015 19:31:08 +0100 | ||||||||||||||||||||||||||||||||||||||||||||||||||||||||||||||||||||||||||
| Cite this page as follows | Statistical Computations at FreeStatistics.org, Office for Research Development and Education, URL https://freestatistics.org/blog/index.php?v=date/2015/Oct/23/t1445625173ifsyzsf3hohd1h6.htm/, Retrieved Tue, 14 May 2024 21:55:04 +0000 | ||||||||||||||||||||||||||||||||||||||||||||||||||||||||||||||||||||||||||
| Statistical Computations at FreeStatistics.org, Office for Research Development and Education, URL https://freestatistics.org/blog/index.php?pk=282961, Retrieved Tue, 14 May 2024 21:55:04 +0000 | |||||||||||||||||||||||||||||||||||||||||||||||||||||||||||||||||||||||||||
| QR Codes: | |||||||||||||||||||||||||||||||||||||||||||||||||||||||||||||||||||||||||||
|
| |||||||||||||||||||||||||||||||||||||||||||||||||||||||||||||||||||||||||||
| Original text written by user: | |||||||||||||||||||||||||||||||||||||||||||||||||||||||||||||||||||||||||||
| IsPrivate? | No (this computation is public) | ||||||||||||||||||||||||||||||||||||||||||||||||||||||||||||||||||||||||||
| User-defined keywords | F15, Ecology and Evolution, Rodentia, Pantheria, database | ||||||||||||||||||||||||||||||||||||||||||||||||||||||||||||||||||||||||||
| Estimated Impact | 73 | ||||||||||||||||||||||||||||||||||||||||||||||||||||||||||||||||||||||||||
Tree of Dependent Computations | |||||||||||||||||||||||||||||||||||||||||||||||||||||||||||||||||||||||||||
| Family? (F = Feedback message, R = changed R code, M = changed R Module, P = changed Parameters, D = changed Data) | |||||||||||||||||||||||||||||||||||||||||||||||||||||||||||||||||||||||||||
| - [Factor Analysis] [Pantheria Data Ro...] [2015-10-23 18:31:08] [d41d8cd98f00b204e9800998ecf8427e] [Current] | |||||||||||||||||||||||||||||||||||||||||||||||||||||||||||||||||||||||||||
| Feedback Forum | |||||||||||||||||||||||||||||||||||||||||||||||||||||||||||||||||||||||||||
Post a new message | |||||||||||||||||||||||||||||||||||||||||||||||||||||||||||||||||||||||||||
Dataset | |||||||||||||||||||||||||||||||||||||||||||||||||||||||||||||||||||||||||||
| Dataseries X: | |||||||||||||||||||||||||||||||||||||||||||||||||||||||||||||||||||||||||||
'Baiomys_taylori' 7.43 63.9 21.99 2.52 10 68.35 20.38 'Dicrostonyx_groenlandicus' 58.44 117.32 20.84 3.78 2 38.61 17.42 'Eliomys_quercinus' 114.61 138.74 22.97 4.99 1 566.36 34.8 'Lagostomus_maximus' 4660.94 523.73 155.73 1.93 1.25 287.76 55.68 'Lagurus_lagurus' 20.6 92.52 20.24 4 5.25 41.82 20.84 'Beamys_hindei' 75.8 149.23 22.79 3.49 5 181.13 38.49 1 2 3 'Chinchilla_chinchilla' 499.99 305 111 2.5 2.5 247.48 48.99 'Castor_canadensis' 18124.41 754.74 111.59 3.6 1 663.02 46.5 'Cricetomys_gambianus' 1267.52 362.64 31.45 3.11 2 177.08 34.54 'Cuniculus_paca' 8172.55 647.06 116.24 1.01 1.75 335.48 82.75 'Cynomys_gunnisoni' 797.93 279.12 29.64 4.48 1 395.29 36.65 'Cynomys_leucurus' 963.76 307.49 30.39 5.4 1 413.84 31.76 'Cynomys_ludovicianus' 797.05 294.04 33.46 4.43 1 696.9 45.57 'Dipodomys_deserti' 107.63 138.11 30.5 3.36 2.5 50.88 24.17 'Dipodomys_heermanni' 63.08 111.25 30.99 3.11 2 53.13 25.9 'Dipodomys_merriami' 37.91 98.54 30.77 2.39 1.75 67.11 20.42 'Dipodomys_microps' 56.26 112.47 30.99 2.37 1 147.92 21 'Dipodomys_spectabilis' 124.61 141.14 23.5 2.67 2 310.33 23.47 'Dolichotis_patagonum' 8000 663.84 97.97 1.75 3.5 216.03 76.28 | |||||||||||||||||||||||||||||||||||||||||||||||||||||||||||||||||||||||||||
Tables (Output of Computation) | |||||||||||||||||||||||||||||||||||||||||||||||||||||||||||||||||||||||||||
| |||||||||||||||||||||||||||||||||||||||||||||||||||||||||||||||||||||||||||
Figures (Output of Computation) | |||||||||||||||||||||||||||||||||||||||||||||||||||||||||||||||||||||||||||
Input Parameters & R Code | |||||||||||||||||||||||||||||||||||||||||||||||||||||||||||||||||||||||||||
| Parameters (Session): | |||||||||||||||||||||||||||||||||||||||||||||||||||||||||||||||||||||||||||
| par1 = 2 ; | |||||||||||||||||||||||||||||||||||||||||||||||||||||||||||||||||||||||||||
| Parameters (R input): | |||||||||||||||||||||||||||||||||||||||||||||||||||||||||||||||||||||||||||
| par1 = 2 ; | |||||||||||||||||||||||||||||||||||||||||||||||||||||||||||||||||||||||||||
| R code (references can be found in the software module): | |||||||||||||||||||||||||||||||||||||||||||||||||||||||||||||||||||||||||||
par1 <- '2' | |||||||||||||||||||||||||||||||||||||||||||||||||||||||||||||||||||||||||||