Free Statistics

of Irreproducible Research!

Author's title

Author*Unverified author*
R Software Modulerwasp_autocorrelation.wasp
Title produced by software(Partial) Autocorrelation Function
Date of computationFri, 23 Oct 2015 21:06:39 +0100
Cite this page as followsStatistical Computations at FreeStatistics.org, Office for Research Development and Education, URL https://freestatistics.org/blog/index.php?v=date/2015/Oct/23/t1445630825a0h4efkwo766ypr.htm/, Retrieved Tue, 14 May 2024 14:44:55 +0000
Statistical Computations at FreeStatistics.org, Office for Research Development and Education, URL https://freestatistics.org/blog/index.php?pk=282974, Retrieved Tue, 14 May 2024 14:44:55 +0000
QR Codes:

Original text written by user:
IsPrivate?No (this computation is public)
User-defined keywords
Estimated Impact85
Family? (F = Feedback message, R = changed R code, M = changed R Module, P = changed Parameters, D = changed Data)
-       [(Partial) Autocorrelation Function] [] [2015-10-23 20:06:39] [06d8efd1cada8e807c830d2ff46bf732] [Current]
Feedback Forum

Post a new message
Dataseries X:
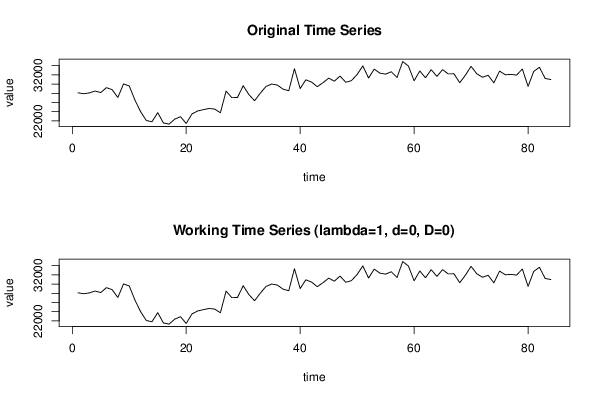
28100
27900
28078
28479
28156
29219
28782
27078
30031
29579
26532
23995
22067
21818
23787
21551
21309
22395
22906
21430
23492
24144
24438
24689
24569
23754
28473
27051
27081
29635
27715
26373
28009
29472
30005
29777
28886
28549
33348
29017
30924
30435
29431
30290
31286
30622
31742
30391
30740
32086
33947
31312
33239
32362
32170
32665
31412
34891
33919
30706
32846
31368
33130
31665
33139
32201
32230
30287
31918
33853
32232
31484
31902
30260
32823
32018
32100
31952
33274
29491
32751
33643
31226
30976


Summary of computational transaction
Raw Inputview raw input (R code)
Raw Outputview raw output of R engine
Computing time1 seconds
R Server'George Udny Yule' @ yule.wessa.net

\begin{tabular}{lllllllll}
\hline
Summary of computational transaction \tabularnewline
Raw Input & view raw input (R code)  \tabularnewline
Raw Output & view raw output of R engine  \tabularnewline
Computing time & 1 seconds \tabularnewline
R Server & 'George Udny Yule' @ yule.wessa.net \tabularnewline
\hline
\end{tabular}
%Source: https://freestatistics.org/blog/index.php?pk=282974&T=0

[TABLE]
[ROW][C]Summary of computational transaction[/C][/ROW]
[ROW][C]Raw Input[/C][C]view raw input (R code) [/C][/ROW]
[ROW][C]Raw Output[/C][C]view raw output of R engine [/C][/ROW]
[ROW][C]Computing time[/C][C]1 seconds[/C][/ROW]
[ROW][C]R Server[/C][C]'George Udny Yule' @ yule.wessa.net[/C][/ROW]
[/TABLE]
Source: https://freestatistics.org/blog/index.php?pk=282974&T=0

Globally Unique Identifier (entire table): ba.freestatistics.org/blog/index.php?pk=282974&T=0

As an alternative you can also use a QR Code:  

The GUIDs for individual cells are displayed in the table below:

Summary of computational transaction
Raw Inputview raw input (R code)
Raw Outputview raw output of R engine
Computing time1 seconds
R Server'George Udny Yule' @ yule.wessa.net


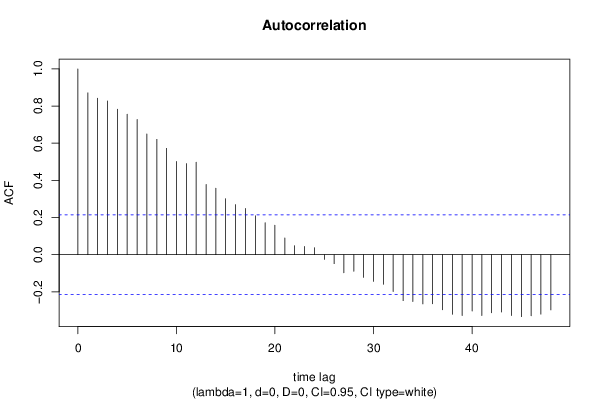
Autocorrelation Function
Time lag kACF(k)T-STATP-value
10.8713587.98610
20.8420347.71740
30.8277277.58620
40.7829247.17560
50.7560156.9290
60.7278576.67090
70.6501645.95890
80.6208945.69060
90.5723655.24581e-06
100.5019234.60027e-06
110.4903314.4941.1e-05
120.497494.55969e-06
130.3782083.46630.000417
140.3572733.27450.000769
150.3008062.75690.003578
160.269682.47170.007734
170.248712.27950.012587
180.2089251.91480.029459
190.1717141.57380.059648
200.158551.45310.074957
210.0897770.82280.20647
220.048460.44410.329042
230.043750.4010.344727
240.0373290.34210.366556
25-0.025372-0.23250.408341
26-0.048447-0.4440.329085
27-0.097649-0.8950.186681
28-0.08946-0.81990.207293
29-0.122373-1.12160.132621
30-0.143816-1.31810.095527
31-0.159138-1.45850.074213
32-0.198428-1.81860.036267
33-0.247737-2.27050.012867
34-0.252188-2.31130.011632
35-0.265172-2.43030.008607
36-0.264542-2.42460.008736
37-0.297078-2.72280.003936
38-0.320833-2.94050.002116
39-0.327453-3.00120.00177
40-0.303649-2.7830.003326
41-0.32725-2.99930.00178
42-0.312822-2.86710.002618
43-0.308912-2.83120.002901
44-0.327728-3.00370.001757
45-0.333796-3.05930.001489
46-0.328622-3.01190.001715
47-0.320273-2.93540.002148
48-0.297276-2.72460.003916

\begin{tabular}{lllllllll}
\hline
Autocorrelation Function \tabularnewline
Time lag k & ACF(k) & T-STAT & P-value \tabularnewline
1 & 0.871358 & 7.9861 & 0 \tabularnewline
2 & 0.842034 & 7.7174 & 0 \tabularnewline
3 & 0.827727 & 7.5862 & 0 \tabularnewline
4 & 0.782924 & 7.1756 & 0 \tabularnewline
5 & 0.756015 & 6.929 & 0 \tabularnewline
6 & 0.727857 & 6.6709 & 0 \tabularnewline
7 & 0.650164 & 5.9589 & 0 \tabularnewline
8 & 0.620894 & 5.6906 & 0 \tabularnewline
9 & 0.572365 & 5.2458 & 1e-06 \tabularnewline
10 & 0.501923 & 4.6002 & 7e-06 \tabularnewline
11 & 0.490331 & 4.494 & 1.1e-05 \tabularnewline
12 & 0.49749 & 4.5596 & 9e-06 \tabularnewline
13 & 0.378208 & 3.4663 & 0.000417 \tabularnewline
14 & 0.357273 & 3.2745 & 0.000769 \tabularnewline
15 & 0.300806 & 2.7569 & 0.003578 \tabularnewline
16 & 0.26968 & 2.4717 & 0.007734 \tabularnewline
17 & 0.24871 & 2.2795 & 0.012587 \tabularnewline
18 & 0.208925 & 1.9148 & 0.029459 \tabularnewline
19 & 0.171714 & 1.5738 & 0.059648 \tabularnewline
20 & 0.15855 & 1.4531 & 0.074957 \tabularnewline
21 & 0.089777 & 0.8228 & 0.20647 \tabularnewline
22 & 0.04846 & 0.4441 & 0.329042 \tabularnewline
23 & 0.04375 & 0.401 & 0.344727 \tabularnewline
24 & 0.037329 & 0.3421 & 0.366556 \tabularnewline
25 & -0.025372 & -0.2325 & 0.408341 \tabularnewline
26 & -0.048447 & -0.444 & 0.329085 \tabularnewline
27 & -0.097649 & -0.895 & 0.186681 \tabularnewline
28 & -0.08946 & -0.8199 & 0.207293 \tabularnewline
29 & -0.122373 & -1.1216 & 0.132621 \tabularnewline
30 & -0.143816 & -1.3181 & 0.095527 \tabularnewline
31 & -0.159138 & -1.4585 & 0.074213 \tabularnewline
32 & -0.198428 & -1.8186 & 0.036267 \tabularnewline
33 & -0.247737 & -2.2705 & 0.012867 \tabularnewline
34 & -0.252188 & -2.3113 & 0.011632 \tabularnewline
35 & -0.265172 & -2.4303 & 0.008607 \tabularnewline
36 & -0.264542 & -2.4246 & 0.008736 \tabularnewline
37 & -0.297078 & -2.7228 & 0.003936 \tabularnewline
38 & -0.320833 & -2.9405 & 0.002116 \tabularnewline
39 & -0.327453 & -3.0012 & 0.00177 \tabularnewline
40 & -0.303649 & -2.783 & 0.003326 \tabularnewline
41 & -0.32725 & -2.9993 & 0.00178 \tabularnewline
42 & -0.312822 & -2.8671 & 0.002618 \tabularnewline
43 & -0.308912 & -2.8312 & 0.002901 \tabularnewline
44 & -0.327728 & -3.0037 & 0.001757 \tabularnewline
45 & -0.333796 & -3.0593 & 0.001489 \tabularnewline
46 & -0.328622 & -3.0119 & 0.001715 \tabularnewline
47 & -0.320273 & -2.9354 & 0.002148 \tabularnewline
48 & -0.297276 & -2.7246 & 0.003916 \tabularnewline
\hline
\end{tabular}
%Source: https://freestatistics.org/blog/index.php?pk=282974&T=1

[TABLE]
[ROW][C]Autocorrelation Function[/C][/ROW]
[ROW][C]Time lag k[/C][C]ACF(k)[/C][C]T-STAT[/C][C]P-value[/C][/ROW]
[ROW][C]1[/C][C]0.871358[/C][C]7.9861[/C][C]0[/C][/ROW]
[ROW][C]2[/C][C]0.842034[/C][C]7.7174[/C][C]0[/C][/ROW]
[ROW][C]3[/C][C]0.827727[/C][C]7.5862[/C][C]0[/C][/ROW]
[ROW][C]4[/C][C]0.782924[/C][C]7.1756[/C][C]0[/C][/ROW]
[ROW][C]5[/C][C]0.756015[/C][C]6.929[/C][C]0[/C][/ROW]
[ROW][C]6[/C][C]0.727857[/C][C]6.6709[/C][C]0[/C][/ROW]
[ROW][C]7[/C][C]0.650164[/C][C]5.9589[/C][C]0[/C][/ROW]
[ROW][C]8[/C][C]0.620894[/C][C]5.6906[/C][C]0[/C][/ROW]
[ROW][C]9[/C][C]0.572365[/C][C]5.2458[/C][C]1e-06[/C][/ROW]
[ROW][C]10[/C][C]0.501923[/C][C]4.6002[/C][C]7e-06[/C][/ROW]
[ROW][C]11[/C][C]0.490331[/C][C]4.494[/C][C]1.1e-05[/C][/ROW]
[ROW][C]12[/C][C]0.49749[/C][C]4.5596[/C][C]9e-06[/C][/ROW]
[ROW][C]13[/C][C]0.378208[/C][C]3.4663[/C][C]0.000417[/C][/ROW]
[ROW][C]14[/C][C]0.357273[/C][C]3.2745[/C][C]0.000769[/C][/ROW]
[ROW][C]15[/C][C]0.300806[/C][C]2.7569[/C][C]0.003578[/C][/ROW]
[ROW][C]16[/C][C]0.26968[/C][C]2.4717[/C][C]0.007734[/C][/ROW]
[ROW][C]17[/C][C]0.24871[/C][C]2.2795[/C][C]0.012587[/C][/ROW]
[ROW][C]18[/C][C]0.208925[/C][C]1.9148[/C][C]0.029459[/C][/ROW]
[ROW][C]19[/C][C]0.171714[/C][C]1.5738[/C][C]0.059648[/C][/ROW]
[ROW][C]20[/C][C]0.15855[/C][C]1.4531[/C][C]0.074957[/C][/ROW]
[ROW][C]21[/C][C]0.089777[/C][C]0.8228[/C][C]0.20647[/C][/ROW]
[ROW][C]22[/C][C]0.04846[/C][C]0.4441[/C][C]0.329042[/C][/ROW]
[ROW][C]23[/C][C]0.04375[/C][C]0.401[/C][C]0.344727[/C][/ROW]
[ROW][C]24[/C][C]0.037329[/C][C]0.3421[/C][C]0.366556[/C][/ROW]
[ROW][C]25[/C][C]-0.025372[/C][C]-0.2325[/C][C]0.408341[/C][/ROW]
[ROW][C]26[/C][C]-0.048447[/C][C]-0.444[/C][C]0.329085[/C][/ROW]
[ROW][C]27[/C][C]-0.097649[/C][C]-0.895[/C][C]0.186681[/C][/ROW]
[ROW][C]28[/C][C]-0.08946[/C][C]-0.8199[/C][C]0.207293[/C][/ROW]
[ROW][C]29[/C][C]-0.122373[/C][C]-1.1216[/C][C]0.132621[/C][/ROW]
[ROW][C]30[/C][C]-0.143816[/C][C]-1.3181[/C][C]0.095527[/C][/ROW]
[ROW][C]31[/C][C]-0.159138[/C][C]-1.4585[/C][C]0.074213[/C][/ROW]
[ROW][C]32[/C][C]-0.198428[/C][C]-1.8186[/C][C]0.036267[/C][/ROW]
[ROW][C]33[/C][C]-0.247737[/C][C]-2.2705[/C][C]0.012867[/C][/ROW]
[ROW][C]34[/C][C]-0.252188[/C][C]-2.3113[/C][C]0.011632[/C][/ROW]
[ROW][C]35[/C][C]-0.265172[/C][C]-2.4303[/C][C]0.008607[/C][/ROW]
[ROW][C]36[/C][C]-0.264542[/C][C]-2.4246[/C][C]0.008736[/C][/ROW]
[ROW][C]37[/C][C]-0.297078[/C][C]-2.7228[/C][C]0.003936[/C][/ROW]
[ROW][C]38[/C][C]-0.320833[/C][C]-2.9405[/C][C]0.002116[/C][/ROW]
[ROW][C]39[/C][C]-0.327453[/C][C]-3.0012[/C][C]0.00177[/C][/ROW]
[ROW][C]40[/C][C]-0.303649[/C][C]-2.783[/C][C]0.003326[/C][/ROW]
[ROW][C]41[/C][C]-0.32725[/C][C]-2.9993[/C][C]0.00178[/C][/ROW]
[ROW][C]42[/C][C]-0.312822[/C][C]-2.8671[/C][C]0.002618[/C][/ROW]
[ROW][C]43[/C][C]-0.308912[/C][C]-2.8312[/C][C]0.002901[/C][/ROW]
[ROW][C]44[/C][C]-0.327728[/C][C]-3.0037[/C][C]0.001757[/C][/ROW]
[ROW][C]45[/C][C]-0.333796[/C][C]-3.0593[/C][C]0.001489[/C][/ROW]
[ROW][C]46[/C][C]-0.328622[/C][C]-3.0119[/C][C]0.001715[/C][/ROW]
[ROW][C]47[/C][C]-0.320273[/C][C]-2.9354[/C][C]0.002148[/C][/ROW]
[ROW][C]48[/C][C]-0.297276[/C][C]-2.7246[/C][C]0.003916[/C][/ROW]
[/TABLE]
Source: https://freestatistics.org/blog/index.php?pk=282974&T=1

Globally Unique Identifier (entire table): ba.freestatistics.org/blog/index.php?pk=282974&T=1

As an alternative you can also use a QR Code:  

The GUIDs for individual cells are displayed in the table below:

Autocorrelation Function
Time lag kACF(k)T-STATP-value
10.8713587.98610
20.8420347.71740
30.8277277.58620
40.7829247.17560
50.7560156.9290
60.7278576.67090
70.6501645.95890
80.6208945.69060
90.5723655.24581e-06
100.5019234.60027e-06
110.4903314.4941.1e-05
120.497494.55969e-06
130.3782083.46630.000417
140.3572733.27450.000769
150.3008062.75690.003578
160.269682.47170.007734
170.248712.27950.012587
180.2089251.91480.029459
190.1717141.57380.059648
200.158551.45310.074957
210.0897770.82280.20647
220.048460.44410.329042
230.043750.4010.344727
240.0373290.34210.366556
25-0.025372-0.23250.408341
26-0.048447-0.4440.329085
27-0.097649-0.8950.186681
28-0.08946-0.81990.207293
29-0.122373-1.12160.132621
30-0.143816-1.31810.095527
31-0.159138-1.45850.074213
32-0.198428-1.81860.036267
33-0.247737-2.27050.012867
34-0.252188-2.31130.011632
35-0.265172-2.43030.008607
36-0.264542-2.42460.008736
37-0.297078-2.72280.003936
38-0.320833-2.94050.002116
39-0.327453-3.00120.00177
40-0.303649-2.7830.003326
41-0.32725-2.99930.00178
42-0.312822-2.86710.002618
43-0.308912-2.83120.002901
44-0.327728-3.00370.001757
45-0.333796-3.05930.001489
46-0.328622-3.01190.001715
47-0.320273-2.93540.002148
48-0.297276-2.72460.003916


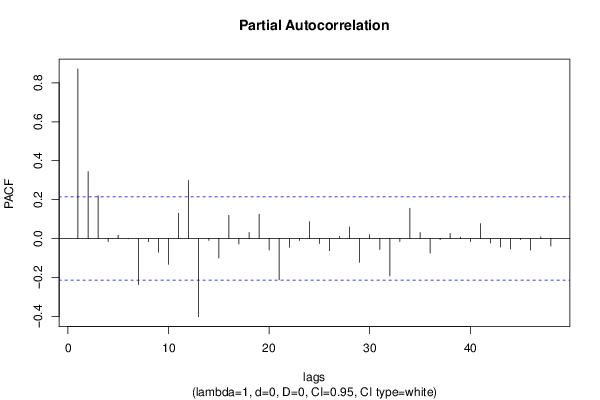
Partial Autocorrelation Function
Time lag kPACF(k)T-STATP-value
10.8713587.98610
20.343823.15120.001127
30.2199392.01580.02351
4-0.014929-0.13680.445748
50.0167330.15340.439241
6-0.001472-0.01350.494635
7-0.236451-2.16710.016529
8-0.015837-0.14510.442472
9-0.070499-0.64610.259978
10-0.132478-1.21420.114041
110.1300691.19210.118289
120.2982372.73340.003821
13-0.401296-3.67790.000207
14-0.00963-0.08830.464941
15-0.099386-0.91090.18248
160.1189211.08990.139432
17-0.028282-0.25920.398054
180.0308290.28260.389106
190.1250691.14630.127468
20-0.058655-0.53760.296143
21-0.211581-1.93920.027919
22-0.044711-0.40980.341505
23-0.010143-0.0930.463077
240.0865610.79330.214907
25-0.025467-0.23340.408005
26-0.062002-0.56830.285688
270.0103340.09470.462384
280.0594280.54470.293714
29-0.121793-1.11620.133749
300.0196110.17970.428895
31-0.055653-0.51010.30567
32-0.192905-1.7680.040346
33-0.01559-0.14290.443363
340.1557171.42720.078618
350.0310020.28410.388503
36-0.074077-0.67890.249525
37-0.005516-0.05060.479898
380.0263240.24130.404968
390.0082540.07570.469939
40-0.014857-0.13620.446006
410.0766140.70220.242255
42-0.022796-0.20890.417504
43-0.043205-0.3960.346562
44-0.053858-0.49360.311431
45-0.004769-0.04370.482621
46-0.058934-0.54010.295266
470.0086570.07930.468473
48-0.038794-0.35560.361534

\begin{tabular}{lllllllll}
\hline
Partial Autocorrelation Function \tabularnewline
Time lag k & PACF(k) & T-STAT & P-value \tabularnewline
1 & 0.871358 & 7.9861 & 0 \tabularnewline
2 & 0.34382 & 3.1512 & 0.001127 \tabularnewline
3 & 0.219939 & 2.0158 & 0.02351 \tabularnewline
4 & -0.014929 & -0.1368 & 0.445748 \tabularnewline
5 & 0.016733 & 0.1534 & 0.439241 \tabularnewline
6 & -0.001472 & -0.0135 & 0.494635 \tabularnewline
7 & -0.236451 & -2.1671 & 0.016529 \tabularnewline
8 & -0.015837 & -0.1451 & 0.442472 \tabularnewline
9 & -0.070499 & -0.6461 & 0.259978 \tabularnewline
10 & -0.132478 & -1.2142 & 0.114041 \tabularnewline
11 & 0.130069 & 1.1921 & 0.118289 \tabularnewline
12 & 0.298237 & 2.7334 & 0.003821 \tabularnewline
13 & -0.401296 & -3.6779 & 0.000207 \tabularnewline
14 & -0.00963 & -0.0883 & 0.464941 \tabularnewline
15 & -0.099386 & -0.9109 & 0.18248 \tabularnewline
16 & 0.118921 & 1.0899 & 0.139432 \tabularnewline
17 & -0.028282 & -0.2592 & 0.398054 \tabularnewline
18 & 0.030829 & 0.2826 & 0.389106 \tabularnewline
19 & 0.125069 & 1.1463 & 0.127468 \tabularnewline
20 & -0.058655 & -0.5376 & 0.296143 \tabularnewline
21 & -0.211581 & -1.9392 & 0.027919 \tabularnewline
22 & -0.044711 & -0.4098 & 0.341505 \tabularnewline
23 & -0.010143 & -0.093 & 0.463077 \tabularnewline
24 & 0.086561 & 0.7933 & 0.214907 \tabularnewline
25 & -0.025467 & -0.2334 & 0.408005 \tabularnewline
26 & -0.062002 & -0.5683 & 0.285688 \tabularnewline
27 & 0.010334 & 0.0947 & 0.462384 \tabularnewline
28 & 0.059428 & 0.5447 & 0.293714 \tabularnewline
29 & -0.121793 & -1.1162 & 0.133749 \tabularnewline
30 & 0.019611 & 0.1797 & 0.428895 \tabularnewline
31 & -0.055653 & -0.5101 & 0.30567 \tabularnewline
32 & -0.192905 & -1.768 & 0.040346 \tabularnewline
33 & -0.01559 & -0.1429 & 0.443363 \tabularnewline
34 & 0.155717 & 1.4272 & 0.078618 \tabularnewline
35 & 0.031002 & 0.2841 & 0.388503 \tabularnewline
36 & -0.074077 & -0.6789 & 0.249525 \tabularnewline
37 & -0.005516 & -0.0506 & 0.479898 \tabularnewline
38 & 0.026324 & 0.2413 & 0.404968 \tabularnewline
39 & 0.008254 & 0.0757 & 0.469939 \tabularnewline
40 & -0.014857 & -0.1362 & 0.446006 \tabularnewline
41 & 0.076614 & 0.7022 & 0.242255 \tabularnewline
42 & -0.022796 & -0.2089 & 0.417504 \tabularnewline
43 & -0.043205 & -0.396 & 0.346562 \tabularnewline
44 & -0.053858 & -0.4936 & 0.311431 \tabularnewline
45 & -0.004769 & -0.0437 & 0.482621 \tabularnewline
46 & -0.058934 & -0.5401 & 0.295266 \tabularnewline
47 & 0.008657 & 0.0793 & 0.468473 \tabularnewline
48 & -0.038794 & -0.3556 & 0.361534 \tabularnewline
\hline
\end{tabular}
%Source: https://freestatistics.org/blog/index.php?pk=282974&T=2

[TABLE]
[ROW][C]Partial Autocorrelation Function[/C][/ROW]
[ROW][C]Time lag k[/C][C]PACF(k)[/C][C]T-STAT[/C][C]P-value[/C][/ROW]
[ROW][C]1[/C][C]0.871358[/C][C]7.9861[/C][C]0[/C][/ROW]
[ROW][C]2[/C][C]0.34382[/C][C]3.1512[/C][C]0.001127[/C][/ROW]
[ROW][C]3[/C][C]0.219939[/C][C]2.0158[/C][C]0.02351[/C][/ROW]
[ROW][C]4[/C][C]-0.014929[/C][C]-0.1368[/C][C]0.445748[/C][/ROW]
[ROW][C]5[/C][C]0.016733[/C][C]0.1534[/C][C]0.439241[/C][/ROW]
[ROW][C]6[/C][C]-0.001472[/C][C]-0.0135[/C][C]0.494635[/C][/ROW]
[ROW][C]7[/C][C]-0.236451[/C][C]-2.1671[/C][C]0.016529[/C][/ROW]
[ROW][C]8[/C][C]-0.015837[/C][C]-0.1451[/C][C]0.442472[/C][/ROW]
[ROW][C]9[/C][C]-0.070499[/C][C]-0.6461[/C][C]0.259978[/C][/ROW]
[ROW][C]10[/C][C]-0.132478[/C][C]-1.2142[/C][C]0.114041[/C][/ROW]
[ROW][C]11[/C][C]0.130069[/C][C]1.1921[/C][C]0.118289[/C][/ROW]
[ROW][C]12[/C][C]0.298237[/C][C]2.7334[/C][C]0.003821[/C][/ROW]
[ROW][C]13[/C][C]-0.401296[/C][C]-3.6779[/C][C]0.000207[/C][/ROW]
[ROW][C]14[/C][C]-0.00963[/C][C]-0.0883[/C][C]0.464941[/C][/ROW]
[ROW][C]15[/C][C]-0.099386[/C][C]-0.9109[/C][C]0.18248[/C][/ROW]
[ROW][C]16[/C][C]0.118921[/C][C]1.0899[/C][C]0.139432[/C][/ROW]
[ROW][C]17[/C][C]-0.028282[/C][C]-0.2592[/C][C]0.398054[/C][/ROW]
[ROW][C]18[/C][C]0.030829[/C][C]0.2826[/C][C]0.389106[/C][/ROW]
[ROW][C]19[/C][C]0.125069[/C][C]1.1463[/C][C]0.127468[/C][/ROW]
[ROW][C]20[/C][C]-0.058655[/C][C]-0.5376[/C][C]0.296143[/C][/ROW]
[ROW][C]21[/C][C]-0.211581[/C][C]-1.9392[/C][C]0.027919[/C][/ROW]
[ROW][C]22[/C][C]-0.044711[/C][C]-0.4098[/C][C]0.341505[/C][/ROW]
[ROW][C]23[/C][C]-0.010143[/C][C]-0.093[/C][C]0.463077[/C][/ROW]
[ROW][C]24[/C][C]0.086561[/C][C]0.7933[/C][C]0.214907[/C][/ROW]
[ROW][C]25[/C][C]-0.025467[/C][C]-0.2334[/C][C]0.408005[/C][/ROW]
[ROW][C]26[/C][C]-0.062002[/C][C]-0.5683[/C][C]0.285688[/C][/ROW]
[ROW][C]27[/C][C]0.010334[/C][C]0.0947[/C][C]0.462384[/C][/ROW]
[ROW][C]28[/C][C]0.059428[/C][C]0.5447[/C][C]0.293714[/C][/ROW]
[ROW][C]29[/C][C]-0.121793[/C][C]-1.1162[/C][C]0.133749[/C][/ROW]
[ROW][C]30[/C][C]0.019611[/C][C]0.1797[/C][C]0.428895[/C][/ROW]
[ROW][C]31[/C][C]-0.055653[/C][C]-0.5101[/C][C]0.30567[/C][/ROW]
[ROW][C]32[/C][C]-0.192905[/C][C]-1.768[/C][C]0.040346[/C][/ROW]
[ROW][C]33[/C][C]-0.01559[/C][C]-0.1429[/C][C]0.443363[/C][/ROW]
[ROW][C]34[/C][C]0.155717[/C][C]1.4272[/C][C]0.078618[/C][/ROW]
[ROW][C]35[/C][C]0.031002[/C][C]0.2841[/C][C]0.388503[/C][/ROW]
[ROW][C]36[/C][C]-0.074077[/C][C]-0.6789[/C][C]0.249525[/C][/ROW]
[ROW][C]37[/C][C]-0.005516[/C][C]-0.0506[/C][C]0.479898[/C][/ROW]
[ROW][C]38[/C][C]0.026324[/C][C]0.2413[/C][C]0.404968[/C][/ROW]
[ROW][C]39[/C][C]0.008254[/C][C]0.0757[/C][C]0.469939[/C][/ROW]
[ROW][C]40[/C][C]-0.014857[/C][C]-0.1362[/C][C]0.446006[/C][/ROW]
[ROW][C]41[/C][C]0.076614[/C][C]0.7022[/C][C]0.242255[/C][/ROW]
[ROW][C]42[/C][C]-0.022796[/C][C]-0.2089[/C][C]0.417504[/C][/ROW]
[ROW][C]43[/C][C]-0.043205[/C][C]-0.396[/C][C]0.346562[/C][/ROW]
[ROW][C]44[/C][C]-0.053858[/C][C]-0.4936[/C][C]0.311431[/C][/ROW]
[ROW][C]45[/C][C]-0.004769[/C][C]-0.0437[/C][C]0.482621[/C][/ROW]
[ROW][C]46[/C][C]-0.058934[/C][C]-0.5401[/C][C]0.295266[/C][/ROW]
[ROW][C]47[/C][C]0.008657[/C][C]0.0793[/C][C]0.468473[/C][/ROW]
[ROW][C]48[/C][C]-0.038794[/C][C]-0.3556[/C][C]0.361534[/C][/ROW]
[/TABLE]
Source: https://freestatistics.org/blog/index.php?pk=282974&T=2

Globally Unique Identifier (entire table): ba.freestatistics.org/blog/index.php?pk=282974&T=2

As an alternative you can also use a QR Code:  

The GUIDs for individual cells are displayed in the table below:

Partial Autocorrelation Function
Time lag kPACF(k)T-STATP-value
10.8713587.98610
20.343823.15120.001127
30.2199392.01580.02351
4-0.014929-0.13680.445748
50.0167330.15340.439241
6-0.001472-0.01350.494635
7-0.236451-2.16710.016529
8-0.015837-0.14510.442472
9-0.070499-0.64610.259978
10-0.132478-1.21420.114041
110.1300691.19210.118289
120.2982372.73340.003821
13-0.401296-3.67790.000207
14-0.00963-0.08830.464941
15-0.099386-0.91090.18248
160.1189211.08990.139432
17-0.028282-0.25920.398054
180.0308290.28260.389106
190.1250691.14630.127468
20-0.058655-0.53760.296143
21-0.211581-1.93920.027919
22-0.044711-0.40980.341505
23-0.010143-0.0930.463077
240.0865610.79330.214907
25-0.025467-0.23340.408005
26-0.062002-0.56830.285688
270.0103340.09470.462384
280.0594280.54470.293714
29-0.121793-1.11620.133749
300.0196110.17970.428895
31-0.055653-0.51010.30567
32-0.192905-1.7680.040346
33-0.01559-0.14290.443363
340.1557171.42720.078618
350.0310020.28410.388503
36-0.074077-0.67890.249525
37-0.005516-0.05060.479898
380.0263240.24130.404968
390.0082540.07570.469939
40-0.014857-0.13620.446006
410.0766140.70220.242255
42-0.022796-0.20890.417504
43-0.043205-0.3960.346562
44-0.053858-0.49360.311431
45-0.004769-0.04370.482621
46-0.058934-0.54010.295266
470.0086570.07930.468473
48-0.038794-0.35560.361534


Parameters (Session):
par1 = 48 ; par2 = 1 ; par3 = 0 ; par4 = 0 ; par5 = 12 ; par6 = White Noise ; par7 = 0.95 ;
Parameters (R input):
par1 = 48 ; par2 = 1 ; par3 = 0 ; par4 = 0 ; par5 = 12 ; par6 = White Noise ; par7 = 0.95 ; par8 = ;
R code (references can be found in the software module):
par8 <- ''
par7 <- '0.95'
par6 <- 'White Noise'
par5 <- '12'
par4 <- '0'
par3 <- '0'
par2 <- '1'
par1 <- 'Default'
if (par1 == 'Default') {
par1 = 10*log10(length(x))
} else {
par1 <- as.numeric(par1)
}
par2 <- as.numeric(par2)
par3 <- as.numeric(par3)
par4 <- as.numeric(par4)
par5 <- as.numeric(par5)
if (par6 == 'White Noise') par6 <- 'white' else par6 <- 'ma'
par7 <- as.numeric(par7)
if (par8 != '') par8 <- as.numeric(par8)
ox <- x
if (par8 == '') {
if (par2 == 0) {
x <- log(x)
} else {
x <- (x ^ par2 - 1) / par2
}
} else {
x <- log(x,base=par8)
}
if (par3 > 0) x <- diff(x,lag=1,difference=par3)
if (par4 > 0) x <- diff(x,lag=par5,difference=par4)
bitmap(file='picts.png')
op <- par(mfrow=c(2,1))
plot(ox,type='l',main='Original Time Series',xlab='time',ylab='value')
if (par8=='') {
mytitle <- paste('Working Time Series (lambda=',par2,', d=',par3,', D=',par4,')',sep='')
mysub <- paste('(lambda=',par2,', d=',par3,', D=',par4,', CI=', par7, ', CI type=',par6,')',sep='')
} else {
mytitle <- paste('Working Time Series (base=',par8,', d=',par3,', D=',par4,')',sep='')
mysub <- paste('(base=',par8,', d=',par3,', D=',par4,', CI=', par7, ', CI type=',par6,')',sep='')
}
plot(x,type='l', main=mytitle,xlab='time',ylab='value')
par(op)
dev.off()
bitmap(file='pic1.png')
racf <- acf(x, par1, main='Autocorrelation', xlab='time lag', ylab='ACF', ci.type=par6, ci=par7, sub=mysub)
dev.off()
bitmap(file='pic2.png')
rpacf <- pacf(x,par1,main='Partial Autocorrelation',xlab='lags',ylab='PACF',sub=mysub)
dev.off()
(myacf <- c(racf$acf))
(mypacf <- c(rpacf$acf))
lengthx <- length(x)
sqrtn <- sqrt(lengthx)
load(file='createtable')
a<-table.start()
a<-table.row.start(a)
a<-table.element(a,'Autocorrelation Function',4,TRUE)
a<-table.row.end(a)
a<-table.row.start(a)
a<-table.element(a,'Time lag k',header=TRUE)
a<-table.element(a,hyperlink('basics.htm','ACF(k)','click here for more information about the Autocorrelation Function'),header=TRUE)
a<-table.element(a,'T-STAT',header=TRUE)
a<-table.element(a,'P-value',header=TRUE)
a<-table.row.end(a)
for (i in 2:(par1+1)) {
a<-table.row.start(a)
a<-table.element(a,i-1,header=TRUE)
a<-table.element(a,round(myacf[i],6))
mytstat <- myacf[i]*sqrtn
a<-table.element(a,round(mytstat,4))
a<-table.element(a,round(1-pt(abs(mytstat),lengthx),6))
a<-table.row.end(a)
}
a<-table.end(a)
table.save(a,file='mytable.tab')
a<-table.start()
a<-table.row.start(a)
a<-table.element(a,'Partial Autocorrelation Function',4,TRUE)
a<-table.row.end(a)
a<-table.row.start(a)
a<-table.element(a,'Time lag k',header=TRUE)
a<-table.element(a,hyperlink('basics.htm','PACF(k)','click here for more information about the Partial Autocorrelation Function'),header=TRUE)
a<-table.element(a,'T-STAT',header=TRUE)
a<-table.element(a,'P-value',header=TRUE)
a<-table.row.end(a)
for (i in 1:par1) {
a<-table.row.start(a)
a<-table.element(a,i,header=TRUE)
a<-table.element(a,round(mypacf[i],6))
mytstat <- mypacf[i]*sqrtn
a<-table.element(a,round(mytstat,4))
a<-table.element(a,round(1-pt(abs(mytstat),lengthx),6))
a<-table.row.end(a)
}
a<-table.end(a)
table.save(a,file='mytable1.tab')