Free Statistics

of Irreproducible Research!

Author's title

Author*Unverified author*
R Software Modulerwasp_autocorrelation.wasp
Title produced by software(Partial) Autocorrelation Function
Date of computationFri, 23 Oct 2015 21:46:07 +0100
Cite this page as followsStatistical Computations at FreeStatistics.org, Office for Research Development and Education, URL https://freestatistics.org/blog/index.php?v=date/2015/Oct/23/t1445633194ebef8zpx4rk3iov.htm/, Retrieved Tue, 14 May 2024 00:18:01 +0000
Statistical Computations at FreeStatistics.org, Office for Research Development and Education, URL https://freestatistics.org/blog/index.php?pk=282990, Retrieved Tue, 14 May 2024 00:18:01 +0000
QR Codes:

Original text written by user:
IsPrivate?No (this computation is public)
User-defined keywords
Estimated Impact83
Family? (F = Feedback message, R = changed R code, M = changed R Module, P = changed Parameters, D = changed Data)
-       [(Partial) Autocorrelation Function] [Autocorrelation 2...] [2015-10-23 20:46:07] [e4113772e8352caea1c7944bf41cc9e0] [Current]
Feedback Forum

Post a new message
Dataseries X:
789
811
996
778
603
990
735
800
706
766
870
647
726
784
884
696
893
674
703
799
793
799
1022
758
1021
944
915
864
1022
891
1087
822
890
1092
967
833
1104
1063
1103
1039
1185
1047
1155
878
879
1133
920
943
938
900
781
1040
792
653
866
679
799
760
699
762


Summary of computational transaction
Raw Inputview raw input (R code)
Raw Outputview raw output of R engine
Computing time2 seconds
R Server'Sir Ronald Aylmer Fisher' @ fisher.wessa.net

\begin{tabular}{lllllllll}
\hline
Summary of computational transaction \tabularnewline
Raw Input & view raw input (R code)  \tabularnewline
Raw Output & view raw output of R engine  \tabularnewline
Computing time & 2 seconds \tabularnewline
R Server & 'Sir Ronald Aylmer Fisher' @ fisher.wessa.net \tabularnewline
\hline
\end{tabular}
%Source: https://freestatistics.org/blog/index.php?pk=282990&T=0

[TABLE]
[ROW][C]Summary of computational transaction[/C][/ROW]
[ROW][C]Raw Input[/C][C]view raw input (R code) [/C][/ROW]
[ROW][C]Raw Output[/C][C]view raw output of R engine [/C][/ROW]
[ROW][C]Computing time[/C][C]2 seconds[/C][/ROW]
[ROW][C]R Server[/C][C]'Sir Ronald Aylmer Fisher' @ fisher.wessa.net[/C][/ROW]
[/TABLE]
Source: https://freestatistics.org/blog/index.php?pk=282990&T=0

Globally Unique Identifier (entire table): ba.freestatistics.org/blog/index.php?pk=282990&T=0

As an alternative you can also use a QR Code:  

The GUIDs for individual cells are displayed in the table below:

Summary of computational transaction
Raw Inputview raw input (R code)
Raw Outputview raw output of R engine
Computing time2 seconds
R Server'Sir Ronald Aylmer Fisher' @ fisher.wessa.net


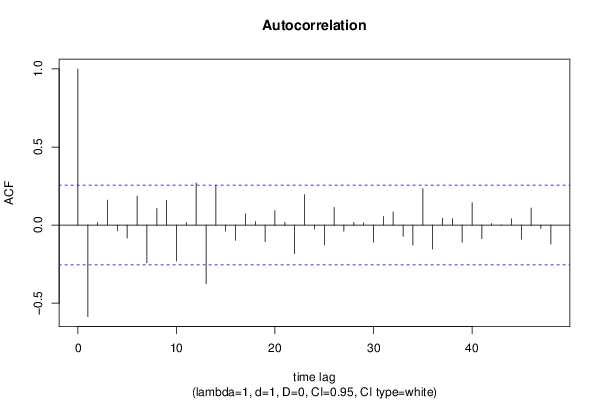
Autocorrelation Function
Time lag kACF(k)T-STATP-value
1-0.586467-4.50471.6e-05
20.0160850.12360.451044
30.1597511.22710.112334
4-0.036716-0.2820.389457
5-0.082531-0.63390.264288
60.1854031.42410.079842
7-0.241331-1.85370.034392
80.1064440.81760.208435
90.1582891.21580.114444
10-0.230187-1.76810.041107
110.0162060.12450.45068
120.2692892.06840.021495
13-0.374772-2.87870.002777
140.2540591.95150.027877
15-0.038677-0.29710.383723
16-0.096734-0.7430.230206
170.0716920.55070.291966
180.0228730.17570.430568
19-0.106854-0.82080.207543
200.0927640.71250.239471
210.018480.14190.443803
22-0.182967-1.40540.082574
230.1952511.49970.069506
24-0.02468-0.18960.425149
25-0.128094-0.98390.164589
260.1126120.8650.195274
27-0.039838-0.3060.380342
280.0172670.13260.447469
290.0147960.11360.454951
30-0.109458-0.84080.201937
310.0548040.4210.337659
320.0842520.64720.260021
33-0.072044-0.55340.291048
34-0.127843-0.9820.165059
350.2336841.7950.038891
36-0.153267-1.17730.121908
370.0440780.33860.368068
380.0416040.31960.375212
39-0.110671-0.85010.199359
400.1427551.09650.138653
41-0.086542-0.66470.254402
420.009480.07280.4711
430.000270.00210.499177
440.0397760.30550.380521
45-0.090154-0.69250.245675
460.1093110.83960.202252
47-0.02164-0.16620.434276
48-0.121084-0.93010.178064

\begin{tabular}{lllllllll}
\hline
Autocorrelation Function \tabularnewline
Time lag k & ACF(k) & T-STAT & P-value \tabularnewline
1 & -0.586467 & -4.5047 & 1.6e-05 \tabularnewline
2 & 0.016085 & 0.1236 & 0.451044 \tabularnewline
3 & 0.159751 & 1.2271 & 0.112334 \tabularnewline
4 & -0.036716 & -0.282 & 0.389457 \tabularnewline
5 & -0.082531 & -0.6339 & 0.264288 \tabularnewline
6 & 0.185403 & 1.4241 & 0.079842 \tabularnewline
7 & -0.241331 & -1.8537 & 0.034392 \tabularnewline
8 & 0.106444 & 0.8176 & 0.208435 \tabularnewline
9 & 0.158289 & 1.2158 & 0.114444 \tabularnewline
10 & -0.230187 & -1.7681 & 0.041107 \tabularnewline
11 & 0.016206 & 0.1245 & 0.45068 \tabularnewline
12 & 0.269289 & 2.0684 & 0.021495 \tabularnewline
13 & -0.374772 & -2.8787 & 0.002777 \tabularnewline
14 & 0.254059 & 1.9515 & 0.027877 \tabularnewline
15 & -0.038677 & -0.2971 & 0.383723 \tabularnewline
16 & -0.096734 & -0.743 & 0.230206 \tabularnewline
17 & 0.071692 & 0.5507 & 0.291966 \tabularnewline
18 & 0.022873 & 0.1757 & 0.430568 \tabularnewline
19 & -0.106854 & -0.8208 & 0.207543 \tabularnewline
20 & 0.092764 & 0.7125 & 0.239471 \tabularnewline
21 & 0.01848 & 0.1419 & 0.443803 \tabularnewline
22 & -0.182967 & -1.4054 & 0.082574 \tabularnewline
23 & 0.195251 & 1.4997 & 0.069506 \tabularnewline
24 & -0.02468 & -0.1896 & 0.425149 \tabularnewline
25 & -0.128094 & -0.9839 & 0.164589 \tabularnewline
26 & 0.112612 & 0.865 & 0.195274 \tabularnewline
27 & -0.039838 & -0.306 & 0.380342 \tabularnewline
28 & 0.017267 & 0.1326 & 0.447469 \tabularnewline
29 & 0.014796 & 0.1136 & 0.454951 \tabularnewline
30 & -0.109458 & -0.8408 & 0.201937 \tabularnewline
31 & 0.054804 & 0.421 & 0.337659 \tabularnewline
32 & 0.084252 & 0.6472 & 0.260021 \tabularnewline
33 & -0.072044 & -0.5534 & 0.291048 \tabularnewline
34 & -0.127843 & -0.982 & 0.165059 \tabularnewline
35 & 0.233684 & 1.795 & 0.038891 \tabularnewline
36 & -0.153267 & -1.1773 & 0.121908 \tabularnewline
37 & 0.044078 & 0.3386 & 0.368068 \tabularnewline
38 & 0.041604 & 0.3196 & 0.375212 \tabularnewline
39 & -0.110671 & -0.8501 & 0.199359 \tabularnewline
40 & 0.142755 & 1.0965 & 0.138653 \tabularnewline
41 & -0.086542 & -0.6647 & 0.254402 \tabularnewline
42 & 0.00948 & 0.0728 & 0.4711 \tabularnewline
43 & 0.00027 & 0.0021 & 0.499177 \tabularnewline
44 & 0.039776 & 0.3055 & 0.380521 \tabularnewline
45 & -0.090154 & -0.6925 & 0.245675 \tabularnewline
46 & 0.109311 & 0.8396 & 0.202252 \tabularnewline
47 & -0.02164 & -0.1662 & 0.434276 \tabularnewline
48 & -0.121084 & -0.9301 & 0.178064 \tabularnewline
\hline
\end{tabular}
%Source: https://freestatistics.org/blog/index.php?pk=282990&T=1

[TABLE]
[ROW][C]Autocorrelation Function[/C][/ROW]
[ROW][C]Time lag k[/C][C]ACF(k)[/C][C]T-STAT[/C][C]P-value[/C][/ROW]
[ROW][C]1[/C][C]-0.586467[/C][C]-4.5047[/C][C]1.6e-05[/C][/ROW]
[ROW][C]2[/C][C]0.016085[/C][C]0.1236[/C][C]0.451044[/C][/ROW]
[ROW][C]3[/C][C]0.159751[/C][C]1.2271[/C][C]0.112334[/C][/ROW]
[ROW][C]4[/C][C]-0.036716[/C][C]-0.282[/C][C]0.389457[/C][/ROW]
[ROW][C]5[/C][C]-0.082531[/C][C]-0.6339[/C][C]0.264288[/C][/ROW]
[ROW][C]6[/C][C]0.185403[/C][C]1.4241[/C][C]0.079842[/C][/ROW]
[ROW][C]7[/C][C]-0.241331[/C][C]-1.8537[/C][C]0.034392[/C][/ROW]
[ROW][C]8[/C][C]0.106444[/C][C]0.8176[/C][C]0.208435[/C][/ROW]
[ROW][C]9[/C][C]0.158289[/C][C]1.2158[/C][C]0.114444[/C][/ROW]
[ROW][C]10[/C][C]-0.230187[/C][C]-1.7681[/C][C]0.041107[/C][/ROW]
[ROW][C]11[/C][C]0.016206[/C][C]0.1245[/C][C]0.45068[/C][/ROW]
[ROW][C]12[/C][C]0.269289[/C][C]2.0684[/C][C]0.021495[/C][/ROW]
[ROW][C]13[/C][C]-0.374772[/C][C]-2.8787[/C][C]0.002777[/C][/ROW]
[ROW][C]14[/C][C]0.254059[/C][C]1.9515[/C][C]0.027877[/C][/ROW]
[ROW][C]15[/C][C]-0.038677[/C][C]-0.2971[/C][C]0.383723[/C][/ROW]
[ROW][C]16[/C][C]-0.096734[/C][C]-0.743[/C][C]0.230206[/C][/ROW]
[ROW][C]17[/C][C]0.071692[/C][C]0.5507[/C][C]0.291966[/C][/ROW]
[ROW][C]18[/C][C]0.022873[/C][C]0.1757[/C][C]0.430568[/C][/ROW]
[ROW][C]19[/C][C]-0.106854[/C][C]-0.8208[/C][C]0.207543[/C][/ROW]
[ROW][C]20[/C][C]0.092764[/C][C]0.7125[/C][C]0.239471[/C][/ROW]
[ROW][C]21[/C][C]0.01848[/C][C]0.1419[/C][C]0.443803[/C][/ROW]
[ROW][C]22[/C][C]-0.182967[/C][C]-1.4054[/C][C]0.082574[/C][/ROW]
[ROW][C]23[/C][C]0.195251[/C][C]1.4997[/C][C]0.069506[/C][/ROW]
[ROW][C]24[/C][C]-0.02468[/C][C]-0.1896[/C][C]0.425149[/C][/ROW]
[ROW][C]25[/C][C]-0.128094[/C][C]-0.9839[/C][C]0.164589[/C][/ROW]
[ROW][C]26[/C][C]0.112612[/C][C]0.865[/C][C]0.195274[/C][/ROW]
[ROW][C]27[/C][C]-0.039838[/C][C]-0.306[/C][C]0.380342[/C][/ROW]
[ROW][C]28[/C][C]0.017267[/C][C]0.1326[/C][C]0.447469[/C][/ROW]
[ROW][C]29[/C][C]0.014796[/C][C]0.1136[/C][C]0.454951[/C][/ROW]
[ROW][C]30[/C][C]-0.109458[/C][C]-0.8408[/C][C]0.201937[/C][/ROW]
[ROW][C]31[/C][C]0.054804[/C][C]0.421[/C][C]0.337659[/C][/ROW]
[ROW][C]32[/C][C]0.084252[/C][C]0.6472[/C][C]0.260021[/C][/ROW]
[ROW][C]33[/C][C]-0.072044[/C][C]-0.5534[/C][C]0.291048[/C][/ROW]
[ROW][C]34[/C][C]-0.127843[/C][C]-0.982[/C][C]0.165059[/C][/ROW]
[ROW][C]35[/C][C]0.233684[/C][C]1.795[/C][C]0.038891[/C][/ROW]
[ROW][C]36[/C][C]-0.153267[/C][C]-1.1773[/C][C]0.121908[/C][/ROW]
[ROW][C]37[/C][C]0.044078[/C][C]0.3386[/C][C]0.368068[/C][/ROW]
[ROW][C]38[/C][C]0.041604[/C][C]0.3196[/C][C]0.375212[/C][/ROW]
[ROW][C]39[/C][C]-0.110671[/C][C]-0.8501[/C][C]0.199359[/C][/ROW]
[ROW][C]40[/C][C]0.142755[/C][C]1.0965[/C][C]0.138653[/C][/ROW]
[ROW][C]41[/C][C]-0.086542[/C][C]-0.6647[/C][C]0.254402[/C][/ROW]
[ROW][C]42[/C][C]0.00948[/C][C]0.0728[/C][C]0.4711[/C][/ROW]
[ROW][C]43[/C][C]0.00027[/C][C]0.0021[/C][C]0.499177[/C][/ROW]
[ROW][C]44[/C][C]0.039776[/C][C]0.3055[/C][C]0.380521[/C][/ROW]
[ROW][C]45[/C][C]-0.090154[/C][C]-0.6925[/C][C]0.245675[/C][/ROW]
[ROW][C]46[/C][C]0.109311[/C][C]0.8396[/C][C]0.202252[/C][/ROW]
[ROW][C]47[/C][C]-0.02164[/C][C]-0.1662[/C][C]0.434276[/C][/ROW]
[ROW][C]48[/C][C]-0.121084[/C][C]-0.9301[/C][C]0.178064[/C][/ROW]
[/TABLE]
Source: https://freestatistics.org/blog/index.php?pk=282990&T=1

Globally Unique Identifier (entire table): ba.freestatistics.org/blog/index.php?pk=282990&T=1

As an alternative you can also use a QR Code:  

The GUIDs for individual cells are displayed in the table below:

Autocorrelation Function
Time lag kACF(k)T-STATP-value
1-0.586467-4.50471.6e-05
20.0160850.12360.451044
30.1597511.22710.112334
4-0.036716-0.2820.389457
5-0.082531-0.63390.264288
60.1854031.42410.079842
7-0.241331-1.85370.034392
80.1064440.81760.208435
90.1582891.21580.114444
10-0.230187-1.76810.041107
110.0162060.12450.45068
120.2692892.06840.021495
13-0.374772-2.87870.002777
140.2540591.95150.027877
15-0.038677-0.29710.383723
16-0.096734-0.7430.230206
170.0716920.55070.291966
180.0228730.17570.430568
19-0.106854-0.82080.207543
200.0927640.71250.239471
210.018480.14190.443803
22-0.182967-1.40540.082574
230.1952511.49970.069506
24-0.02468-0.18960.425149
25-0.128094-0.98390.164589
260.1126120.8650.195274
27-0.039838-0.3060.380342
280.0172670.13260.447469
290.0147960.11360.454951
30-0.109458-0.84080.201937
310.0548040.4210.337659
320.0842520.64720.260021
33-0.072044-0.55340.291048
34-0.127843-0.9820.165059
350.2336841.7950.038891
36-0.153267-1.17730.121908
370.0440780.33860.368068
380.0416040.31960.375212
39-0.110671-0.85010.199359
400.1427551.09650.138653
41-0.086542-0.66470.254402
420.009480.07280.4711
430.000270.00210.499177
440.0397760.30550.380521
45-0.090154-0.69250.245675
460.1093110.83960.202252
47-0.02164-0.16620.434276
48-0.121084-0.93010.178064


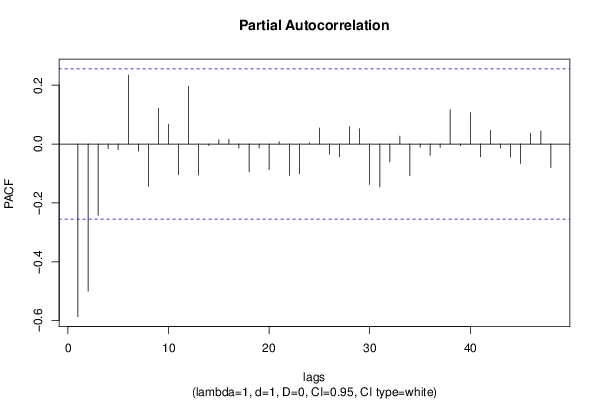
Partial Autocorrelation Function
Time lag kPACF(k)T-STATP-value
1-0.586467-4.50471.6e-05
2-0.49974-3.83860.000152
3-0.242133-1.85990.033946
4-0.016004-0.12290.45129
5-0.019353-0.14870.441168
60.2341131.79830.038626
7-0.024703-0.18980.425078
8-0.142968-1.09820.138298
90.1214620.9330.17732
100.0671930.51610.303851
11-0.104439-0.80220.212826
120.1960981.50630.068669
13-0.105345-0.80920.210834
14-0.004989-0.03830.48478
150.0144730.11120.455929
160.0160680.12340.451097
17-0.013253-0.10180.459632
18-0.09425-0.72390.235979
19-0.013541-0.1040.458758
20-0.086529-0.66460.254433
210.0079580.06110.475732
22-0.106825-0.82050.207607
23-0.101045-0.77610.220384
240.0036510.0280.488861
250.0545660.41910.338321
26-0.034905-0.26810.394776
27-0.043115-0.33120.370843
280.0591080.4540.325742
290.0522630.40140.344774
30-0.137615-1.0570.1474
31-0.145773-1.11970.133688
32-0.0604-0.46390.322199
330.0270490.20780.418062
34-0.107601-0.82650.205926
35-0.010419-0.080.468242
36-0.038006-0.29190.385684
37-0.011983-0.0920.463486
380.11670.89640.186843
39-0.005896-0.04530.482014
400.1071390.8230.206925
41-0.043447-0.33370.369885
420.0465480.35750.360982
43-0.013927-0.1070.457586
44-0.044298-0.34030.367434
45-0.066166-0.50820.306593
460.0364460.27990.390248
470.0444430.34140.367016
48-0.079935-0.6140.27079

\begin{tabular}{lllllllll}
\hline
Partial Autocorrelation Function \tabularnewline
Time lag k & PACF(k) & T-STAT & P-value \tabularnewline
1 & -0.586467 & -4.5047 & 1.6e-05 \tabularnewline
2 & -0.49974 & -3.8386 & 0.000152 \tabularnewline
3 & -0.242133 & -1.8599 & 0.033946 \tabularnewline
4 & -0.016004 & -0.1229 & 0.45129 \tabularnewline
5 & -0.019353 & -0.1487 & 0.441168 \tabularnewline
6 & 0.234113 & 1.7983 & 0.038626 \tabularnewline
7 & -0.024703 & -0.1898 & 0.425078 \tabularnewline
8 & -0.142968 & -1.0982 & 0.138298 \tabularnewline
9 & 0.121462 & 0.933 & 0.17732 \tabularnewline
10 & 0.067193 & 0.5161 & 0.303851 \tabularnewline
11 & -0.104439 & -0.8022 & 0.212826 \tabularnewline
12 & 0.196098 & 1.5063 & 0.068669 \tabularnewline
13 & -0.105345 & -0.8092 & 0.210834 \tabularnewline
14 & -0.004989 & -0.0383 & 0.48478 \tabularnewline
15 & 0.014473 & 0.1112 & 0.455929 \tabularnewline
16 & 0.016068 & 0.1234 & 0.451097 \tabularnewline
17 & -0.013253 & -0.1018 & 0.459632 \tabularnewline
18 & -0.09425 & -0.7239 & 0.235979 \tabularnewline
19 & -0.013541 & -0.104 & 0.458758 \tabularnewline
20 & -0.086529 & -0.6646 & 0.254433 \tabularnewline
21 & 0.007958 & 0.0611 & 0.475732 \tabularnewline
22 & -0.106825 & -0.8205 & 0.207607 \tabularnewline
23 & -0.101045 & -0.7761 & 0.220384 \tabularnewline
24 & 0.003651 & 0.028 & 0.488861 \tabularnewline
25 & 0.054566 & 0.4191 & 0.338321 \tabularnewline
26 & -0.034905 & -0.2681 & 0.394776 \tabularnewline
27 & -0.043115 & -0.3312 & 0.370843 \tabularnewline
28 & 0.059108 & 0.454 & 0.325742 \tabularnewline
29 & 0.052263 & 0.4014 & 0.344774 \tabularnewline
30 & -0.137615 & -1.057 & 0.1474 \tabularnewline
31 & -0.145773 & -1.1197 & 0.133688 \tabularnewline
32 & -0.0604 & -0.4639 & 0.322199 \tabularnewline
33 & 0.027049 & 0.2078 & 0.418062 \tabularnewline
34 & -0.107601 & -0.8265 & 0.205926 \tabularnewline
35 & -0.010419 & -0.08 & 0.468242 \tabularnewline
36 & -0.038006 & -0.2919 & 0.385684 \tabularnewline
37 & -0.011983 & -0.092 & 0.463486 \tabularnewline
38 & 0.1167 & 0.8964 & 0.186843 \tabularnewline
39 & -0.005896 & -0.0453 & 0.482014 \tabularnewline
40 & 0.107139 & 0.823 & 0.206925 \tabularnewline
41 & -0.043447 & -0.3337 & 0.369885 \tabularnewline
42 & 0.046548 & 0.3575 & 0.360982 \tabularnewline
43 & -0.013927 & -0.107 & 0.457586 \tabularnewline
44 & -0.044298 & -0.3403 & 0.367434 \tabularnewline
45 & -0.066166 & -0.5082 & 0.306593 \tabularnewline
46 & 0.036446 & 0.2799 & 0.390248 \tabularnewline
47 & 0.044443 & 0.3414 & 0.367016 \tabularnewline
48 & -0.079935 & -0.614 & 0.27079 \tabularnewline
\hline
\end{tabular}
%Source: https://freestatistics.org/blog/index.php?pk=282990&T=2

[TABLE]
[ROW][C]Partial Autocorrelation Function[/C][/ROW]
[ROW][C]Time lag k[/C][C]PACF(k)[/C][C]T-STAT[/C][C]P-value[/C][/ROW]
[ROW][C]1[/C][C]-0.586467[/C][C]-4.5047[/C][C]1.6e-05[/C][/ROW]
[ROW][C]2[/C][C]-0.49974[/C][C]-3.8386[/C][C]0.000152[/C][/ROW]
[ROW][C]3[/C][C]-0.242133[/C][C]-1.8599[/C][C]0.033946[/C][/ROW]
[ROW][C]4[/C][C]-0.016004[/C][C]-0.1229[/C][C]0.45129[/C][/ROW]
[ROW][C]5[/C][C]-0.019353[/C][C]-0.1487[/C][C]0.441168[/C][/ROW]
[ROW][C]6[/C][C]0.234113[/C][C]1.7983[/C][C]0.038626[/C][/ROW]
[ROW][C]7[/C][C]-0.024703[/C][C]-0.1898[/C][C]0.425078[/C][/ROW]
[ROW][C]8[/C][C]-0.142968[/C][C]-1.0982[/C][C]0.138298[/C][/ROW]
[ROW][C]9[/C][C]0.121462[/C][C]0.933[/C][C]0.17732[/C][/ROW]
[ROW][C]10[/C][C]0.067193[/C][C]0.5161[/C][C]0.303851[/C][/ROW]
[ROW][C]11[/C][C]-0.104439[/C][C]-0.8022[/C][C]0.212826[/C][/ROW]
[ROW][C]12[/C][C]0.196098[/C][C]1.5063[/C][C]0.068669[/C][/ROW]
[ROW][C]13[/C][C]-0.105345[/C][C]-0.8092[/C][C]0.210834[/C][/ROW]
[ROW][C]14[/C][C]-0.004989[/C][C]-0.0383[/C][C]0.48478[/C][/ROW]
[ROW][C]15[/C][C]0.014473[/C][C]0.1112[/C][C]0.455929[/C][/ROW]
[ROW][C]16[/C][C]0.016068[/C][C]0.1234[/C][C]0.451097[/C][/ROW]
[ROW][C]17[/C][C]-0.013253[/C][C]-0.1018[/C][C]0.459632[/C][/ROW]
[ROW][C]18[/C][C]-0.09425[/C][C]-0.7239[/C][C]0.235979[/C][/ROW]
[ROW][C]19[/C][C]-0.013541[/C][C]-0.104[/C][C]0.458758[/C][/ROW]
[ROW][C]20[/C][C]-0.086529[/C][C]-0.6646[/C][C]0.254433[/C][/ROW]
[ROW][C]21[/C][C]0.007958[/C][C]0.0611[/C][C]0.475732[/C][/ROW]
[ROW][C]22[/C][C]-0.106825[/C][C]-0.8205[/C][C]0.207607[/C][/ROW]
[ROW][C]23[/C][C]-0.101045[/C][C]-0.7761[/C][C]0.220384[/C][/ROW]
[ROW][C]24[/C][C]0.003651[/C][C]0.028[/C][C]0.488861[/C][/ROW]
[ROW][C]25[/C][C]0.054566[/C][C]0.4191[/C][C]0.338321[/C][/ROW]
[ROW][C]26[/C][C]-0.034905[/C][C]-0.2681[/C][C]0.394776[/C][/ROW]
[ROW][C]27[/C][C]-0.043115[/C][C]-0.3312[/C][C]0.370843[/C][/ROW]
[ROW][C]28[/C][C]0.059108[/C][C]0.454[/C][C]0.325742[/C][/ROW]
[ROW][C]29[/C][C]0.052263[/C][C]0.4014[/C][C]0.344774[/C][/ROW]
[ROW][C]30[/C][C]-0.137615[/C][C]-1.057[/C][C]0.1474[/C][/ROW]
[ROW][C]31[/C][C]-0.145773[/C][C]-1.1197[/C][C]0.133688[/C][/ROW]
[ROW][C]32[/C][C]-0.0604[/C][C]-0.4639[/C][C]0.322199[/C][/ROW]
[ROW][C]33[/C][C]0.027049[/C][C]0.2078[/C][C]0.418062[/C][/ROW]
[ROW][C]34[/C][C]-0.107601[/C][C]-0.8265[/C][C]0.205926[/C][/ROW]
[ROW][C]35[/C][C]-0.010419[/C][C]-0.08[/C][C]0.468242[/C][/ROW]
[ROW][C]36[/C][C]-0.038006[/C][C]-0.2919[/C][C]0.385684[/C][/ROW]
[ROW][C]37[/C][C]-0.011983[/C][C]-0.092[/C][C]0.463486[/C][/ROW]
[ROW][C]38[/C][C]0.1167[/C][C]0.8964[/C][C]0.186843[/C][/ROW]
[ROW][C]39[/C][C]-0.005896[/C][C]-0.0453[/C][C]0.482014[/C][/ROW]
[ROW][C]40[/C][C]0.107139[/C][C]0.823[/C][C]0.206925[/C][/ROW]
[ROW][C]41[/C][C]-0.043447[/C][C]-0.3337[/C][C]0.369885[/C][/ROW]
[ROW][C]42[/C][C]0.046548[/C][C]0.3575[/C][C]0.360982[/C][/ROW]
[ROW][C]43[/C][C]-0.013927[/C][C]-0.107[/C][C]0.457586[/C][/ROW]
[ROW][C]44[/C][C]-0.044298[/C][C]-0.3403[/C][C]0.367434[/C][/ROW]
[ROW][C]45[/C][C]-0.066166[/C][C]-0.5082[/C][C]0.306593[/C][/ROW]
[ROW][C]46[/C][C]0.036446[/C][C]0.2799[/C][C]0.390248[/C][/ROW]
[ROW][C]47[/C][C]0.044443[/C][C]0.3414[/C][C]0.367016[/C][/ROW]
[ROW][C]48[/C][C]-0.079935[/C][C]-0.614[/C][C]0.27079[/C][/ROW]
[/TABLE]
Source: https://freestatistics.org/blog/index.php?pk=282990&T=2

Globally Unique Identifier (entire table): ba.freestatistics.org/blog/index.php?pk=282990&T=2

As an alternative you can also use a QR Code:  

The GUIDs for individual cells are displayed in the table below:

Partial Autocorrelation Function
Time lag kPACF(k)T-STATP-value
1-0.586467-4.50471.6e-05
2-0.49974-3.83860.000152
3-0.242133-1.85990.033946
4-0.016004-0.12290.45129
5-0.019353-0.14870.441168
60.2341131.79830.038626
7-0.024703-0.18980.425078
8-0.142968-1.09820.138298
90.1214620.9330.17732
100.0671930.51610.303851
11-0.104439-0.80220.212826
120.1960981.50630.068669
13-0.105345-0.80920.210834
14-0.004989-0.03830.48478
150.0144730.11120.455929
160.0160680.12340.451097
17-0.013253-0.10180.459632
18-0.09425-0.72390.235979
19-0.013541-0.1040.458758
20-0.086529-0.66460.254433
210.0079580.06110.475732
22-0.106825-0.82050.207607
23-0.101045-0.77610.220384
240.0036510.0280.488861
250.0545660.41910.338321
26-0.034905-0.26810.394776
27-0.043115-0.33120.370843
280.0591080.4540.325742
290.0522630.40140.344774
30-0.137615-1.0570.1474
31-0.145773-1.11970.133688
32-0.0604-0.46390.322199
330.0270490.20780.418062
34-0.107601-0.82650.205926
35-0.010419-0.080.468242
36-0.038006-0.29190.385684
37-0.011983-0.0920.463486
380.11670.89640.186843
39-0.005896-0.04530.482014
400.1071390.8230.206925
41-0.043447-0.33370.369885
420.0465480.35750.360982
43-0.013927-0.1070.457586
44-0.044298-0.34030.367434
45-0.066166-0.50820.306593
460.0364460.27990.390248
470.0444430.34140.367016
48-0.079935-0.6140.27079


Parameters (Session):
par1 = 48 ; par2 = 1 ; par3 = 1 ; par4 = 0 ; par5 = 12 ; par6 = White Noise ; par7 = 0.95 ;
Parameters (R input):
par1 = 48 ; par2 = 1 ; par3 = 1 ; par4 = 0 ; par5 = 12 ; par6 = White Noise ; par7 = 0.95 ; par8 = ;
R code (references can be found in the software module):
par8 <- ''
par7 <- '0.95'
par6 <- 'White Noise'
par5 <- '12'
par4 <- '0'
par3 <- '0'
par2 <- '1'
par1 <- '48'
if (par1 == 'Default') {
par1 = 10*log10(length(x))
} else {
par1 <- as.numeric(par1)
}
par2 <- as.numeric(par2)
par3 <- as.numeric(par3)
par4 <- as.numeric(par4)
par5 <- as.numeric(par5)
if (par6 == 'White Noise') par6 <- 'white' else par6 <- 'ma'
par7 <- as.numeric(par7)
if (par8 != '') par8 <- as.numeric(par8)
ox <- x
if (par8 == '') {
if (par2 == 0) {
x <- log(x)
} else {
x <- (x ^ par2 - 1) / par2
}
} else {
x <- log(x,base=par8)
}
if (par3 > 0) x <- diff(x,lag=1,difference=par3)
if (par4 > 0) x <- diff(x,lag=par5,difference=par4)
bitmap(file='picts.png')
op <- par(mfrow=c(2,1))
plot(ox,type='l',main='Original Time Series',xlab='time',ylab='value')
if (par8=='') {
mytitle <- paste('Working Time Series (lambda=',par2,', d=',par3,', D=',par4,')',sep='')
mysub <- paste('(lambda=',par2,', d=',par3,', D=',par4,', CI=', par7, ', CI type=',par6,')',sep='')
} else {
mytitle <- paste('Working Time Series (base=',par8,', d=',par3,', D=',par4,')',sep='')
mysub <- paste('(base=',par8,', d=',par3,', D=',par4,', CI=', par7, ', CI type=',par6,')',sep='')
}
plot(x,type='l', main=mytitle,xlab='time',ylab='value')
par(op)
dev.off()
bitmap(file='pic1.png')
racf <- acf(x, par1, main='Autocorrelation', xlab='time lag', ylab='ACF', ci.type=par6, ci=par7, sub=mysub)
dev.off()
bitmap(file='pic2.png')
rpacf <- pacf(x,par1,main='Partial Autocorrelation',xlab='lags',ylab='PACF',sub=mysub)
dev.off()
(myacf <- c(racf$acf))
(mypacf <- c(rpacf$acf))
lengthx <- length(x)
sqrtn <- sqrt(lengthx)
load(file='createtable')
a<-table.start()
a<-table.row.start(a)
a<-table.element(a,'Autocorrelation Function',4,TRUE)
a<-table.row.end(a)
a<-table.row.start(a)
a<-table.element(a,'Time lag k',header=TRUE)
a<-table.element(a,hyperlink('basics.htm','ACF(k)','click here for more information about the Autocorrelation Function'),header=TRUE)
a<-table.element(a,'T-STAT',header=TRUE)
a<-table.element(a,'P-value',header=TRUE)
a<-table.row.end(a)
for (i in 2:(par1+1)) {
a<-table.row.start(a)
a<-table.element(a,i-1,header=TRUE)
a<-table.element(a,round(myacf[i],6))
mytstat <- myacf[i]*sqrtn
a<-table.element(a,round(mytstat,4))
a<-table.element(a,round(1-pt(abs(mytstat),lengthx),6))
a<-table.row.end(a)
}
a<-table.end(a)
table.save(a,file='mytable.tab')
a<-table.start()
a<-table.row.start(a)
a<-table.element(a,'Partial Autocorrelation Function',4,TRUE)
a<-table.row.end(a)
a<-table.row.start(a)
a<-table.element(a,'Time lag k',header=TRUE)
a<-table.element(a,hyperlink('basics.htm','PACF(k)','click here for more information about the Partial Autocorrelation Function'),header=TRUE)
a<-table.element(a,'T-STAT',header=TRUE)
a<-table.element(a,'P-value',header=TRUE)
a<-table.row.end(a)
for (i in 1:par1) {
a<-table.row.start(a)
a<-table.element(a,i,header=TRUE)
a<-table.element(a,round(mypacf[i],6))
mytstat <- mypacf[i]*sqrtn
a<-table.element(a,round(mytstat,4))
a<-table.element(a,round(1-pt(abs(mytstat),lengthx),6))
a<-table.row.end(a)
}
a<-table.end(a)
table.save(a,file='mytable1.tab')