Free Statistics

of Irreproducible Research!

Author's title

Author*Unverified author*
R Software Modulerwasp_autocorrelation.wasp
Title produced by software(Partial) Autocorrelation Function
Date of computationFri, 23 Oct 2015 21:59:33 +0100
Cite this page as followsStatistical Computations at FreeStatistics.org, Office for Research Development and Education, URL https://freestatistics.org/blog/index.php?v=date/2015/Oct/23/t14456339869sb69ve4hiozyxf.htm/, Retrieved Tue, 14 May 2024 18:35:44 +0000
Statistical Computations at FreeStatistics.org, Office for Research Development and Education, URL https://freestatistics.org/blog/index.php?pk=282991, Retrieved Tue, 14 May 2024 18:35:44 +0000
QR Codes:

Original text written by user:
IsPrivate?No (this computation is public)
User-defined keywords
Estimated Impact70
Family? (F = Feedback message, R = changed R code, M = changed R Module, P = changed Parameters, D = changed Data)
-       [(Partial) Autocorrelation Function] [] [2015-10-23 20:59:33] [52b8a1f318e0a92009217e543c58643f] [Current]
Feedback Forum

Post a new message
Dataseries X:
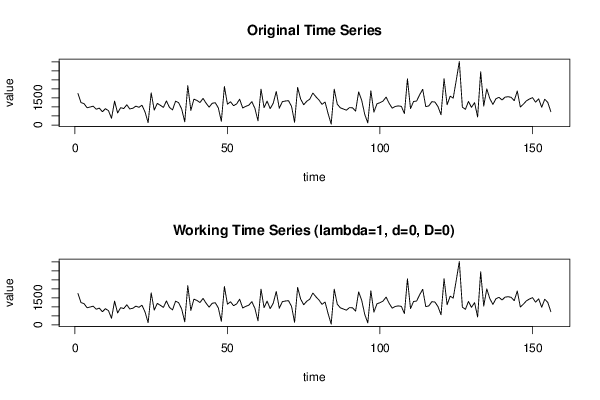
1747
1245
1182
958
1000
1044
875
939
736
905
796
372
1326
668
962
912
1119
891
931
1047
982
1098
714
128
1784
828
1199
1095
977
1338
975
840
1324
1236
883
177
2186
809
1434
1365
1247
1476
1211
990
1205
1238
952
204
2135
1157
1290
1071
1169
1431
945
1034
1100
1297
921
236
1990
966
1326
908
1206
1861
929
1296
1332
1352
1040
148
2090
1435
1124
1319
1436
1774
1566
1385
1147
1274
625
52
1990
1154
954
887
825
966
954
770
1838
1371
589
116
1898
712
1175
1240
1329
1550
1201
938
1030
1060
1035
635
2565
910
1304
1331
1681
1983
1021
1061
1292
1274
1024
568
2570
1125
1600
1492
2492
3523
990
869
1310
979
1244
442
2956
1055
2004
1462
1144
1454
1538
1388
1547
1570
1535
1352
1888
999
1158
1342
1443
1519
1267
1454
987
1430
1254
734


Summary of computational transaction
Raw Inputview raw input (R code)
Raw Outputview raw output of R engine
Computing time1 seconds
R Server'Gwilym Jenkins' @ jenkins.wessa.net

\begin{tabular}{lllllllll}
\hline
Summary of computational transaction \tabularnewline
Raw Input & view raw input (R code)  \tabularnewline
Raw Output & view raw output of R engine  \tabularnewline
Computing time & 1 seconds \tabularnewline
R Server & 'Gwilym Jenkins' @ jenkins.wessa.net \tabularnewline
\hline
\end{tabular}
%Source: https://freestatistics.org/blog/index.php?pk=282991&T=0

[TABLE]
[ROW][C]Summary of computational transaction[/C][/ROW]
[ROW][C]Raw Input[/C][C]view raw input (R code) [/C][/ROW]
[ROW][C]Raw Output[/C][C]view raw output of R engine [/C][/ROW]
[ROW][C]Computing time[/C][C]1 seconds[/C][/ROW]
[ROW][C]R Server[/C][C]'Gwilym Jenkins' @ jenkins.wessa.net[/C][/ROW]
[/TABLE]
Source: https://freestatistics.org/blog/index.php?pk=282991&T=0

Globally Unique Identifier (entire table): ba.freestatistics.org/blog/index.php?pk=282991&T=0

As an alternative you can also use a QR Code:  

The GUIDs for individual cells are displayed in the table below:

Summary of computational transaction
Raw Inputview raw input (R code)
Raw Outputview raw output of R engine
Computing time1 seconds
R Server'Gwilym Jenkins' @ jenkins.wessa.net


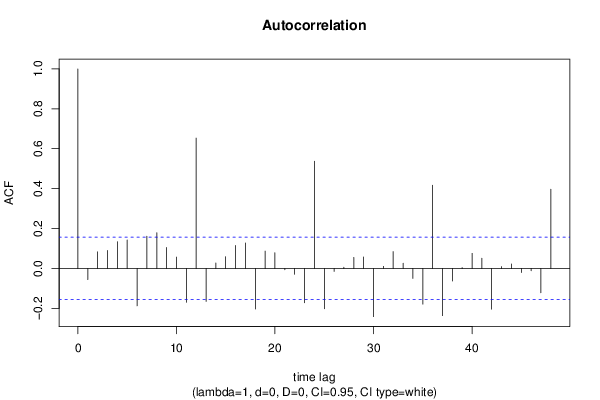
Autocorrelation Function
Time lag kACF(k)T-STATP-value
1-0.055971-0.69910.242771
20.0832511.03980.15002
30.0900751.1250.131152
40.1337441.67050.048416
50.1426911.78220.03833
6-0.187558-2.34260.010206
70.1609792.01060.023044
80.1785752.23040.013574
90.1050311.31180.095751
100.0569080.71080.239141
11-0.169335-2.1150.018009
120.6531398.15770
13-0.165161-2.06290.020392
140.0273230.34130.36668
150.0589530.73630.231321
160.1148221.43410.07677
170.1275351.59290.056601
18-0.203435-2.54090.006017
190.0870181.08690.139388
200.0783830.9790.164547
21-0.006736-0.08410.466528
22-0.029099-0.36340.358381
23-0.172336-2.15250.016449
240.5369916.7070
25-0.202154-2.52490.006286
26-0.014767-0.18440.426955
270.00620.07740.469189
280.0553270.6910.245284
290.0572270.71480.23791
30-0.241688-3.01870.001483
310.0104270.13020.448273
320.0842821.05270.147058
330.0262420.32780.371765
34-0.049999-0.62450.26661
35-0.178841-2.23370.013462
360.4166615.20410
37-0.236668-2.9560.0018
38-0.063146-0.78870.215745
390.0041840.05230.479196
400.0754860.94280.173617
410.0511630.6390.261872
42-0.204103-2.54920.00588
430.0091410.11420.454625
440.0226980.28350.388583
45-0.020234-0.25270.400408
46-0.011785-0.14720.441584
47-0.122195-1.52620.064491
480.3966724.95441e-06

\begin{tabular}{lllllllll}
\hline
Autocorrelation Function \tabularnewline
Time lag k & ACF(k) & T-STAT & P-value \tabularnewline
1 & -0.055971 & -0.6991 & 0.242771 \tabularnewline
2 & 0.083251 & 1.0398 & 0.15002 \tabularnewline
3 & 0.090075 & 1.125 & 0.131152 \tabularnewline
4 & 0.133744 & 1.6705 & 0.048416 \tabularnewline
5 & 0.142691 & 1.7822 & 0.03833 \tabularnewline
6 & -0.187558 & -2.3426 & 0.010206 \tabularnewline
7 & 0.160979 & 2.0106 & 0.023044 \tabularnewline
8 & 0.178575 & 2.2304 & 0.013574 \tabularnewline
9 & 0.105031 & 1.3118 & 0.095751 \tabularnewline
10 & 0.056908 & 0.7108 & 0.239141 \tabularnewline
11 & -0.169335 & -2.115 & 0.018009 \tabularnewline
12 & 0.653139 & 8.1577 & 0 \tabularnewline
13 & -0.165161 & -2.0629 & 0.020392 \tabularnewline
14 & 0.027323 & 0.3413 & 0.36668 \tabularnewline
15 & 0.058953 & 0.7363 & 0.231321 \tabularnewline
16 & 0.114822 & 1.4341 & 0.07677 \tabularnewline
17 & 0.127535 & 1.5929 & 0.056601 \tabularnewline
18 & -0.203435 & -2.5409 & 0.006017 \tabularnewline
19 & 0.087018 & 1.0869 & 0.139388 \tabularnewline
20 & 0.078383 & 0.979 & 0.164547 \tabularnewline
21 & -0.006736 & -0.0841 & 0.466528 \tabularnewline
22 & -0.029099 & -0.3634 & 0.358381 \tabularnewline
23 & -0.172336 & -2.1525 & 0.016449 \tabularnewline
24 & 0.536991 & 6.707 & 0 \tabularnewline
25 & -0.202154 & -2.5249 & 0.006286 \tabularnewline
26 & -0.014767 & -0.1844 & 0.426955 \tabularnewline
27 & 0.0062 & 0.0774 & 0.469189 \tabularnewline
28 & 0.055327 & 0.691 & 0.245284 \tabularnewline
29 & 0.057227 & 0.7148 & 0.23791 \tabularnewline
30 & -0.241688 & -3.0187 & 0.001483 \tabularnewline
31 & 0.010427 & 0.1302 & 0.448273 \tabularnewline
32 & 0.084282 & 1.0527 & 0.147058 \tabularnewline
33 & 0.026242 & 0.3278 & 0.371765 \tabularnewline
34 & -0.049999 & -0.6245 & 0.26661 \tabularnewline
35 & -0.178841 & -2.2337 & 0.013462 \tabularnewline
36 & 0.416661 & 5.2041 & 0 \tabularnewline
37 & -0.236668 & -2.956 & 0.0018 \tabularnewline
38 & -0.063146 & -0.7887 & 0.215745 \tabularnewline
39 & 0.004184 & 0.0523 & 0.479196 \tabularnewline
40 & 0.075486 & 0.9428 & 0.173617 \tabularnewline
41 & 0.051163 & 0.639 & 0.261872 \tabularnewline
42 & -0.204103 & -2.5492 & 0.00588 \tabularnewline
43 & 0.009141 & 0.1142 & 0.454625 \tabularnewline
44 & 0.022698 & 0.2835 & 0.388583 \tabularnewline
45 & -0.020234 & -0.2527 & 0.400408 \tabularnewline
46 & -0.011785 & -0.1472 & 0.441584 \tabularnewline
47 & -0.122195 & -1.5262 & 0.064491 \tabularnewline
48 & 0.396672 & 4.9544 & 1e-06 \tabularnewline
\hline
\end{tabular}
%Source: https://freestatistics.org/blog/index.php?pk=282991&T=1

[TABLE]
[ROW][C]Autocorrelation Function[/C][/ROW]
[ROW][C]Time lag k[/C][C]ACF(k)[/C][C]T-STAT[/C][C]P-value[/C][/ROW]
[ROW][C]1[/C][C]-0.055971[/C][C]-0.6991[/C][C]0.242771[/C][/ROW]
[ROW][C]2[/C][C]0.083251[/C][C]1.0398[/C][C]0.15002[/C][/ROW]
[ROW][C]3[/C][C]0.090075[/C][C]1.125[/C][C]0.131152[/C][/ROW]
[ROW][C]4[/C][C]0.133744[/C][C]1.6705[/C][C]0.048416[/C][/ROW]
[ROW][C]5[/C][C]0.142691[/C][C]1.7822[/C][C]0.03833[/C][/ROW]
[ROW][C]6[/C][C]-0.187558[/C][C]-2.3426[/C][C]0.010206[/C][/ROW]
[ROW][C]7[/C][C]0.160979[/C][C]2.0106[/C][C]0.023044[/C][/ROW]
[ROW][C]8[/C][C]0.178575[/C][C]2.2304[/C][C]0.013574[/C][/ROW]
[ROW][C]9[/C][C]0.105031[/C][C]1.3118[/C][C]0.095751[/C][/ROW]
[ROW][C]10[/C][C]0.056908[/C][C]0.7108[/C][C]0.239141[/C][/ROW]
[ROW][C]11[/C][C]-0.169335[/C][C]-2.115[/C][C]0.018009[/C][/ROW]
[ROW][C]12[/C][C]0.653139[/C][C]8.1577[/C][C]0[/C][/ROW]
[ROW][C]13[/C][C]-0.165161[/C][C]-2.0629[/C][C]0.020392[/C][/ROW]
[ROW][C]14[/C][C]0.027323[/C][C]0.3413[/C][C]0.36668[/C][/ROW]
[ROW][C]15[/C][C]0.058953[/C][C]0.7363[/C][C]0.231321[/C][/ROW]
[ROW][C]16[/C][C]0.114822[/C][C]1.4341[/C][C]0.07677[/C][/ROW]
[ROW][C]17[/C][C]0.127535[/C][C]1.5929[/C][C]0.056601[/C][/ROW]
[ROW][C]18[/C][C]-0.203435[/C][C]-2.5409[/C][C]0.006017[/C][/ROW]
[ROW][C]19[/C][C]0.087018[/C][C]1.0869[/C][C]0.139388[/C][/ROW]
[ROW][C]20[/C][C]0.078383[/C][C]0.979[/C][C]0.164547[/C][/ROW]
[ROW][C]21[/C][C]-0.006736[/C][C]-0.0841[/C][C]0.466528[/C][/ROW]
[ROW][C]22[/C][C]-0.029099[/C][C]-0.3634[/C][C]0.358381[/C][/ROW]
[ROW][C]23[/C][C]-0.172336[/C][C]-2.1525[/C][C]0.016449[/C][/ROW]
[ROW][C]24[/C][C]0.536991[/C][C]6.707[/C][C]0[/C][/ROW]
[ROW][C]25[/C][C]-0.202154[/C][C]-2.5249[/C][C]0.006286[/C][/ROW]
[ROW][C]26[/C][C]-0.014767[/C][C]-0.1844[/C][C]0.426955[/C][/ROW]
[ROW][C]27[/C][C]0.0062[/C][C]0.0774[/C][C]0.469189[/C][/ROW]
[ROW][C]28[/C][C]0.055327[/C][C]0.691[/C][C]0.245284[/C][/ROW]
[ROW][C]29[/C][C]0.057227[/C][C]0.7148[/C][C]0.23791[/C][/ROW]
[ROW][C]30[/C][C]-0.241688[/C][C]-3.0187[/C][C]0.001483[/C][/ROW]
[ROW][C]31[/C][C]0.010427[/C][C]0.1302[/C][C]0.448273[/C][/ROW]
[ROW][C]32[/C][C]0.084282[/C][C]1.0527[/C][C]0.147058[/C][/ROW]
[ROW][C]33[/C][C]0.026242[/C][C]0.3278[/C][C]0.371765[/C][/ROW]
[ROW][C]34[/C][C]-0.049999[/C][C]-0.6245[/C][C]0.26661[/C][/ROW]
[ROW][C]35[/C][C]-0.178841[/C][C]-2.2337[/C][C]0.013462[/C][/ROW]
[ROW][C]36[/C][C]0.416661[/C][C]5.2041[/C][C]0[/C][/ROW]
[ROW][C]37[/C][C]-0.236668[/C][C]-2.956[/C][C]0.0018[/C][/ROW]
[ROW][C]38[/C][C]-0.063146[/C][C]-0.7887[/C][C]0.215745[/C][/ROW]
[ROW][C]39[/C][C]0.004184[/C][C]0.0523[/C][C]0.479196[/C][/ROW]
[ROW][C]40[/C][C]0.075486[/C][C]0.9428[/C][C]0.173617[/C][/ROW]
[ROW][C]41[/C][C]0.051163[/C][C]0.639[/C][C]0.261872[/C][/ROW]
[ROW][C]42[/C][C]-0.204103[/C][C]-2.5492[/C][C]0.00588[/C][/ROW]
[ROW][C]43[/C][C]0.009141[/C][C]0.1142[/C][C]0.454625[/C][/ROW]
[ROW][C]44[/C][C]0.022698[/C][C]0.2835[/C][C]0.388583[/C][/ROW]
[ROW][C]45[/C][C]-0.020234[/C][C]-0.2527[/C][C]0.400408[/C][/ROW]
[ROW][C]46[/C][C]-0.011785[/C][C]-0.1472[/C][C]0.441584[/C][/ROW]
[ROW][C]47[/C][C]-0.122195[/C][C]-1.5262[/C][C]0.064491[/C][/ROW]
[ROW][C]48[/C][C]0.396672[/C][C]4.9544[/C][C]1e-06[/C][/ROW]
[/TABLE]
Source: https://freestatistics.org/blog/index.php?pk=282991&T=1

Globally Unique Identifier (entire table): ba.freestatistics.org/blog/index.php?pk=282991&T=1

As an alternative you can also use a QR Code:  

The GUIDs for individual cells are displayed in the table below:

Autocorrelation Function
Time lag kACF(k)T-STATP-value
1-0.055971-0.69910.242771
20.0832511.03980.15002
30.0900751.1250.131152
40.1337441.67050.048416
50.1426911.78220.03833
6-0.187558-2.34260.010206
70.1609792.01060.023044
80.1785752.23040.013574
90.1050311.31180.095751
100.0569080.71080.239141
11-0.169335-2.1150.018009
120.6531398.15770
13-0.165161-2.06290.020392
140.0273230.34130.36668
150.0589530.73630.231321
160.1148221.43410.07677
170.1275351.59290.056601
18-0.203435-2.54090.006017
190.0870181.08690.139388
200.0783830.9790.164547
21-0.006736-0.08410.466528
22-0.029099-0.36340.358381
23-0.172336-2.15250.016449
240.5369916.7070
25-0.202154-2.52490.006286
26-0.014767-0.18440.426955
270.00620.07740.469189
280.0553270.6910.245284
290.0572270.71480.23791
30-0.241688-3.01870.001483
310.0104270.13020.448273
320.0842821.05270.147058
330.0262420.32780.371765
34-0.049999-0.62450.26661
35-0.178841-2.23370.013462
360.4166615.20410
37-0.236668-2.9560.0018
38-0.063146-0.78870.215745
390.0041840.05230.479196
400.0754860.94280.173617
410.0511630.6390.261872
42-0.204103-2.54920.00588
430.0091410.11420.454625
440.0226980.28350.388583
45-0.020234-0.25270.400408
46-0.011785-0.14720.441584
47-0.122195-1.52620.064491
480.3966724.95441e-06


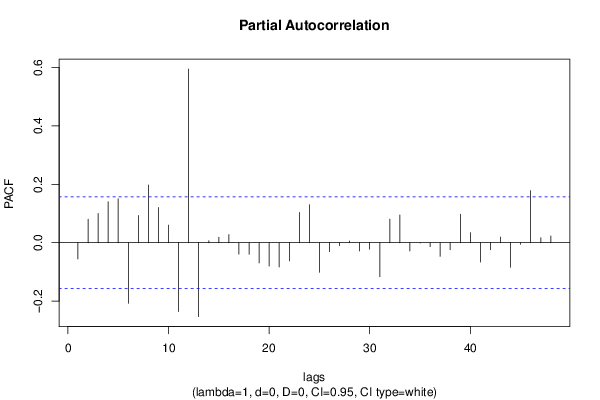
Partial Autocorrelation Function
Time lag kPACF(k)T-STATP-value
1-0.055971-0.69910.242771
20.080371.00380.15851
30.0998131.24670.107194
40.1402991.75230.040841
50.1505811.88080.030934
6-0.20717-2.58750.005289
70.0929391.16080.123748
80.1974332.46590.007374
90.1202391.50180.067587
100.0600870.75050.227048
11-0.235781-2.94490.001863
120.5948777.430
13-0.253252-3.16310.000938
140.0063860.07980.468264
150.0188340.23520.407167
160.027690.34590.36496
17-0.039156-0.48910.312744
18-0.039639-0.49510.310617
19-0.069067-0.86270.194827
20-0.079779-0.99640.160289
21-0.083038-1.03710.150638
22-0.062411-0.77950.21843
230.1036261.29430.09874
240.1296721.61960.053668
25-0.101257-1.26470.103932
26-0.030987-0.3870.34963
27-0.010169-0.1270.449546
280.0057590.07190.471375
29-0.028625-0.35750.360592
30-0.022199-0.27730.390972
31-0.116136-1.45050.074459
320.0805741.00640.157898
330.0948491.18470.118975
34-0.028352-0.35410.361867
35-0.000977-0.01220.495141
36-0.013432-0.16780.433494
37-0.046769-0.58410.279984
38-0.024078-0.30070.382007
390.0972681.21490.113125
400.0344370.43010.33385
41-0.066003-0.82440.205494
42-0.024009-0.29990.382335
430.0195790.24450.403565
44-0.084405-1.05420.146706
45-0.005463-0.06820.472842
460.1783382.22740.013674
470.0170170.21250.415983
480.0229870.28710.387204

\begin{tabular}{lllllllll}
\hline
Partial Autocorrelation Function \tabularnewline
Time lag k & PACF(k) & T-STAT & P-value \tabularnewline
1 & -0.055971 & -0.6991 & 0.242771 \tabularnewline
2 & 0.08037 & 1.0038 & 0.15851 \tabularnewline
3 & 0.099813 & 1.2467 & 0.107194 \tabularnewline
4 & 0.140299 & 1.7523 & 0.040841 \tabularnewline
5 & 0.150581 & 1.8808 & 0.030934 \tabularnewline
6 & -0.20717 & -2.5875 & 0.005289 \tabularnewline
7 & 0.092939 & 1.1608 & 0.123748 \tabularnewline
8 & 0.197433 & 2.4659 & 0.007374 \tabularnewline
9 & 0.120239 & 1.5018 & 0.067587 \tabularnewline
10 & 0.060087 & 0.7505 & 0.227048 \tabularnewline
11 & -0.235781 & -2.9449 & 0.001863 \tabularnewline
12 & 0.594877 & 7.43 & 0 \tabularnewline
13 & -0.253252 & -3.1631 & 0.000938 \tabularnewline
14 & 0.006386 & 0.0798 & 0.468264 \tabularnewline
15 & 0.018834 & 0.2352 & 0.407167 \tabularnewline
16 & 0.02769 & 0.3459 & 0.36496 \tabularnewline
17 & -0.039156 & -0.4891 & 0.312744 \tabularnewline
18 & -0.039639 & -0.4951 & 0.310617 \tabularnewline
19 & -0.069067 & -0.8627 & 0.194827 \tabularnewline
20 & -0.079779 & -0.9964 & 0.160289 \tabularnewline
21 & -0.083038 & -1.0371 & 0.150638 \tabularnewline
22 & -0.062411 & -0.7795 & 0.21843 \tabularnewline
23 & 0.103626 & 1.2943 & 0.09874 \tabularnewline
24 & 0.129672 & 1.6196 & 0.053668 \tabularnewline
25 & -0.101257 & -1.2647 & 0.103932 \tabularnewline
26 & -0.030987 & -0.387 & 0.34963 \tabularnewline
27 & -0.010169 & -0.127 & 0.449546 \tabularnewline
28 & 0.005759 & 0.0719 & 0.471375 \tabularnewline
29 & -0.028625 & -0.3575 & 0.360592 \tabularnewline
30 & -0.022199 & -0.2773 & 0.390972 \tabularnewline
31 & -0.116136 & -1.4505 & 0.074459 \tabularnewline
32 & 0.080574 & 1.0064 & 0.157898 \tabularnewline
33 & 0.094849 & 1.1847 & 0.118975 \tabularnewline
34 & -0.028352 & -0.3541 & 0.361867 \tabularnewline
35 & -0.000977 & -0.0122 & 0.495141 \tabularnewline
36 & -0.013432 & -0.1678 & 0.433494 \tabularnewline
37 & -0.046769 & -0.5841 & 0.279984 \tabularnewline
38 & -0.024078 & -0.3007 & 0.382007 \tabularnewline
39 & 0.097268 & 1.2149 & 0.113125 \tabularnewline
40 & 0.034437 & 0.4301 & 0.33385 \tabularnewline
41 & -0.066003 & -0.8244 & 0.205494 \tabularnewline
42 & -0.024009 & -0.2999 & 0.382335 \tabularnewline
43 & 0.019579 & 0.2445 & 0.403565 \tabularnewline
44 & -0.084405 & -1.0542 & 0.146706 \tabularnewline
45 & -0.005463 & -0.0682 & 0.472842 \tabularnewline
46 & 0.178338 & 2.2274 & 0.013674 \tabularnewline
47 & 0.017017 & 0.2125 & 0.415983 \tabularnewline
48 & 0.022987 & 0.2871 & 0.387204 \tabularnewline
\hline
\end{tabular}
%Source: https://freestatistics.org/blog/index.php?pk=282991&T=2

[TABLE]
[ROW][C]Partial Autocorrelation Function[/C][/ROW]
[ROW][C]Time lag k[/C][C]PACF(k)[/C][C]T-STAT[/C][C]P-value[/C][/ROW]
[ROW][C]1[/C][C]-0.055971[/C][C]-0.6991[/C][C]0.242771[/C][/ROW]
[ROW][C]2[/C][C]0.08037[/C][C]1.0038[/C][C]0.15851[/C][/ROW]
[ROW][C]3[/C][C]0.099813[/C][C]1.2467[/C][C]0.107194[/C][/ROW]
[ROW][C]4[/C][C]0.140299[/C][C]1.7523[/C][C]0.040841[/C][/ROW]
[ROW][C]5[/C][C]0.150581[/C][C]1.8808[/C][C]0.030934[/C][/ROW]
[ROW][C]6[/C][C]-0.20717[/C][C]-2.5875[/C][C]0.005289[/C][/ROW]
[ROW][C]7[/C][C]0.092939[/C][C]1.1608[/C][C]0.123748[/C][/ROW]
[ROW][C]8[/C][C]0.197433[/C][C]2.4659[/C][C]0.007374[/C][/ROW]
[ROW][C]9[/C][C]0.120239[/C][C]1.5018[/C][C]0.067587[/C][/ROW]
[ROW][C]10[/C][C]0.060087[/C][C]0.7505[/C][C]0.227048[/C][/ROW]
[ROW][C]11[/C][C]-0.235781[/C][C]-2.9449[/C][C]0.001863[/C][/ROW]
[ROW][C]12[/C][C]0.594877[/C][C]7.43[/C][C]0[/C][/ROW]
[ROW][C]13[/C][C]-0.253252[/C][C]-3.1631[/C][C]0.000938[/C][/ROW]
[ROW][C]14[/C][C]0.006386[/C][C]0.0798[/C][C]0.468264[/C][/ROW]
[ROW][C]15[/C][C]0.018834[/C][C]0.2352[/C][C]0.407167[/C][/ROW]
[ROW][C]16[/C][C]0.02769[/C][C]0.3459[/C][C]0.36496[/C][/ROW]
[ROW][C]17[/C][C]-0.039156[/C][C]-0.4891[/C][C]0.312744[/C][/ROW]
[ROW][C]18[/C][C]-0.039639[/C][C]-0.4951[/C][C]0.310617[/C][/ROW]
[ROW][C]19[/C][C]-0.069067[/C][C]-0.8627[/C][C]0.194827[/C][/ROW]
[ROW][C]20[/C][C]-0.079779[/C][C]-0.9964[/C][C]0.160289[/C][/ROW]
[ROW][C]21[/C][C]-0.083038[/C][C]-1.0371[/C][C]0.150638[/C][/ROW]
[ROW][C]22[/C][C]-0.062411[/C][C]-0.7795[/C][C]0.21843[/C][/ROW]
[ROW][C]23[/C][C]0.103626[/C][C]1.2943[/C][C]0.09874[/C][/ROW]
[ROW][C]24[/C][C]0.129672[/C][C]1.6196[/C][C]0.053668[/C][/ROW]
[ROW][C]25[/C][C]-0.101257[/C][C]-1.2647[/C][C]0.103932[/C][/ROW]
[ROW][C]26[/C][C]-0.030987[/C][C]-0.387[/C][C]0.34963[/C][/ROW]
[ROW][C]27[/C][C]-0.010169[/C][C]-0.127[/C][C]0.449546[/C][/ROW]
[ROW][C]28[/C][C]0.005759[/C][C]0.0719[/C][C]0.471375[/C][/ROW]
[ROW][C]29[/C][C]-0.028625[/C][C]-0.3575[/C][C]0.360592[/C][/ROW]
[ROW][C]30[/C][C]-0.022199[/C][C]-0.2773[/C][C]0.390972[/C][/ROW]
[ROW][C]31[/C][C]-0.116136[/C][C]-1.4505[/C][C]0.074459[/C][/ROW]
[ROW][C]32[/C][C]0.080574[/C][C]1.0064[/C][C]0.157898[/C][/ROW]
[ROW][C]33[/C][C]0.094849[/C][C]1.1847[/C][C]0.118975[/C][/ROW]
[ROW][C]34[/C][C]-0.028352[/C][C]-0.3541[/C][C]0.361867[/C][/ROW]
[ROW][C]35[/C][C]-0.000977[/C][C]-0.0122[/C][C]0.495141[/C][/ROW]
[ROW][C]36[/C][C]-0.013432[/C][C]-0.1678[/C][C]0.433494[/C][/ROW]
[ROW][C]37[/C][C]-0.046769[/C][C]-0.5841[/C][C]0.279984[/C][/ROW]
[ROW][C]38[/C][C]-0.024078[/C][C]-0.3007[/C][C]0.382007[/C][/ROW]
[ROW][C]39[/C][C]0.097268[/C][C]1.2149[/C][C]0.113125[/C][/ROW]
[ROW][C]40[/C][C]0.034437[/C][C]0.4301[/C][C]0.33385[/C][/ROW]
[ROW][C]41[/C][C]-0.066003[/C][C]-0.8244[/C][C]0.205494[/C][/ROW]
[ROW][C]42[/C][C]-0.024009[/C][C]-0.2999[/C][C]0.382335[/C][/ROW]
[ROW][C]43[/C][C]0.019579[/C][C]0.2445[/C][C]0.403565[/C][/ROW]
[ROW][C]44[/C][C]-0.084405[/C][C]-1.0542[/C][C]0.146706[/C][/ROW]
[ROW][C]45[/C][C]-0.005463[/C][C]-0.0682[/C][C]0.472842[/C][/ROW]
[ROW][C]46[/C][C]0.178338[/C][C]2.2274[/C][C]0.013674[/C][/ROW]
[ROW][C]47[/C][C]0.017017[/C][C]0.2125[/C][C]0.415983[/C][/ROW]
[ROW][C]48[/C][C]0.022987[/C][C]0.2871[/C][C]0.387204[/C][/ROW]
[/TABLE]
Source: https://freestatistics.org/blog/index.php?pk=282991&T=2

Globally Unique Identifier (entire table): ba.freestatistics.org/blog/index.php?pk=282991&T=2

As an alternative you can also use a QR Code:  

The GUIDs for individual cells are displayed in the table below:

Partial Autocorrelation Function
Time lag kPACF(k)T-STATP-value
1-0.055971-0.69910.242771
20.080371.00380.15851
30.0998131.24670.107194
40.1402991.75230.040841
50.1505811.88080.030934
6-0.20717-2.58750.005289
70.0929391.16080.123748
80.1974332.46590.007374
90.1202391.50180.067587
100.0600870.75050.227048
11-0.235781-2.94490.001863
120.5948777.430
13-0.253252-3.16310.000938
140.0063860.07980.468264
150.0188340.23520.407167
160.027690.34590.36496
17-0.039156-0.48910.312744
18-0.039639-0.49510.310617
19-0.069067-0.86270.194827
20-0.079779-0.99640.160289
21-0.083038-1.03710.150638
22-0.062411-0.77950.21843
230.1036261.29430.09874
240.1296721.61960.053668
25-0.101257-1.26470.103932
26-0.030987-0.3870.34963
27-0.010169-0.1270.449546
280.0057590.07190.471375
29-0.028625-0.35750.360592
30-0.022199-0.27730.390972
31-0.116136-1.45050.074459
320.0805741.00640.157898
330.0948491.18470.118975
34-0.028352-0.35410.361867
35-0.000977-0.01220.495141
36-0.013432-0.16780.433494
37-0.046769-0.58410.279984
38-0.024078-0.30070.382007
390.0972681.21490.113125
400.0344370.43010.33385
41-0.066003-0.82440.205494
42-0.024009-0.29990.382335
430.0195790.24450.403565
44-0.084405-1.05420.146706
45-0.005463-0.06820.472842
460.1783382.22740.013674
470.0170170.21250.415983
480.0229870.28710.387204


Parameters (Session):
par1 = 48 ; par2 = 1 ; par3 = 0 ; par4 = 0 ; par5 = 12 ; par6 = White Noise ; par7 = 0.95 ;
Parameters (R input):
par1 = 48 ; par2 = 1 ; par3 = 0 ; par4 = 0 ; par5 = 12 ; par6 = White Noise ; par7 = 0.95 ; par8 = ;
R code (references can be found in the software module):
if (par1 == 'Default') {
par1 = 10*log10(length(x))
} else {
par1 <- as.numeric(par1)
}
par2 <- as.numeric(par2)
par3 <- as.numeric(par3)
par4 <- as.numeric(par4)
par5 <- as.numeric(par5)
if (par6 == 'White Noise') par6 <- 'white' else par6 <- 'ma'
par7 <- as.numeric(par7)
if (par8 != '') par8 <- as.numeric(par8)
ox <- x
if (par8 == '') {
if (par2 == 0) {
x <- log(x)
} else {
x <- (x ^ par2 - 1) / par2
}
} else {
x <- log(x,base=par8)
}
if (par3 > 0) x <- diff(x,lag=1,difference=par3)
if (par4 > 0) x <- diff(x,lag=par5,difference=par4)
bitmap(file='picts.png')
op <- par(mfrow=c(2,1))
plot(ox,type='l',main='Original Time Series',xlab='time',ylab='value')
if (par8=='') {
mytitle <- paste('Working Time Series (lambda=',par2,', d=',par3,', D=',par4,')',sep='')
mysub <- paste('(lambda=',par2,', d=',par3,', D=',par4,', CI=', par7, ', CI type=',par6,')',sep='')
} else {
mytitle <- paste('Working Time Series (base=',par8,', d=',par3,', D=',par4,')',sep='')
mysub <- paste('(base=',par8,', d=',par3,', D=',par4,', CI=', par7, ', CI type=',par6,')',sep='')
}
plot(x,type='l', main=mytitle,xlab='time',ylab='value')
par(op)
dev.off()
bitmap(file='pic1.png')
racf <- acf(x, par1, main='Autocorrelation', xlab='time lag', ylab='ACF', ci.type=par6, ci=par7, sub=mysub)
dev.off()
bitmap(file='pic2.png')
rpacf <- pacf(x,par1,main='Partial Autocorrelation',xlab='lags',ylab='PACF',sub=mysub)
dev.off()
(myacf <- c(racf$acf))
(mypacf <- c(rpacf$acf))
lengthx <- length(x)
sqrtn <- sqrt(lengthx)
load(file='createtable')
a<-table.start()
a<-table.row.start(a)
a<-table.element(a,'Autocorrelation Function',4,TRUE)
a<-table.row.end(a)
a<-table.row.start(a)
a<-table.element(a,'Time lag k',header=TRUE)
a<-table.element(a,hyperlink('basics.htm','ACF(k)','click here for more information about the Autocorrelation Function'),header=TRUE)
a<-table.element(a,'T-STAT',header=TRUE)
a<-table.element(a,'P-value',header=TRUE)
a<-table.row.end(a)
for (i in 2:(par1+1)) {
a<-table.row.start(a)
a<-table.element(a,i-1,header=TRUE)
a<-table.element(a,round(myacf[i],6))
mytstat <- myacf[i]*sqrtn
a<-table.element(a,round(mytstat,4))
a<-table.element(a,round(1-pt(abs(mytstat),lengthx),6))
a<-table.row.end(a)
}
a<-table.end(a)
table.save(a,file='mytable.tab')
a<-table.start()
a<-table.row.start(a)
a<-table.element(a,'Partial Autocorrelation Function',4,TRUE)
a<-table.row.end(a)
a<-table.row.start(a)
a<-table.element(a,'Time lag k',header=TRUE)
a<-table.element(a,hyperlink('basics.htm','PACF(k)','click here for more information about the Partial Autocorrelation Function'),header=TRUE)
a<-table.element(a,'T-STAT',header=TRUE)
a<-table.element(a,'P-value',header=TRUE)
a<-table.row.end(a)
for (i in 1:par1) {
a<-table.row.start(a)
a<-table.element(a,i,header=TRUE)
a<-table.element(a,round(mypacf[i],6))
mytstat <- mypacf[i]*sqrtn
a<-table.element(a,round(mytstat,4))
a<-table.element(a,round(1-pt(abs(mytstat),lengthx),6))
a<-table.row.end(a)
}
a<-table.end(a)
table.save(a,file='mytable1.tab')