Free Statistics

of Irreproducible Research!

Author's title

Author*Unverified author*
R Software Modulerwasp_autocorrelation.wasp
Title produced by software(Partial) Autocorrelation Function
Date of computationSat, 24 Oct 2015 11:28:59 +0100
Cite this page as followsStatistical Computations at FreeStatistics.org, Office for Research Development and Education, URL https://freestatistics.org/blog/index.php?v=date/2015/Oct/24/t1445682576otb8v83tssneofl.htm/, Retrieved Wed, 15 May 2024 08:42:53 +0000
Statistical Computations at FreeStatistics.org, Office for Research Development and Education, URL https://freestatistics.org/blog/index.php?pk=283020, Retrieved Wed, 15 May 2024 08:42:53 +0000
QR Codes:

Original text written by user:
IsPrivate?No (this computation is public)
User-defined keywords
Estimated Impact110
Family? (F = Feedback message, R = changed R code, M = changed R Module, P = changed Parameters, D = changed Data)
-       [(Partial) Autocorrelation Function] [] [2015-10-24 10:28:59] [51347023fbb3308e181ecc8c43b3ca65] [Current]
- R PD    [(Partial) Autocorrelation Function] [] [2016-01-03 10:19:53] [49d4cf75dfccc6ca755ccaaecab7ea56]
Feedback Forum

Post a new message
Dataseries X:
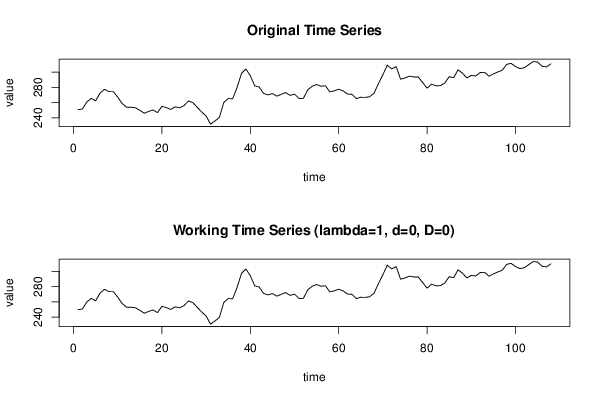
250,71
251,57
260,85
265,47
262,37
272,39
277,49
274,41
274,42
267,1
258,84
253,97
253,88
253,3
249,86
246
248,42
250,29
246,9
255,2
253,33
251,02
254,5
253,18
256,03
262,15
259,94
253,75
247,69
242,42
231,82
235,88
240,68
260,15
265,32
265,02
279,86
298,3
304,14
295,26
281,93
280,46
272,06
270,05
271,84
268,49
270,92
273,22
269,43
271,21
265,4
265,53
276,78
281,49
283,75
281,45
282,1
274,01
275,51
277,62
275,33
271,15
270,89
265,29
266,96
266,87
267,68
272,37
285,05
296,79
309,15
304,19
307,33
290,68
292,26
294,81
293,67
293,57
286,28
278,93
284,22
282,09
282,26
285,79
294,01
292,73
303,01
298,67
292,38
295,7
294,9
299,46
299,75
294,76
297,68
300,24
302,48
310,2
311,49
307,37
304,58
305,87
309,81
313,91
313,2
307,85
306,89
310,83


Summary of computational transaction
Raw Inputview raw input (R code)
Raw Outputview raw output of R engine
Computing time2 seconds
R Server'George Udny Yule' @ yule.wessa.net

\begin{tabular}{lllllllll}
\hline
Summary of computational transaction \tabularnewline
Raw Input & view raw input (R code)  \tabularnewline
Raw Output & view raw output of R engine  \tabularnewline
Computing time & 2 seconds \tabularnewline
R Server & 'George Udny Yule' @ yule.wessa.net \tabularnewline
\hline
\end{tabular}
%Source: https://freestatistics.org/blog/index.php?pk=283020&T=0

[TABLE]
[ROW][C]Summary of computational transaction[/C][/ROW]
[ROW][C]Raw Input[/C][C]view raw input (R code) [/C][/ROW]
[ROW][C]Raw Output[/C][C]view raw output of R engine [/C][/ROW]
[ROW][C]Computing time[/C][C]2 seconds[/C][/ROW]
[ROW][C]R Server[/C][C]'George Udny Yule' @ yule.wessa.net[/C][/ROW]
[/TABLE]
Source: https://freestatistics.org/blog/index.php?pk=283020&T=0

Globally Unique Identifier (entire table): ba.freestatistics.org/blog/index.php?pk=283020&T=0

As an alternative you can also use a QR Code:  

The GUIDs for individual cells are displayed in the table below:

Summary of computational transaction
Raw Inputview raw input (R code)
Raw Outputview raw output of R engine
Computing time2 seconds
R Server'George Udny Yule' @ yule.wessa.net


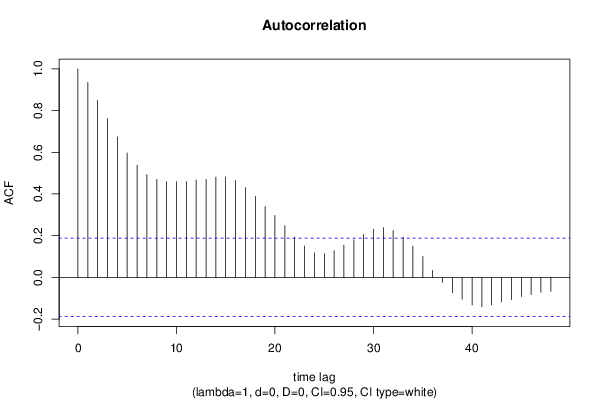
Autocorrelation Function
Time lag kACF(k)T-STATP-value
10.9351439.71830
20.8487298.82030
30.7608837.90730
40.6736347.00060
50.5970796.2050
60.5377195.58810
70.4924365.11751e-06
80.4701264.88572e-06
90.4596144.77643e-06
100.4585524.76543e-06
110.4599474.77993e-06
120.4665594.84862e-06
130.4701414.88582e-06
140.4809254.99791e-06
150.4808224.99691e-06
160.4644424.82662e-06
170.4313214.48249e-06
180.389174.04444.9e-05
190.3395683.52890.000307
200.2972023.08860.001278
210.2473442.57050.005759
220.1928212.00390.023795
230.1505541.56460.060301
240.1177551.22370.111855
250.1132231.17660.120962
260.1275221.32520.093943
270.1540831.60130.056119
280.1801711.87240.031929
290.2060972.14180.017228
300.2306392.39690.009127
310.2384832.47840.007373
320.2243792.33180.010783
330.1920851.99620.024214
340.1500271.55910.060946
350.1003631.0430.149637
360.0326480.33930.367527
37-0.024965-0.25940.397893
38-0.074005-0.76910.221762
39-0.10504-1.09160.138718
40-0.132459-1.37660.085749
41-0.140819-1.46340.073127
42-0.132159-1.37340.08623
43-0.118275-1.22910.110844
44-0.107371-1.11580.133485
45-0.092055-0.95670.170437
46-0.082648-0.85890.196148
47-0.071401-0.7420.229843
48-0.06731-0.69950.24287

\begin{tabular}{lllllllll}
\hline
Autocorrelation Function \tabularnewline
Time lag k & ACF(k) & T-STAT & P-value \tabularnewline
1 & 0.935143 & 9.7183 & 0 \tabularnewline
2 & 0.848729 & 8.8203 & 0 \tabularnewline
3 & 0.760883 & 7.9073 & 0 \tabularnewline
4 & 0.673634 & 7.0006 & 0 \tabularnewline
5 & 0.597079 & 6.205 & 0 \tabularnewline
6 & 0.537719 & 5.5881 & 0 \tabularnewline
7 & 0.492436 & 5.1175 & 1e-06 \tabularnewline
8 & 0.470126 & 4.8857 & 2e-06 \tabularnewline
9 & 0.459614 & 4.7764 & 3e-06 \tabularnewline
10 & 0.458552 & 4.7654 & 3e-06 \tabularnewline
11 & 0.459947 & 4.7799 & 3e-06 \tabularnewline
12 & 0.466559 & 4.8486 & 2e-06 \tabularnewline
13 & 0.470141 & 4.8858 & 2e-06 \tabularnewline
14 & 0.480925 & 4.9979 & 1e-06 \tabularnewline
15 & 0.480822 & 4.9969 & 1e-06 \tabularnewline
16 & 0.464442 & 4.8266 & 2e-06 \tabularnewline
17 & 0.431321 & 4.4824 & 9e-06 \tabularnewline
18 & 0.38917 & 4.0444 & 4.9e-05 \tabularnewline
19 & 0.339568 & 3.5289 & 0.000307 \tabularnewline
20 & 0.297202 & 3.0886 & 0.001278 \tabularnewline
21 & 0.247344 & 2.5705 & 0.005759 \tabularnewline
22 & 0.192821 & 2.0039 & 0.023795 \tabularnewline
23 & 0.150554 & 1.5646 & 0.060301 \tabularnewline
24 & 0.117755 & 1.2237 & 0.111855 \tabularnewline
25 & 0.113223 & 1.1766 & 0.120962 \tabularnewline
26 & 0.127522 & 1.3252 & 0.093943 \tabularnewline
27 & 0.154083 & 1.6013 & 0.056119 \tabularnewline
28 & 0.180171 & 1.8724 & 0.031929 \tabularnewline
29 & 0.206097 & 2.1418 & 0.017228 \tabularnewline
30 & 0.230639 & 2.3969 & 0.009127 \tabularnewline
31 & 0.238483 & 2.4784 & 0.007373 \tabularnewline
32 & 0.224379 & 2.3318 & 0.010783 \tabularnewline
33 & 0.192085 & 1.9962 & 0.024214 \tabularnewline
34 & 0.150027 & 1.5591 & 0.060946 \tabularnewline
35 & 0.100363 & 1.043 & 0.149637 \tabularnewline
36 & 0.032648 & 0.3393 & 0.367527 \tabularnewline
37 & -0.024965 & -0.2594 & 0.397893 \tabularnewline
38 & -0.074005 & -0.7691 & 0.221762 \tabularnewline
39 & -0.10504 & -1.0916 & 0.138718 \tabularnewline
40 & -0.132459 & -1.3766 & 0.085749 \tabularnewline
41 & -0.140819 & -1.4634 & 0.073127 \tabularnewline
42 & -0.132159 & -1.3734 & 0.08623 \tabularnewline
43 & -0.118275 & -1.2291 & 0.110844 \tabularnewline
44 & -0.107371 & -1.1158 & 0.133485 \tabularnewline
45 & -0.092055 & -0.9567 & 0.170437 \tabularnewline
46 & -0.082648 & -0.8589 & 0.196148 \tabularnewline
47 & -0.071401 & -0.742 & 0.229843 \tabularnewline
48 & -0.06731 & -0.6995 & 0.24287 \tabularnewline
\hline
\end{tabular}
%Source: https://freestatistics.org/blog/index.php?pk=283020&T=1

[TABLE]
[ROW][C]Autocorrelation Function[/C][/ROW]
[ROW][C]Time lag k[/C][C]ACF(k)[/C][C]T-STAT[/C][C]P-value[/C][/ROW]
[ROW][C]1[/C][C]0.935143[/C][C]9.7183[/C][C]0[/C][/ROW]
[ROW][C]2[/C][C]0.848729[/C][C]8.8203[/C][C]0[/C][/ROW]
[ROW][C]3[/C][C]0.760883[/C][C]7.9073[/C][C]0[/C][/ROW]
[ROW][C]4[/C][C]0.673634[/C][C]7.0006[/C][C]0[/C][/ROW]
[ROW][C]5[/C][C]0.597079[/C][C]6.205[/C][C]0[/C][/ROW]
[ROW][C]6[/C][C]0.537719[/C][C]5.5881[/C][C]0[/C][/ROW]
[ROW][C]7[/C][C]0.492436[/C][C]5.1175[/C][C]1e-06[/C][/ROW]
[ROW][C]8[/C][C]0.470126[/C][C]4.8857[/C][C]2e-06[/C][/ROW]
[ROW][C]9[/C][C]0.459614[/C][C]4.7764[/C][C]3e-06[/C][/ROW]
[ROW][C]10[/C][C]0.458552[/C][C]4.7654[/C][C]3e-06[/C][/ROW]
[ROW][C]11[/C][C]0.459947[/C][C]4.7799[/C][C]3e-06[/C][/ROW]
[ROW][C]12[/C][C]0.466559[/C][C]4.8486[/C][C]2e-06[/C][/ROW]
[ROW][C]13[/C][C]0.470141[/C][C]4.8858[/C][C]2e-06[/C][/ROW]
[ROW][C]14[/C][C]0.480925[/C][C]4.9979[/C][C]1e-06[/C][/ROW]
[ROW][C]15[/C][C]0.480822[/C][C]4.9969[/C][C]1e-06[/C][/ROW]
[ROW][C]16[/C][C]0.464442[/C][C]4.8266[/C][C]2e-06[/C][/ROW]
[ROW][C]17[/C][C]0.431321[/C][C]4.4824[/C][C]9e-06[/C][/ROW]
[ROW][C]18[/C][C]0.38917[/C][C]4.0444[/C][C]4.9e-05[/C][/ROW]
[ROW][C]19[/C][C]0.339568[/C][C]3.5289[/C][C]0.000307[/C][/ROW]
[ROW][C]20[/C][C]0.297202[/C][C]3.0886[/C][C]0.001278[/C][/ROW]
[ROW][C]21[/C][C]0.247344[/C][C]2.5705[/C][C]0.005759[/C][/ROW]
[ROW][C]22[/C][C]0.192821[/C][C]2.0039[/C][C]0.023795[/C][/ROW]
[ROW][C]23[/C][C]0.150554[/C][C]1.5646[/C][C]0.060301[/C][/ROW]
[ROW][C]24[/C][C]0.117755[/C][C]1.2237[/C][C]0.111855[/C][/ROW]
[ROW][C]25[/C][C]0.113223[/C][C]1.1766[/C][C]0.120962[/C][/ROW]
[ROW][C]26[/C][C]0.127522[/C][C]1.3252[/C][C]0.093943[/C][/ROW]
[ROW][C]27[/C][C]0.154083[/C][C]1.6013[/C][C]0.056119[/C][/ROW]
[ROW][C]28[/C][C]0.180171[/C][C]1.8724[/C][C]0.031929[/C][/ROW]
[ROW][C]29[/C][C]0.206097[/C][C]2.1418[/C][C]0.017228[/C][/ROW]
[ROW][C]30[/C][C]0.230639[/C][C]2.3969[/C][C]0.009127[/C][/ROW]
[ROW][C]31[/C][C]0.238483[/C][C]2.4784[/C][C]0.007373[/C][/ROW]
[ROW][C]32[/C][C]0.224379[/C][C]2.3318[/C][C]0.010783[/C][/ROW]
[ROW][C]33[/C][C]0.192085[/C][C]1.9962[/C][C]0.024214[/C][/ROW]
[ROW][C]34[/C][C]0.150027[/C][C]1.5591[/C][C]0.060946[/C][/ROW]
[ROW][C]35[/C][C]0.100363[/C][C]1.043[/C][C]0.149637[/C][/ROW]
[ROW][C]36[/C][C]0.032648[/C][C]0.3393[/C][C]0.367527[/C][/ROW]
[ROW][C]37[/C][C]-0.024965[/C][C]-0.2594[/C][C]0.397893[/C][/ROW]
[ROW][C]38[/C][C]-0.074005[/C][C]-0.7691[/C][C]0.221762[/C][/ROW]
[ROW][C]39[/C][C]-0.10504[/C][C]-1.0916[/C][C]0.138718[/C][/ROW]
[ROW][C]40[/C][C]-0.132459[/C][C]-1.3766[/C][C]0.085749[/C][/ROW]
[ROW][C]41[/C][C]-0.140819[/C][C]-1.4634[/C][C]0.073127[/C][/ROW]
[ROW][C]42[/C][C]-0.132159[/C][C]-1.3734[/C][C]0.08623[/C][/ROW]
[ROW][C]43[/C][C]-0.118275[/C][C]-1.2291[/C][C]0.110844[/C][/ROW]
[ROW][C]44[/C][C]-0.107371[/C][C]-1.1158[/C][C]0.133485[/C][/ROW]
[ROW][C]45[/C][C]-0.092055[/C][C]-0.9567[/C][C]0.170437[/C][/ROW]
[ROW][C]46[/C][C]-0.082648[/C][C]-0.8589[/C][C]0.196148[/C][/ROW]
[ROW][C]47[/C][C]-0.071401[/C][C]-0.742[/C][C]0.229843[/C][/ROW]
[ROW][C]48[/C][C]-0.06731[/C][C]-0.6995[/C][C]0.24287[/C][/ROW]
[/TABLE]
Source: https://freestatistics.org/blog/index.php?pk=283020&T=1

Globally Unique Identifier (entire table): ba.freestatistics.org/blog/index.php?pk=283020&T=1

As an alternative you can also use a QR Code:  

The GUIDs for individual cells are displayed in the table below:

Autocorrelation Function
Time lag kACF(k)T-STATP-value
10.9351439.71830
20.8487298.82030
30.7608837.90730
40.6736347.00060
50.5970796.2050
60.5377195.58810
70.4924365.11751e-06
80.4701264.88572e-06
90.4596144.77643e-06
100.4585524.76543e-06
110.4599474.77993e-06
120.4665594.84862e-06
130.4701414.88582e-06
140.4809254.99791e-06
150.4808224.99691e-06
160.4644424.82662e-06
170.4313214.48249e-06
180.389174.04444.9e-05
190.3395683.52890.000307
200.2972023.08860.001278
210.2473442.57050.005759
220.1928212.00390.023795
230.1505541.56460.060301
240.1177551.22370.111855
250.1132231.17660.120962
260.1275221.32520.093943
270.1540831.60130.056119
280.1801711.87240.031929
290.2060972.14180.017228
300.2306392.39690.009127
310.2384832.47840.007373
320.2243792.33180.010783
330.1920851.99620.024214
340.1500271.55910.060946
350.1003631.0430.149637
360.0326480.33930.367527
37-0.024965-0.25940.397893
38-0.074005-0.76910.221762
39-0.10504-1.09160.138718
40-0.132459-1.37660.085749
41-0.140819-1.46340.073127
42-0.132159-1.37340.08623
43-0.118275-1.22910.110844
44-0.107371-1.11580.133485
45-0.092055-0.95670.170437
46-0.082648-0.85890.196148
47-0.071401-0.7420.229843
48-0.06731-0.69950.24287


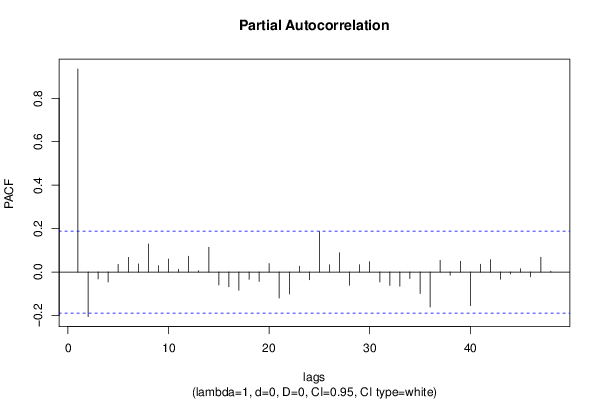
Partial Autocorrelation Function
Time lag kPACF(k)T-STATP-value
10.9351439.71830
2-0.205275-2.13330.017583
3-0.031295-0.32520.372818
4-0.045977-0.47780.316878
50.0354150.3680.356782
60.0676630.70320.24173
70.0375890.39060.348419
80.1289151.33970.091574
90.0290290.30170.381739
100.0603030.62670.266092
110.0124820.12970.448518
120.0726330.75480.225998
130.0060320.06270.475064
140.1145411.19030.11826
15-0.059396-0.61730.26918
16-0.068035-0.7070.240533
17-0.083945-0.87240.192467
18-0.033526-0.34840.364106
19-0.042901-0.44580.328301
200.0390270.40560.342925
21-0.119339-1.24020.108792
22-0.100791-1.04750.148615
230.026910.27970.390137
24-0.035617-0.37010.356001
250.1865611.93880.027567
260.0331850.34490.365431
270.088910.9240.178777
28-0.060628-0.63010.264992
290.0339670.3530.362392
300.0475920.49460.310948
31-0.045508-0.47290.318608
32-0.061443-0.63850.262238
33-0.065174-0.67730.249829
34-0.029776-0.30940.378792
35-0.098343-1.0220.154529
36-0.161158-1.67480.048433
370.0538650.55980.288394
38-0.014883-0.15470.438685
390.0493480.51280.304556
40-0.154436-1.6050.055713
410.0358950.3730.354929
420.0572310.59480.276622
43-0.033262-0.34570.365133
44-0.008279-0.0860.465797
450.0154030.16010.436562
46-0.021847-0.2270.410412
470.0683470.71030.239531
480.0041420.0430.482872

\begin{tabular}{lllllllll}
\hline
Partial Autocorrelation Function \tabularnewline
Time lag k & PACF(k) & T-STAT & P-value \tabularnewline
1 & 0.935143 & 9.7183 & 0 \tabularnewline
2 & -0.205275 & -2.1333 & 0.017583 \tabularnewline
3 & -0.031295 & -0.3252 & 0.372818 \tabularnewline
4 & -0.045977 & -0.4778 & 0.316878 \tabularnewline
5 & 0.035415 & 0.368 & 0.356782 \tabularnewline
6 & 0.067663 & 0.7032 & 0.24173 \tabularnewline
7 & 0.037589 & 0.3906 & 0.348419 \tabularnewline
8 & 0.128915 & 1.3397 & 0.091574 \tabularnewline
9 & 0.029029 & 0.3017 & 0.381739 \tabularnewline
10 & 0.060303 & 0.6267 & 0.266092 \tabularnewline
11 & 0.012482 & 0.1297 & 0.448518 \tabularnewline
12 & 0.072633 & 0.7548 & 0.225998 \tabularnewline
13 & 0.006032 & 0.0627 & 0.475064 \tabularnewline
14 & 0.114541 & 1.1903 & 0.11826 \tabularnewline
15 & -0.059396 & -0.6173 & 0.26918 \tabularnewline
16 & -0.068035 & -0.707 & 0.240533 \tabularnewline
17 & -0.083945 & -0.8724 & 0.192467 \tabularnewline
18 & -0.033526 & -0.3484 & 0.364106 \tabularnewline
19 & -0.042901 & -0.4458 & 0.328301 \tabularnewline
20 & 0.039027 & 0.4056 & 0.342925 \tabularnewline
21 & -0.119339 & -1.2402 & 0.108792 \tabularnewline
22 & -0.100791 & -1.0475 & 0.148615 \tabularnewline
23 & 0.02691 & 0.2797 & 0.390137 \tabularnewline
24 & -0.035617 & -0.3701 & 0.356001 \tabularnewline
25 & 0.186561 & 1.9388 & 0.027567 \tabularnewline
26 & 0.033185 & 0.3449 & 0.365431 \tabularnewline
27 & 0.08891 & 0.924 & 0.178777 \tabularnewline
28 & -0.060628 & -0.6301 & 0.264992 \tabularnewline
29 & 0.033967 & 0.353 & 0.362392 \tabularnewline
30 & 0.047592 & 0.4946 & 0.310948 \tabularnewline
31 & -0.045508 & -0.4729 & 0.318608 \tabularnewline
32 & -0.061443 & -0.6385 & 0.262238 \tabularnewline
33 & -0.065174 & -0.6773 & 0.249829 \tabularnewline
34 & -0.029776 & -0.3094 & 0.378792 \tabularnewline
35 & -0.098343 & -1.022 & 0.154529 \tabularnewline
36 & -0.161158 & -1.6748 & 0.048433 \tabularnewline
37 & 0.053865 & 0.5598 & 0.288394 \tabularnewline
38 & -0.014883 & -0.1547 & 0.438685 \tabularnewline
39 & 0.049348 & 0.5128 & 0.304556 \tabularnewline
40 & -0.154436 & -1.605 & 0.055713 \tabularnewline
41 & 0.035895 & 0.373 & 0.354929 \tabularnewline
42 & 0.057231 & 0.5948 & 0.276622 \tabularnewline
43 & -0.033262 & -0.3457 & 0.365133 \tabularnewline
44 & -0.008279 & -0.086 & 0.465797 \tabularnewline
45 & 0.015403 & 0.1601 & 0.436562 \tabularnewline
46 & -0.021847 & -0.227 & 0.410412 \tabularnewline
47 & 0.068347 & 0.7103 & 0.239531 \tabularnewline
48 & 0.004142 & 0.043 & 0.482872 \tabularnewline
\hline
\end{tabular}
%Source: https://freestatistics.org/blog/index.php?pk=283020&T=2

[TABLE]
[ROW][C]Partial Autocorrelation Function[/C][/ROW]
[ROW][C]Time lag k[/C][C]PACF(k)[/C][C]T-STAT[/C][C]P-value[/C][/ROW]
[ROW][C]1[/C][C]0.935143[/C][C]9.7183[/C][C]0[/C][/ROW]
[ROW][C]2[/C][C]-0.205275[/C][C]-2.1333[/C][C]0.017583[/C][/ROW]
[ROW][C]3[/C][C]-0.031295[/C][C]-0.3252[/C][C]0.372818[/C][/ROW]
[ROW][C]4[/C][C]-0.045977[/C][C]-0.4778[/C][C]0.316878[/C][/ROW]
[ROW][C]5[/C][C]0.035415[/C][C]0.368[/C][C]0.356782[/C][/ROW]
[ROW][C]6[/C][C]0.067663[/C][C]0.7032[/C][C]0.24173[/C][/ROW]
[ROW][C]7[/C][C]0.037589[/C][C]0.3906[/C][C]0.348419[/C][/ROW]
[ROW][C]8[/C][C]0.128915[/C][C]1.3397[/C][C]0.091574[/C][/ROW]
[ROW][C]9[/C][C]0.029029[/C][C]0.3017[/C][C]0.381739[/C][/ROW]
[ROW][C]10[/C][C]0.060303[/C][C]0.6267[/C][C]0.266092[/C][/ROW]
[ROW][C]11[/C][C]0.012482[/C][C]0.1297[/C][C]0.448518[/C][/ROW]
[ROW][C]12[/C][C]0.072633[/C][C]0.7548[/C][C]0.225998[/C][/ROW]
[ROW][C]13[/C][C]0.006032[/C][C]0.0627[/C][C]0.475064[/C][/ROW]
[ROW][C]14[/C][C]0.114541[/C][C]1.1903[/C][C]0.11826[/C][/ROW]
[ROW][C]15[/C][C]-0.059396[/C][C]-0.6173[/C][C]0.26918[/C][/ROW]
[ROW][C]16[/C][C]-0.068035[/C][C]-0.707[/C][C]0.240533[/C][/ROW]
[ROW][C]17[/C][C]-0.083945[/C][C]-0.8724[/C][C]0.192467[/C][/ROW]
[ROW][C]18[/C][C]-0.033526[/C][C]-0.3484[/C][C]0.364106[/C][/ROW]
[ROW][C]19[/C][C]-0.042901[/C][C]-0.4458[/C][C]0.328301[/C][/ROW]
[ROW][C]20[/C][C]0.039027[/C][C]0.4056[/C][C]0.342925[/C][/ROW]
[ROW][C]21[/C][C]-0.119339[/C][C]-1.2402[/C][C]0.108792[/C][/ROW]
[ROW][C]22[/C][C]-0.100791[/C][C]-1.0475[/C][C]0.148615[/C][/ROW]
[ROW][C]23[/C][C]0.02691[/C][C]0.2797[/C][C]0.390137[/C][/ROW]
[ROW][C]24[/C][C]-0.035617[/C][C]-0.3701[/C][C]0.356001[/C][/ROW]
[ROW][C]25[/C][C]0.186561[/C][C]1.9388[/C][C]0.027567[/C][/ROW]
[ROW][C]26[/C][C]0.033185[/C][C]0.3449[/C][C]0.365431[/C][/ROW]
[ROW][C]27[/C][C]0.08891[/C][C]0.924[/C][C]0.178777[/C][/ROW]
[ROW][C]28[/C][C]-0.060628[/C][C]-0.6301[/C][C]0.264992[/C][/ROW]
[ROW][C]29[/C][C]0.033967[/C][C]0.353[/C][C]0.362392[/C][/ROW]
[ROW][C]30[/C][C]0.047592[/C][C]0.4946[/C][C]0.310948[/C][/ROW]
[ROW][C]31[/C][C]-0.045508[/C][C]-0.4729[/C][C]0.318608[/C][/ROW]
[ROW][C]32[/C][C]-0.061443[/C][C]-0.6385[/C][C]0.262238[/C][/ROW]
[ROW][C]33[/C][C]-0.065174[/C][C]-0.6773[/C][C]0.249829[/C][/ROW]
[ROW][C]34[/C][C]-0.029776[/C][C]-0.3094[/C][C]0.378792[/C][/ROW]
[ROW][C]35[/C][C]-0.098343[/C][C]-1.022[/C][C]0.154529[/C][/ROW]
[ROW][C]36[/C][C]-0.161158[/C][C]-1.6748[/C][C]0.048433[/C][/ROW]
[ROW][C]37[/C][C]0.053865[/C][C]0.5598[/C][C]0.288394[/C][/ROW]
[ROW][C]38[/C][C]-0.014883[/C][C]-0.1547[/C][C]0.438685[/C][/ROW]
[ROW][C]39[/C][C]0.049348[/C][C]0.5128[/C][C]0.304556[/C][/ROW]
[ROW][C]40[/C][C]-0.154436[/C][C]-1.605[/C][C]0.055713[/C][/ROW]
[ROW][C]41[/C][C]0.035895[/C][C]0.373[/C][C]0.354929[/C][/ROW]
[ROW][C]42[/C][C]0.057231[/C][C]0.5948[/C][C]0.276622[/C][/ROW]
[ROW][C]43[/C][C]-0.033262[/C][C]-0.3457[/C][C]0.365133[/C][/ROW]
[ROW][C]44[/C][C]-0.008279[/C][C]-0.086[/C][C]0.465797[/C][/ROW]
[ROW][C]45[/C][C]0.015403[/C][C]0.1601[/C][C]0.436562[/C][/ROW]
[ROW][C]46[/C][C]-0.021847[/C][C]-0.227[/C][C]0.410412[/C][/ROW]
[ROW][C]47[/C][C]0.068347[/C][C]0.7103[/C][C]0.239531[/C][/ROW]
[ROW][C]48[/C][C]0.004142[/C][C]0.043[/C][C]0.482872[/C][/ROW]
[/TABLE]
Source: https://freestatistics.org/blog/index.php?pk=283020&T=2

Globally Unique Identifier (entire table): ba.freestatistics.org/blog/index.php?pk=283020&T=2

As an alternative you can also use a QR Code:  

The GUIDs for individual cells are displayed in the table below:

Partial Autocorrelation Function
Time lag kPACF(k)T-STATP-value
10.9351439.71830
2-0.205275-2.13330.017583
3-0.031295-0.32520.372818
4-0.045977-0.47780.316878
50.0354150.3680.356782
60.0676630.70320.24173
70.0375890.39060.348419
80.1289151.33970.091574
90.0290290.30170.381739
100.0603030.62670.266092
110.0124820.12970.448518
120.0726330.75480.225998
130.0060320.06270.475064
140.1145411.19030.11826
15-0.059396-0.61730.26918
16-0.068035-0.7070.240533
17-0.083945-0.87240.192467
18-0.033526-0.34840.364106
19-0.042901-0.44580.328301
200.0390270.40560.342925
21-0.119339-1.24020.108792
22-0.100791-1.04750.148615
230.026910.27970.390137
24-0.035617-0.37010.356001
250.1865611.93880.027567
260.0331850.34490.365431
270.088910.9240.178777
28-0.060628-0.63010.264992
290.0339670.3530.362392
300.0475920.49460.310948
31-0.045508-0.47290.318608
32-0.061443-0.63850.262238
33-0.065174-0.67730.249829
34-0.029776-0.30940.378792
35-0.098343-1.0220.154529
36-0.161158-1.67480.048433
370.0538650.55980.288394
38-0.014883-0.15470.438685
390.0493480.51280.304556
40-0.154436-1.6050.055713
410.0358950.3730.354929
420.0572310.59480.276622
43-0.033262-0.34570.365133
44-0.008279-0.0860.465797
450.0154030.16010.436562
46-0.021847-0.2270.410412
470.0683470.71030.239531
480.0041420.0430.482872


Parameters (Session):
par1 = 48 ; par2 = 1 ; par3 = 0 ; par4 = 0 ; par5 = 12 ; par6 = White Noise ; par7 = 0.95 ;
Parameters (R input):
par1 = 48 ; par2 = 1 ; par3 = 0 ; par4 = 0 ; par5 = 12 ; par6 = White Noise ; par7 = 0.95 ; par8 = ;
R code (references can be found in the software module):
if (par1 == 'Default') {
par1 = 10*log10(length(x))
} else {
par1 <- as.numeric(par1)
}
par2 <- as.numeric(par2)
par3 <- as.numeric(par3)
par4 <- as.numeric(par4)
par5 <- as.numeric(par5)
if (par6 == 'White Noise') par6 <- 'white' else par6 <- 'ma'
par7 <- as.numeric(par7)
if (par8 != '') par8 <- as.numeric(par8)
ox <- x
if (par8 == '') {
if (par2 == 0) {
x <- log(x)
} else {
x <- (x ^ par2 - 1) / par2
}
} else {
x <- log(x,base=par8)
}
if (par3 > 0) x <- diff(x,lag=1,difference=par3)
if (par4 > 0) x <- diff(x,lag=par5,difference=par4)
bitmap(file='picts.png')
op <- par(mfrow=c(2,1))
plot(ox,type='l',main='Original Time Series',xlab='time',ylab='value')
if (par8=='') {
mytitle <- paste('Working Time Series (lambda=',par2,', d=',par3,', D=',par4,')',sep='')
mysub <- paste('(lambda=',par2,', d=',par3,', D=',par4,', CI=', par7, ', CI type=',par6,')',sep='')
} else {
mytitle <- paste('Working Time Series (base=',par8,', d=',par3,', D=',par4,')',sep='')
mysub <- paste('(base=',par8,', d=',par3,', D=',par4,', CI=', par7, ', CI type=',par6,')',sep='')
}
plot(x,type='l', main=mytitle,xlab='time',ylab='value')
par(op)
dev.off()
bitmap(file='pic1.png')
racf <- acf(x, par1, main='Autocorrelation', xlab='time lag', ylab='ACF', ci.type=par6, ci=par7, sub=mysub)
dev.off()
bitmap(file='pic2.png')
rpacf <- pacf(x,par1,main='Partial Autocorrelation',xlab='lags',ylab='PACF',sub=mysub)
dev.off()
(myacf <- c(racf$acf))
(mypacf <- c(rpacf$acf))
lengthx <- length(x)
sqrtn <- sqrt(lengthx)
load(file='createtable')
a<-table.start()
a<-table.row.start(a)
a<-table.element(a,'Autocorrelation Function',4,TRUE)
a<-table.row.end(a)
a<-table.row.start(a)
a<-table.element(a,'Time lag k',header=TRUE)
a<-table.element(a,hyperlink('basics.htm','ACF(k)','click here for more information about the Autocorrelation Function'),header=TRUE)
a<-table.element(a,'T-STAT',header=TRUE)
a<-table.element(a,'P-value',header=TRUE)
a<-table.row.end(a)
for (i in 2:(par1+1)) {
a<-table.row.start(a)
a<-table.element(a,i-1,header=TRUE)
a<-table.element(a,round(myacf[i],6))
mytstat <- myacf[i]*sqrtn
a<-table.element(a,round(mytstat,4))
a<-table.element(a,round(1-pt(abs(mytstat),lengthx),6))
a<-table.row.end(a)
}
a<-table.end(a)
table.save(a,file='mytable.tab')
a<-table.start()
a<-table.row.start(a)
a<-table.element(a,'Partial Autocorrelation Function',4,TRUE)
a<-table.row.end(a)
a<-table.row.start(a)
a<-table.element(a,'Time lag k',header=TRUE)
a<-table.element(a,hyperlink('basics.htm','PACF(k)','click here for more information about the Partial Autocorrelation Function'),header=TRUE)
a<-table.element(a,'T-STAT',header=TRUE)
a<-table.element(a,'P-value',header=TRUE)
a<-table.row.end(a)
for (i in 1:par1) {
a<-table.row.start(a)
a<-table.element(a,i,header=TRUE)
a<-table.element(a,round(mypacf[i],6))
mytstat <- mypacf[i]*sqrtn
a<-table.element(a,round(mytstat,4))
a<-table.element(a,round(1-pt(abs(mytstat),lengthx),6))
a<-table.row.end(a)
}
a<-table.end(a)
table.save(a,file='mytable1.tab')