Free Statistics

of Irreproducible Research!

Author's title

Author*Unverified author*
R Software Modulerwasp_autocorrelation.wasp
Title produced by software(Partial) Autocorrelation Function
Date of computationSat, 24 Oct 2015 13:01:26 +0100
Cite this page as followsStatistical Computations at FreeStatistics.org, Office for Research Development and Education, URL https://freestatistics.org/blog/index.php?v=date/2015/Oct/24/t1445688151s9v3ah4hh4eti1o.htm/, Retrieved Wed, 15 May 2024 08:54:22 +0000
Statistical Computations at FreeStatistics.org, Office for Research Development and Education, URL https://freestatistics.org/blog/index.php?pk=283024, Retrieved Wed, 15 May 2024 08:54:22 +0000
QR Codes:

Original text written by user:
IsPrivate?No (this computation is public)
User-defined keywords
Estimated Impact113
Family? (F = Feedback message, R = changed R code, M = changed R Module, P = changed Parameters, D = changed Data)
-       [(Partial) Autocorrelation Function] [partial correlati...] [2015-10-24 12:01:26] [f80e7d2207e498094c9e16c0f447e302] [Current]
Feedback Forum

Post a new message
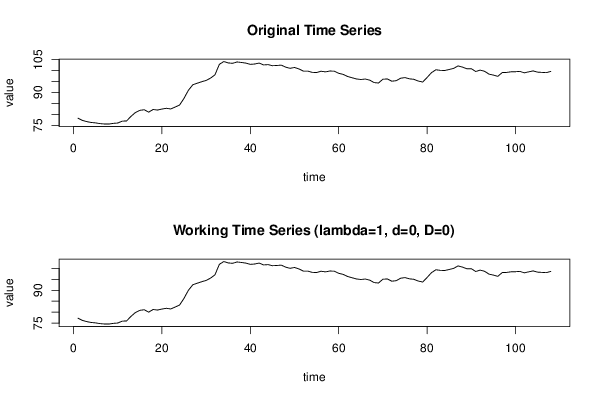
Dataseries X:
78,25
77,24
76,68
76,29
76,1
75,77
75,6
75,57
75,89
76,04
76,89
77
79,09
80,84
81,82
82,12
81,01
82,22
81,97
82,42
82,77
82,46
83,35
84,27
87,34
91,03
93,52
94,24
94,92
95,49
96,55
98,07
102,87
104,12
103,49
103,31
103,92
103,69
103,41
102,83
103
103,42
102,57
102,72
102,22
102,32
102,48
101,56
101,02
101,41
100,74
99,76
99,76
99,17
99,11
99,69
99,4
99,79
99,72
98,74
98,26
97,31
96,73
96,18
95,92
96,13
95,64
94,52
94,31
96,05
96,17
95,14
95,37
96,5
96,79
96,23
96
95,21
94,77
96,84
99,06
100,36
100,09
100,03
100,49
101
102,11
101,59
100,81
100,86
99,57
100,21
99,68
98,38
97,93
97,37
99,08
99,15
99,44
99,48
99,62
98,95
99,42
99,84
99,27
99,16
99,04
99,62


Summary of computational transaction
Raw Inputview raw input (R code)
Raw Outputview raw output of R engine
Computing time1 seconds
R Server'Gwilym Jenkins' @ jenkins.wessa.net

\begin{tabular}{lllllllll}
\hline
Summary of computational transaction \tabularnewline
Raw Input & view raw input (R code)  \tabularnewline
Raw Output & view raw output of R engine  \tabularnewline
Computing time & 1 seconds \tabularnewline
R Server & 'Gwilym Jenkins' @ jenkins.wessa.net \tabularnewline
\hline
\end{tabular}
%Source: https://freestatistics.org/blog/index.php?pk=283024&T=0

[TABLE]
[ROW][C]Summary of computational transaction[/C][/ROW]
[ROW][C]Raw Input[/C][C]view raw input (R code) [/C][/ROW]
[ROW][C]Raw Output[/C][C]view raw output of R engine [/C][/ROW]
[ROW][C]Computing time[/C][C]1 seconds[/C][/ROW]
[ROW][C]R Server[/C][C]'Gwilym Jenkins' @ jenkins.wessa.net[/C][/ROW]
[/TABLE]
Source: https://freestatistics.org/blog/index.php?pk=283024&T=0

Globally Unique Identifier (entire table): ba.freestatistics.org/blog/index.php?pk=283024&T=0

As an alternative you can also use a QR Code:  

The GUIDs for individual cells are displayed in the table below:

Summary of computational transaction
Raw Inputview raw input (R code)
Raw Outputview raw output of R engine
Computing time1 seconds
R Server'Gwilym Jenkins' @ jenkins.wessa.net


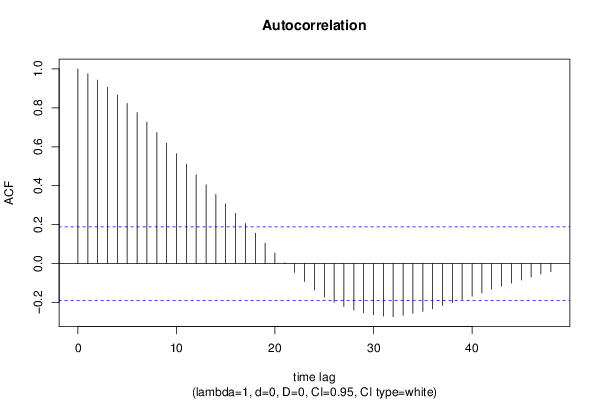
Autocorrelation Function
Time lag kACF(k)T-STATP-value
10.97541710.13680
20.9425139.79490
30.9054239.40940
40.8654588.99410
50.8225998.54870
60.7759978.06440
70.7264777.54980
80.6729796.99380
90.6183756.42630
100.5639855.86110
110.5107985.30840
120.4559064.73793e-06
130.4043414.2022.7e-05
140.3549933.68920.000177
150.3070273.19070.000929
160.2581922.68320.00422
170.2061312.14220.017213
180.1556991.61810.054282
190.1042091.0830.140617
200.053730.55840.288871
210.0037630.03910.484441
22-0.045668-0.47460.318017
23-0.091667-0.95260.171453
24-0.135074-1.40370.081634
25-0.171469-1.7820.038783
26-0.198832-2.06630.020595
27-0.22039-2.29040.011971
28-0.238475-2.47830.007374
29-0.25268-2.62590.004948
30-0.263003-2.73320.003665
31-0.269754-2.80340.002998
32-0.272585-2.83280.002753
33-0.265114-2.75510.003443
34-0.255129-2.65140.004611
35-0.244877-2.54480.006173
36-0.231665-2.40750.008878
37-0.21551-2.23960.013581
38-0.200094-2.07940.019972
39-0.184221-1.91450.029102
40-0.167087-1.73640.04267
41-0.149556-1.55420.061528
42-0.13183-1.370.086761
43-0.115702-1.20240.115917
44-0.099345-1.03240.152091
45-0.084256-0.87560.191591
46-0.069218-0.71930.236743
47-0.053702-0.55810.288971
48-0.041551-0.43180.333368

\begin{tabular}{lllllllll}
\hline
Autocorrelation Function \tabularnewline
Time lag k & ACF(k) & T-STAT & P-value \tabularnewline
1 & 0.975417 & 10.1368 & 0 \tabularnewline
2 & 0.942513 & 9.7949 & 0 \tabularnewline
3 & 0.905423 & 9.4094 & 0 \tabularnewline
4 & 0.865458 & 8.9941 & 0 \tabularnewline
5 & 0.822599 & 8.5487 & 0 \tabularnewline
6 & 0.775997 & 8.0644 & 0 \tabularnewline
7 & 0.726477 & 7.5498 & 0 \tabularnewline
8 & 0.672979 & 6.9938 & 0 \tabularnewline
9 & 0.618375 & 6.4263 & 0 \tabularnewline
10 & 0.563985 & 5.8611 & 0 \tabularnewline
11 & 0.510798 & 5.3084 & 0 \tabularnewline
12 & 0.455906 & 4.7379 & 3e-06 \tabularnewline
13 & 0.404341 & 4.202 & 2.7e-05 \tabularnewline
14 & 0.354993 & 3.6892 & 0.000177 \tabularnewline
15 & 0.307027 & 3.1907 & 0.000929 \tabularnewline
16 & 0.258192 & 2.6832 & 0.00422 \tabularnewline
17 & 0.206131 & 2.1422 & 0.017213 \tabularnewline
18 & 0.155699 & 1.6181 & 0.054282 \tabularnewline
19 & 0.104209 & 1.083 & 0.140617 \tabularnewline
20 & 0.05373 & 0.5584 & 0.288871 \tabularnewline
21 & 0.003763 & 0.0391 & 0.484441 \tabularnewline
22 & -0.045668 & -0.4746 & 0.318017 \tabularnewline
23 & -0.091667 & -0.9526 & 0.171453 \tabularnewline
24 & -0.135074 & -1.4037 & 0.081634 \tabularnewline
25 & -0.171469 & -1.782 & 0.038783 \tabularnewline
26 & -0.198832 & -2.0663 & 0.020595 \tabularnewline
27 & -0.22039 & -2.2904 & 0.011971 \tabularnewline
28 & -0.238475 & -2.4783 & 0.007374 \tabularnewline
29 & -0.25268 & -2.6259 & 0.004948 \tabularnewline
30 & -0.263003 & -2.7332 & 0.003665 \tabularnewline
31 & -0.269754 & -2.8034 & 0.002998 \tabularnewline
32 & -0.272585 & -2.8328 & 0.002753 \tabularnewline
33 & -0.265114 & -2.7551 & 0.003443 \tabularnewline
34 & -0.255129 & -2.6514 & 0.004611 \tabularnewline
35 & -0.244877 & -2.5448 & 0.006173 \tabularnewline
36 & -0.231665 & -2.4075 & 0.008878 \tabularnewline
37 & -0.21551 & -2.2396 & 0.013581 \tabularnewline
38 & -0.200094 & -2.0794 & 0.019972 \tabularnewline
39 & -0.184221 & -1.9145 & 0.029102 \tabularnewline
40 & -0.167087 & -1.7364 & 0.04267 \tabularnewline
41 & -0.149556 & -1.5542 & 0.061528 \tabularnewline
42 & -0.13183 & -1.37 & 0.086761 \tabularnewline
43 & -0.115702 & -1.2024 & 0.115917 \tabularnewline
44 & -0.099345 & -1.0324 & 0.152091 \tabularnewline
45 & -0.084256 & -0.8756 & 0.191591 \tabularnewline
46 & -0.069218 & -0.7193 & 0.236743 \tabularnewline
47 & -0.053702 & -0.5581 & 0.288971 \tabularnewline
48 & -0.041551 & -0.4318 & 0.333368 \tabularnewline
\hline
\end{tabular}
%Source: https://freestatistics.org/blog/index.php?pk=283024&T=1

[TABLE]
[ROW][C]Autocorrelation Function[/C][/ROW]
[ROW][C]Time lag k[/C][C]ACF(k)[/C][C]T-STAT[/C][C]P-value[/C][/ROW]
[ROW][C]1[/C][C]0.975417[/C][C]10.1368[/C][C]0[/C][/ROW]
[ROW][C]2[/C][C]0.942513[/C][C]9.7949[/C][C]0[/C][/ROW]
[ROW][C]3[/C][C]0.905423[/C][C]9.4094[/C][C]0[/C][/ROW]
[ROW][C]4[/C][C]0.865458[/C][C]8.9941[/C][C]0[/C][/ROW]
[ROW][C]5[/C][C]0.822599[/C][C]8.5487[/C][C]0[/C][/ROW]
[ROW][C]6[/C][C]0.775997[/C][C]8.0644[/C][C]0[/C][/ROW]
[ROW][C]7[/C][C]0.726477[/C][C]7.5498[/C][C]0[/C][/ROW]
[ROW][C]8[/C][C]0.672979[/C][C]6.9938[/C][C]0[/C][/ROW]
[ROW][C]9[/C][C]0.618375[/C][C]6.4263[/C][C]0[/C][/ROW]
[ROW][C]10[/C][C]0.563985[/C][C]5.8611[/C][C]0[/C][/ROW]
[ROW][C]11[/C][C]0.510798[/C][C]5.3084[/C][C]0[/C][/ROW]
[ROW][C]12[/C][C]0.455906[/C][C]4.7379[/C][C]3e-06[/C][/ROW]
[ROW][C]13[/C][C]0.404341[/C][C]4.202[/C][C]2.7e-05[/C][/ROW]
[ROW][C]14[/C][C]0.354993[/C][C]3.6892[/C][C]0.000177[/C][/ROW]
[ROW][C]15[/C][C]0.307027[/C][C]3.1907[/C][C]0.000929[/C][/ROW]
[ROW][C]16[/C][C]0.258192[/C][C]2.6832[/C][C]0.00422[/C][/ROW]
[ROW][C]17[/C][C]0.206131[/C][C]2.1422[/C][C]0.017213[/C][/ROW]
[ROW][C]18[/C][C]0.155699[/C][C]1.6181[/C][C]0.054282[/C][/ROW]
[ROW][C]19[/C][C]0.104209[/C][C]1.083[/C][C]0.140617[/C][/ROW]
[ROW][C]20[/C][C]0.05373[/C][C]0.5584[/C][C]0.288871[/C][/ROW]
[ROW][C]21[/C][C]0.003763[/C][C]0.0391[/C][C]0.484441[/C][/ROW]
[ROW][C]22[/C][C]-0.045668[/C][C]-0.4746[/C][C]0.318017[/C][/ROW]
[ROW][C]23[/C][C]-0.091667[/C][C]-0.9526[/C][C]0.171453[/C][/ROW]
[ROW][C]24[/C][C]-0.135074[/C][C]-1.4037[/C][C]0.081634[/C][/ROW]
[ROW][C]25[/C][C]-0.171469[/C][C]-1.782[/C][C]0.038783[/C][/ROW]
[ROW][C]26[/C][C]-0.198832[/C][C]-2.0663[/C][C]0.020595[/C][/ROW]
[ROW][C]27[/C][C]-0.22039[/C][C]-2.2904[/C][C]0.011971[/C][/ROW]
[ROW][C]28[/C][C]-0.238475[/C][C]-2.4783[/C][C]0.007374[/C][/ROW]
[ROW][C]29[/C][C]-0.25268[/C][C]-2.6259[/C][C]0.004948[/C][/ROW]
[ROW][C]30[/C][C]-0.263003[/C][C]-2.7332[/C][C]0.003665[/C][/ROW]
[ROW][C]31[/C][C]-0.269754[/C][C]-2.8034[/C][C]0.002998[/C][/ROW]
[ROW][C]32[/C][C]-0.272585[/C][C]-2.8328[/C][C]0.002753[/C][/ROW]
[ROW][C]33[/C][C]-0.265114[/C][C]-2.7551[/C][C]0.003443[/C][/ROW]
[ROW][C]34[/C][C]-0.255129[/C][C]-2.6514[/C][C]0.004611[/C][/ROW]
[ROW][C]35[/C][C]-0.244877[/C][C]-2.5448[/C][C]0.006173[/C][/ROW]
[ROW][C]36[/C][C]-0.231665[/C][C]-2.4075[/C][C]0.008878[/C][/ROW]
[ROW][C]37[/C][C]-0.21551[/C][C]-2.2396[/C][C]0.013581[/C][/ROW]
[ROW][C]38[/C][C]-0.200094[/C][C]-2.0794[/C][C]0.019972[/C][/ROW]
[ROW][C]39[/C][C]-0.184221[/C][C]-1.9145[/C][C]0.029102[/C][/ROW]
[ROW][C]40[/C][C]-0.167087[/C][C]-1.7364[/C][C]0.04267[/C][/ROW]
[ROW][C]41[/C][C]-0.149556[/C][C]-1.5542[/C][C]0.061528[/C][/ROW]
[ROW][C]42[/C][C]-0.13183[/C][C]-1.37[/C][C]0.086761[/C][/ROW]
[ROW][C]43[/C][C]-0.115702[/C][C]-1.2024[/C][C]0.115917[/C][/ROW]
[ROW][C]44[/C][C]-0.099345[/C][C]-1.0324[/C][C]0.152091[/C][/ROW]
[ROW][C]45[/C][C]-0.084256[/C][C]-0.8756[/C][C]0.191591[/C][/ROW]
[ROW][C]46[/C][C]-0.069218[/C][C]-0.7193[/C][C]0.236743[/C][/ROW]
[ROW][C]47[/C][C]-0.053702[/C][C]-0.5581[/C][C]0.288971[/C][/ROW]
[ROW][C]48[/C][C]-0.041551[/C][C]-0.4318[/C][C]0.333368[/C][/ROW]
[/TABLE]
Source: https://freestatistics.org/blog/index.php?pk=283024&T=1

Globally Unique Identifier (entire table): ba.freestatistics.org/blog/index.php?pk=283024&T=1

As an alternative you can also use a QR Code:  

The GUIDs for individual cells are displayed in the table below:

Autocorrelation Function
Time lag kACF(k)T-STATP-value
10.97541710.13680
20.9425139.79490
30.9054239.40940
40.8654588.99410
50.8225998.54870
60.7759978.06440
70.7264777.54980
80.6729796.99380
90.6183756.42630
100.5639855.86110
110.5107985.30840
120.4559064.73793e-06
130.4043414.2022.7e-05
140.3549933.68920.000177
150.3070273.19070.000929
160.2581922.68320.00422
170.2061312.14220.017213
180.1556991.61810.054282
190.1042091.0830.140617
200.053730.55840.288871
210.0037630.03910.484441
22-0.045668-0.47460.318017
23-0.091667-0.95260.171453
24-0.135074-1.40370.081634
25-0.171469-1.7820.038783
26-0.198832-2.06630.020595
27-0.22039-2.29040.011971
28-0.238475-2.47830.007374
29-0.25268-2.62590.004948
30-0.263003-2.73320.003665
31-0.269754-2.80340.002998
32-0.272585-2.83280.002753
33-0.265114-2.75510.003443
34-0.255129-2.65140.004611
35-0.244877-2.54480.006173
36-0.231665-2.40750.008878
37-0.21551-2.23960.013581
38-0.200094-2.07940.019972
39-0.184221-1.91450.029102
40-0.167087-1.73640.04267
41-0.149556-1.55420.061528
42-0.13183-1.370.086761
43-0.115702-1.20240.115917
44-0.099345-1.03240.152091
45-0.084256-0.87560.191591
46-0.069218-0.71930.236743
47-0.053702-0.55810.288971
48-0.041551-0.43180.333368


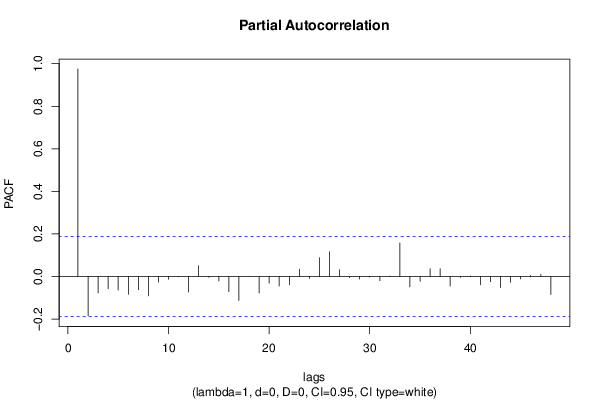
Partial Autocorrelation Function
Time lag kPACF(k)T-STATP-value
10.97541710.13680
2-0.183775-1.90980.029403
3-0.077052-0.80070.212518
4-0.057382-0.59630.276102
5-0.063797-0.6630.254373
6-0.082993-0.86250.195166
7-0.061858-0.64290.260842
8-0.090842-0.94410.173623
9-0.025566-0.26570.395494
10-0.012979-0.13490.446477
11-0.00138-0.01430.494291
12-0.073186-0.76060.224286
130.0509930.52990.298621
14-0.00355-0.03690.485318
15-0.021285-0.22120.412678
16-0.072011-0.74840.227935
17-0.112756-1.17180.121929
18-0.000217-0.00230.499103
19-0.077628-0.80670.210797
20-0.031152-0.32370.373379
21-0.044644-0.4640.321807
22-0.038458-0.39970.345097
230.0345590.35920.360092
24-0.008632-0.08970.464345
250.0882030.91660.18069
260.1166891.21270.113951
270.0317190.32960.371157
28-0.005417-0.05630.477605
29-0.012059-0.12530.450252
30-0.002155-0.02240.491089
31-0.019363-0.20120.42045
320.0008650.0090.49642
330.1577781.63970.051991
34-0.048606-0.50510.307248
35-0.022495-0.23380.4078
360.0363920.37820.353012
370.0364410.37870.352823
38-0.044815-0.46570.321171
39-0.003257-0.03390.486529
400.0026790.02780.488922
41-0.038924-0.40450.34332
42-0.024553-0.25520.399543
43-0.051841-0.53880.295583
44-0.027594-0.28680.387421
45-0.011143-0.11580.454011
460.0052730.05480.4782
470.0097650.10150.459677
48-0.084378-0.87690.191249

\begin{tabular}{lllllllll}
\hline
Partial Autocorrelation Function \tabularnewline
Time lag k & PACF(k) & T-STAT & P-value \tabularnewline
1 & 0.975417 & 10.1368 & 0 \tabularnewline
2 & -0.183775 & -1.9098 & 0.029403 \tabularnewline
3 & -0.077052 & -0.8007 & 0.212518 \tabularnewline
4 & -0.057382 & -0.5963 & 0.276102 \tabularnewline
5 & -0.063797 & -0.663 & 0.254373 \tabularnewline
6 & -0.082993 & -0.8625 & 0.195166 \tabularnewline
7 & -0.061858 & -0.6429 & 0.260842 \tabularnewline
8 & -0.090842 & -0.9441 & 0.173623 \tabularnewline
9 & -0.025566 & -0.2657 & 0.395494 \tabularnewline
10 & -0.012979 & -0.1349 & 0.446477 \tabularnewline
11 & -0.00138 & -0.0143 & 0.494291 \tabularnewline
12 & -0.073186 & -0.7606 & 0.224286 \tabularnewline
13 & 0.050993 & 0.5299 & 0.298621 \tabularnewline
14 & -0.00355 & -0.0369 & 0.485318 \tabularnewline
15 & -0.021285 & -0.2212 & 0.412678 \tabularnewline
16 & -0.072011 & -0.7484 & 0.227935 \tabularnewline
17 & -0.112756 & -1.1718 & 0.121929 \tabularnewline
18 & -0.000217 & -0.0023 & 0.499103 \tabularnewline
19 & -0.077628 & -0.8067 & 0.210797 \tabularnewline
20 & -0.031152 & -0.3237 & 0.373379 \tabularnewline
21 & -0.044644 & -0.464 & 0.321807 \tabularnewline
22 & -0.038458 & -0.3997 & 0.345097 \tabularnewline
23 & 0.034559 & 0.3592 & 0.360092 \tabularnewline
24 & -0.008632 & -0.0897 & 0.464345 \tabularnewline
25 & 0.088203 & 0.9166 & 0.18069 \tabularnewline
26 & 0.116689 & 1.2127 & 0.113951 \tabularnewline
27 & 0.031719 & 0.3296 & 0.371157 \tabularnewline
28 & -0.005417 & -0.0563 & 0.477605 \tabularnewline
29 & -0.012059 & -0.1253 & 0.450252 \tabularnewline
30 & -0.002155 & -0.0224 & 0.491089 \tabularnewline
31 & -0.019363 & -0.2012 & 0.42045 \tabularnewline
32 & 0.000865 & 0.009 & 0.49642 \tabularnewline
33 & 0.157778 & 1.6397 & 0.051991 \tabularnewline
34 & -0.048606 & -0.5051 & 0.307248 \tabularnewline
35 & -0.022495 & -0.2338 & 0.4078 \tabularnewline
36 & 0.036392 & 0.3782 & 0.353012 \tabularnewline
37 & 0.036441 & 0.3787 & 0.352823 \tabularnewline
38 & -0.044815 & -0.4657 & 0.321171 \tabularnewline
39 & -0.003257 & -0.0339 & 0.486529 \tabularnewline
40 & 0.002679 & 0.0278 & 0.488922 \tabularnewline
41 & -0.038924 & -0.4045 & 0.34332 \tabularnewline
42 & -0.024553 & -0.2552 & 0.399543 \tabularnewline
43 & -0.051841 & -0.5388 & 0.295583 \tabularnewline
44 & -0.027594 & -0.2868 & 0.387421 \tabularnewline
45 & -0.011143 & -0.1158 & 0.454011 \tabularnewline
46 & 0.005273 & 0.0548 & 0.4782 \tabularnewline
47 & 0.009765 & 0.1015 & 0.459677 \tabularnewline
48 & -0.084378 & -0.8769 & 0.191249 \tabularnewline
\hline
\end{tabular}
%Source: https://freestatistics.org/blog/index.php?pk=283024&T=2

[TABLE]
[ROW][C]Partial Autocorrelation Function[/C][/ROW]
[ROW][C]Time lag k[/C][C]PACF(k)[/C][C]T-STAT[/C][C]P-value[/C][/ROW]
[ROW][C]1[/C][C]0.975417[/C][C]10.1368[/C][C]0[/C][/ROW]
[ROW][C]2[/C][C]-0.183775[/C][C]-1.9098[/C][C]0.029403[/C][/ROW]
[ROW][C]3[/C][C]-0.077052[/C][C]-0.8007[/C][C]0.212518[/C][/ROW]
[ROW][C]4[/C][C]-0.057382[/C][C]-0.5963[/C][C]0.276102[/C][/ROW]
[ROW][C]5[/C][C]-0.063797[/C][C]-0.663[/C][C]0.254373[/C][/ROW]
[ROW][C]6[/C][C]-0.082993[/C][C]-0.8625[/C][C]0.195166[/C][/ROW]
[ROW][C]7[/C][C]-0.061858[/C][C]-0.6429[/C][C]0.260842[/C][/ROW]
[ROW][C]8[/C][C]-0.090842[/C][C]-0.9441[/C][C]0.173623[/C][/ROW]
[ROW][C]9[/C][C]-0.025566[/C][C]-0.2657[/C][C]0.395494[/C][/ROW]
[ROW][C]10[/C][C]-0.012979[/C][C]-0.1349[/C][C]0.446477[/C][/ROW]
[ROW][C]11[/C][C]-0.00138[/C][C]-0.0143[/C][C]0.494291[/C][/ROW]
[ROW][C]12[/C][C]-0.073186[/C][C]-0.7606[/C][C]0.224286[/C][/ROW]
[ROW][C]13[/C][C]0.050993[/C][C]0.5299[/C][C]0.298621[/C][/ROW]
[ROW][C]14[/C][C]-0.00355[/C][C]-0.0369[/C][C]0.485318[/C][/ROW]
[ROW][C]15[/C][C]-0.021285[/C][C]-0.2212[/C][C]0.412678[/C][/ROW]
[ROW][C]16[/C][C]-0.072011[/C][C]-0.7484[/C][C]0.227935[/C][/ROW]
[ROW][C]17[/C][C]-0.112756[/C][C]-1.1718[/C][C]0.121929[/C][/ROW]
[ROW][C]18[/C][C]-0.000217[/C][C]-0.0023[/C][C]0.499103[/C][/ROW]
[ROW][C]19[/C][C]-0.077628[/C][C]-0.8067[/C][C]0.210797[/C][/ROW]
[ROW][C]20[/C][C]-0.031152[/C][C]-0.3237[/C][C]0.373379[/C][/ROW]
[ROW][C]21[/C][C]-0.044644[/C][C]-0.464[/C][C]0.321807[/C][/ROW]
[ROW][C]22[/C][C]-0.038458[/C][C]-0.3997[/C][C]0.345097[/C][/ROW]
[ROW][C]23[/C][C]0.034559[/C][C]0.3592[/C][C]0.360092[/C][/ROW]
[ROW][C]24[/C][C]-0.008632[/C][C]-0.0897[/C][C]0.464345[/C][/ROW]
[ROW][C]25[/C][C]0.088203[/C][C]0.9166[/C][C]0.18069[/C][/ROW]
[ROW][C]26[/C][C]0.116689[/C][C]1.2127[/C][C]0.113951[/C][/ROW]
[ROW][C]27[/C][C]0.031719[/C][C]0.3296[/C][C]0.371157[/C][/ROW]
[ROW][C]28[/C][C]-0.005417[/C][C]-0.0563[/C][C]0.477605[/C][/ROW]
[ROW][C]29[/C][C]-0.012059[/C][C]-0.1253[/C][C]0.450252[/C][/ROW]
[ROW][C]30[/C][C]-0.002155[/C][C]-0.0224[/C][C]0.491089[/C][/ROW]
[ROW][C]31[/C][C]-0.019363[/C][C]-0.2012[/C][C]0.42045[/C][/ROW]
[ROW][C]32[/C][C]0.000865[/C][C]0.009[/C][C]0.49642[/C][/ROW]
[ROW][C]33[/C][C]0.157778[/C][C]1.6397[/C][C]0.051991[/C][/ROW]
[ROW][C]34[/C][C]-0.048606[/C][C]-0.5051[/C][C]0.307248[/C][/ROW]
[ROW][C]35[/C][C]-0.022495[/C][C]-0.2338[/C][C]0.4078[/C][/ROW]
[ROW][C]36[/C][C]0.036392[/C][C]0.3782[/C][C]0.353012[/C][/ROW]
[ROW][C]37[/C][C]0.036441[/C][C]0.3787[/C][C]0.352823[/C][/ROW]
[ROW][C]38[/C][C]-0.044815[/C][C]-0.4657[/C][C]0.321171[/C][/ROW]
[ROW][C]39[/C][C]-0.003257[/C][C]-0.0339[/C][C]0.486529[/C][/ROW]
[ROW][C]40[/C][C]0.002679[/C][C]0.0278[/C][C]0.488922[/C][/ROW]
[ROW][C]41[/C][C]-0.038924[/C][C]-0.4045[/C][C]0.34332[/C][/ROW]
[ROW][C]42[/C][C]-0.024553[/C][C]-0.2552[/C][C]0.399543[/C][/ROW]
[ROW][C]43[/C][C]-0.051841[/C][C]-0.5388[/C][C]0.295583[/C][/ROW]
[ROW][C]44[/C][C]-0.027594[/C][C]-0.2868[/C][C]0.387421[/C][/ROW]
[ROW][C]45[/C][C]-0.011143[/C][C]-0.1158[/C][C]0.454011[/C][/ROW]
[ROW][C]46[/C][C]0.005273[/C][C]0.0548[/C][C]0.4782[/C][/ROW]
[ROW][C]47[/C][C]0.009765[/C][C]0.1015[/C][C]0.459677[/C][/ROW]
[ROW][C]48[/C][C]-0.084378[/C][C]-0.8769[/C][C]0.191249[/C][/ROW]
[/TABLE]
Source: https://freestatistics.org/blog/index.php?pk=283024&T=2

Globally Unique Identifier (entire table): ba.freestatistics.org/blog/index.php?pk=283024&T=2

As an alternative you can also use a QR Code:  

The GUIDs for individual cells are displayed in the table below:

Partial Autocorrelation Function
Time lag kPACF(k)T-STATP-value
10.97541710.13680
2-0.183775-1.90980.029403
3-0.077052-0.80070.212518
4-0.057382-0.59630.276102
5-0.063797-0.6630.254373
6-0.082993-0.86250.195166
7-0.061858-0.64290.260842
8-0.090842-0.94410.173623
9-0.025566-0.26570.395494
10-0.012979-0.13490.446477
11-0.00138-0.01430.494291
12-0.073186-0.76060.224286
130.0509930.52990.298621
14-0.00355-0.03690.485318
15-0.021285-0.22120.412678
16-0.072011-0.74840.227935
17-0.112756-1.17180.121929
18-0.000217-0.00230.499103
19-0.077628-0.80670.210797
20-0.031152-0.32370.373379
21-0.044644-0.4640.321807
22-0.038458-0.39970.345097
230.0345590.35920.360092
24-0.008632-0.08970.464345
250.0882030.91660.18069
260.1166891.21270.113951
270.0317190.32960.371157
28-0.005417-0.05630.477605
29-0.012059-0.12530.450252
30-0.002155-0.02240.491089
31-0.019363-0.20120.42045
320.0008650.0090.49642
330.1577781.63970.051991
34-0.048606-0.50510.307248
35-0.022495-0.23380.4078
360.0363920.37820.353012
370.0364410.37870.352823
38-0.044815-0.46570.321171
39-0.003257-0.03390.486529
400.0026790.02780.488922
41-0.038924-0.40450.34332
42-0.024553-0.25520.399543
43-0.051841-0.53880.295583
44-0.027594-0.28680.387421
45-0.011143-0.11580.454011
460.0052730.05480.4782
470.0097650.10150.459677
48-0.084378-0.87690.191249


Parameters (Session):
par1 = 48 ; par2 = 1 ; par3 = 0 ; par4 = 0 ; par5 = 12 ; par6 = White Noise ; par7 = 0.95 ;
Parameters (R input):
par1 = 48 ; par2 = 1 ; par3 = 0 ; par4 = 0 ; par5 = 12 ; par6 = White Noise ; par7 = 0.95 ; par8 = ;
R code (references can be found in the software module):
if (par1 == 'Default') {
par1 = 10*log10(length(x))
} else {
par1 <- as.numeric(par1)
}
par2 <- as.numeric(par2)
par3 <- as.numeric(par3)
par4 <- as.numeric(par4)
par5 <- as.numeric(par5)
if (par6 == 'White Noise') par6 <- 'white' else par6 <- 'ma'
par7 <- as.numeric(par7)
if (par8 != '') par8 <- as.numeric(par8)
ox <- x
if (par8 == '') {
if (par2 == 0) {
x <- log(x)
} else {
x <- (x ^ par2 - 1) / par2
}
} else {
x <- log(x,base=par8)
}
if (par3 > 0) x <- diff(x,lag=1,difference=par3)
if (par4 > 0) x <- diff(x,lag=par5,difference=par4)
bitmap(file='picts.png')
op <- par(mfrow=c(2,1))
plot(ox,type='l',main='Original Time Series',xlab='time',ylab='value')
if (par8=='') {
mytitle <- paste('Working Time Series (lambda=',par2,', d=',par3,', D=',par4,')',sep='')
mysub <- paste('(lambda=',par2,', d=',par3,', D=',par4,', CI=', par7, ', CI type=',par6,')',sep='')
} else {
mytitle <- paste('Working Time Series (base=',par8,', d=',par3,', D=',par4,')',sep='')
mysub <- paste('(base=',par8,', d=',par3,', D=',par4,', CI=', par7, ', CI type=',par6,')',sep='')
}
plot(x,type='l', main=mytitle,xlab='time',ylab='value')
par(op)
dev.off()
bitmap(file='pic1.png')
racf <- acf(x, par1, main='Autocorrelation', xlab='time lag', ylab='ACF', ci.type=par6, ci=par7, sub=mysub)
dev.off()
bitmap(file='pic2.png')
rpacf <- pacf(x,par1,main='Partial Autocorrelation',xlab='lags',ylab='PACF',sub=mysub)
dev.off()
(myacf <- c(racf$acf))
(mypacf <- c(rpacf$acf))
lengthx <- length(x)
sqrtn <- sqrt(lengthx)
load(file='createtable')
a<-table.start()
a<-table.row.start(a)
a<-table.element(a,'Autocorrelation Function',4,TRUE)
a<-table.row.end(a)
a<-table.row.start(a)
a<-table.element(a,'Time lag k',header=TRUE)
a<-table.element(a,hyperlink('basics.htm','ACF(k)','click here for more information about the Autocorrelation Function'),header=TRUE)
a<-table.element(a,'T-STAT',header=TRUE)
a<-table.element(a,'P-value',header=TRUE)
a<-table.row.end(a)
for (i in 2:(par1+1)) {
a<-table.row.start(a)
a<-table.element(a,i-1,header=TRUE)
a<-table.element(a,round(myacf[i],6))
mytstat <- myacf[i]*sqrtn
a<-table.element(a,round(mytstat,4))
a<-table.element(a,round(1-pt(abs(mytstat),lengthx),6))
a<-table.row.end(a)
}
a<-table.end(a)
table.save(a,file='mytable.tab')
a<-table.start()
a<-table.row.start(a)
a<-table.element(a,'Partial Autocorrelation Function',4,TRUE)
a<-table.row.end(a)
a<-table.row.start(a)
a<-table.element(a,'Time lag k',header=TRUE)
a<-table.element(a,hyperlink('basics.htm','PACF(k)','click here for more information about the Partial Autocorrelation Function'),header=TRUE)
a<-table.element(a,'T-STAT',header=TRUE)
a<-table.element(a,'P-value',header=TRUE)
a<-table.row.end(a)
for (i in 1:par1) {
a<-table.row.start(a)
a<-table.element(a,i,header=TRUE)
a<-table.element(a,round(mypacf[i],6))
mytstat <- mypacf[i]*sqrtn
a<-table.element(a,round(mytstat,4))
a<-table.element(a,round(1-pt(abs(mytstat),lengthx),6))
a<-table.row.end(a)
}
a<-table.end(a)
table.save(a,file='mytable1.tab')