Free Statistics

of Irreproducible Research!

Author's title

Author*Unverified author*
R Software Modulerwasp_autocorrelation.wasp
Title produced by software(Partial) Autocorrelation Function
Date of computationSat, 24 Oct 2015 14:48:43 +0100
Cite this page as followsStatistical Computations at FreeStatistics.org, Office for Research Development and Education, URL https://freestatistics.org/blog/index.php?v=date/2015/Oct/24/t144569455335gsoxtk97ot25r.htm/, Retrieved Wed, 15 May 2024 17:09:26 +0000
Statistical Computations at FreeStatistics.org, Office for Research Development and Education, URL https://freestatistics.org/blog/index.php?pk=283041, Retrieved Wed, 15 May 2024 17:09:26 +0000
QR Codes:

Original text written by user:
IsPrivate?No (this computation is public)
User-defined keywords
Estimated Impact117
Family? (F = Feedback message, R = changed R code, M = changed R Module, P = changed Parameters, D = changed Data)
-       [(Partial) Autocorrelation Function] [] [2015-10-24 13:48:43] [4b96c7bb02a36edde4d8c72e28fc1c90] [Current]
Feedback Forum

Post a new message
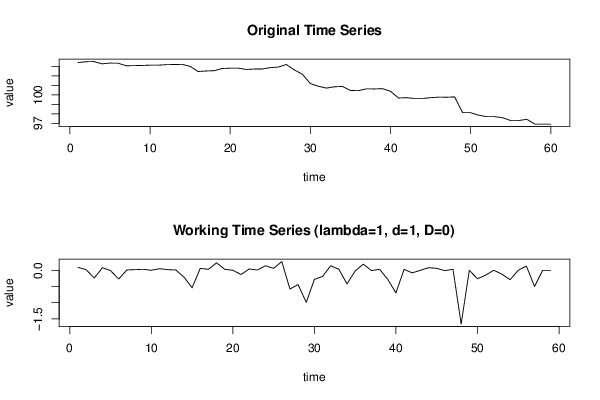
Dataseries X:
103.4
103.49
103.51
103.27
103.35
103.34
103.07
103.08
103.1
103.13
103.13
103.18
103.2
103.21
103
102.46
102.52
102.55
102.78
102.81
102.81
102.68
102.72
102.73
102.87
102.93
103.2
102.62
102.18
101.19
100.91
100.72
100.86
100.89
100.47
100.45
100.64
100.63
100.66
100.38
99.68
99.71
99.63
99.63
99.71
99.77
99.76
99.79
98.13
98.13
97.87
97.72
97.72
97.6
97.31
97.31
97.44
96.94
96.94
96.94


Summary of computational transaction
Raw Inputview raw input (R code)
Raw Outputview raw output of R engine
Computing time1 seconds
R Server'George Udny Yule' @ yule.wessa.net

\begin{tabular}{lllllllll}
\hline
Summary of computational transaction \tabularnewline
Raw Input & view raw input (R code)  \tabularnewline
Raw Output & view raw output of R engine  \tabularnewline
Computing time & 1 seconds \tabularnewline
R Server & 'George Udny Yule' @ yule.wessa.net \tabularnewline
\hline
\end{tabular}
%Source: https://freestatistics.org/blog/index.php?pk=283041&T=0

[TABLE]
[ROW][C]Summary of computational transaction[/C][/ROW]
[ROW][C]Raw Input[/C][C]view raw input (R code) [/C][/ROW]
[ROW][C]Raw Output[/C][C]view raw output of R engine [/C][/ROW]
[ROW][C]Computing time[/C][C]1 seconds[/C][/ROW]
[ROW][C]R Server[/C][C]'George Udny Yule' @ yule.wessa.net[/C][/ROW]
[/TABLE]
Source: https://freestatistics.org/blog/index.php?pk=283041&T=0

Globally Unique Identifier (entire table): ba.freestatistics.org/blog/index.php?pk=283041&T=0

As an alternative you can also use a QR Code:  

The GUIDs for individual cells are displayed in the table below:

Summary of computational transaction
Raw Inputview raw input (R code)
Raw Outputview raw output of R engine
Computing time1 seconds
R Server'George Udny Yule' @ yule.wessa.net


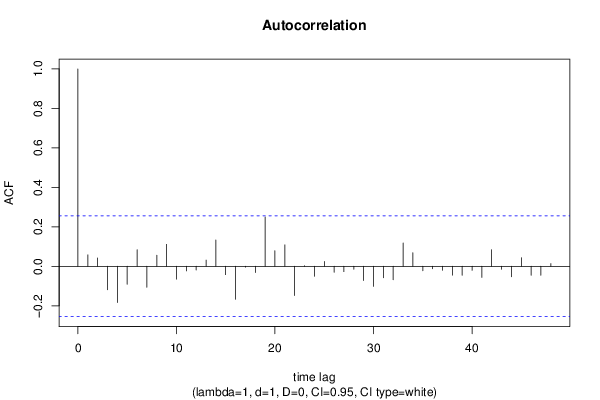
Autocorrelation Function
Time lag kACF(k)T-STATP-value
10.0578880.44460.329101
20.0420040.32260.374054
3-0.118829-0.91270.182547
4-0.183321-1.40810.082172
5-0.090758-0.69710.244232
60.0839590.64490.260745
7-0.106185-0.81560.208999
80.0558710.42920.334688
90.1110150.85270.198632
10-0.064932-0.49870.309905
11-0.023199-0.17820.429589
12-0.018942-0.14550.442408
130.0312590.24010.40554
140.1336471.02660.154408
15-0.042283-0.32480.373247
16-0.166981-1.28260.102323
17-0.004408-0.03390.486553
18-0.03121-0.23970.405685
190.2500521.92070.029804
200.0791120.60770.272868
210.1086770.83480.203609
22-0.148015-1.13690.130083
230.0029120.02240.491116
24-0.050426-0.38730.349954
250.0243830.18730.426039
26-0.030567-0.23480.407592
27-0.02696-0.20710.41833
28-0.014681-0.11280.455299
29-0.072417-0.55620.290073
30-0.101834-0.78220.218612
31-0.058127-0.44650.328441
32-0.068495-0.52610.30039
330.1178850.90550.184444
340.0690510.53040.298916
35-0.022311-0.17140.432257
36-0.012223-0.09390.46276
37-0.019763-0.15180.43993
38-0.044915-0.3450.365662
39-0.045699-0.3510.363412
40-0.020529-0.15770.437622
41-0.056148-0.43130.333917
420.0841110.64610.260369
43-0.014813-0.11380.4549
44-0.053225-0.40880.342074
450.0429340.32980.371365
46-0.045563-0.350.363802
47-0.045593-0.35020.363716
480.0134430.10330.459054

\begin{tabular}{lllllllll}
\hline
Autocorrelation Function \tabularnewline
Time lag k & ACF(k) & T-STAT & P-value \tabularnewline
1 & 0.057888 & 0.4446 & 0.329101 \tabularnewline
2 & 0.042004 & 0.3226 & 0.374054 \tabularnewline
3 & -0.118829 & -0.9127 & 0.182547 \tabularnewline
4 & -0.183321 & -1.4081 & 0.082172 \tabularnewline
5 & -0.090758 & -0.6971 & 0.244232 \tabularnewline
6 & 0.083959 & 0.6449 & 0.260745 \tabularnewline
7 & -0.106185 & -0.8156 & 0.208999 \tabularnewline
8 & 0.055871 & 0.4292 & 0.334688 \tabularnewline
9 & 0.111015 & 0.8527 & 0.198632 \tabularnewline
10 & -0.064932 & -0.4987 & 0.309905 \tabularnewline
11 & -0.023199 & -0.1782 & 0.429589 \tabularnewline
12 & -0.018942 & -0.1455 & 0.442408 \tabularnewline
13 & 0.031259 & 0.2401 & 0.40554 \tabularnewline
14 & 0.133647 & 1.0266 & 0.154408 \tabularnewline
15 & -0.042283 & -0.3248 & 0.373247 \tabularnewline
16 & -0.166981 & -1.2826 & 0.102323 \tabularnewline
17 & -0.004408 & -0.0339 & 0.486553 \tabularnewline
18 & -0.03121 & -0.2397 & 0.405685 \tabularnewline
19 & 0.250052 & 1.9207 & 0.029804 \tabularnewline
20 & 0.079112 & 0.6077 & 0.272868 \tabularnewline
21 & 0.108677 & 0.8348 & 0.203609 \tabularnewline
22 & -0.148015 & -1.1369 & 0.130083 \tabularnewline
23 & 0.002912 & 0.0224 & 0.491116 \tabularnewline
24 & -0.050426 & -0.3873 & 0.349954 \tabularnewline
25 & 0.024383 & 0.1873 & 0.426039 \tabularnewline
26 & -0.030567 & -0.2348 & 0.407592 \tabularnewline
27 & -0.02696 & -0.2071 & 0.41833 \tabularnewline
28 & -0.014681 & -0.1128 & 0.455299 \tabularnewline
29 & -0.072417 & -0.5562 & 0.290073 \tabularnewline
30 & -0.101834 & -0.7822 & 0.218612 \tabularnewline
31 & -0.058127 & -0.4465 & 0.328441 \tabularnewline
32 & -0.068495 & -0.5261 & 0.30039 \tabularnewline
33 & 0.117885 & 0.9055 & 0.184444 \tabularnewline
34 & 0.069051 & 0.5304 & 0.298916 \tabularnewline
35 & -0.022311 & -0.1714 & 0.432257 \tabularnewline
36 & -0.012223 & -0.0939 & 0.46276 \tabularnewline
37 & -0.019763 & -0.1518 & 0.43993 \tabularnewline
38 & -0.044915 & -0.345 & 0.365662 \tabularnewline
39 & -0.045699 & -0.351 & 0.363412 \tabularnewline
40 & -0.020529 & -0.1577 & 0.437622 \tabularnewline
41 & -0.056148 & -0.4313 & 0.333917 \tabularnewline
42 & 0.084111 & 0.6461 & 0.260369 \tabularnewline
43 & -0.014813 & -0.1138 & 0.4549 \tabularnewline
44 & -0.053225 & -0.4088 & 0.342074 \tabularnewline
45 & 0.042934 & 0.3298 & 0.371365 \tabularnewline
46 & -0.045563 & -0.35 & 0.363802 \tabularnewline
47 & -0.045593 & -0.3502 & 0.363716 \tabularnewline
48 & 0.013443 & 0.1033 & 0.459054 \tabularnewline
\hline
\end{tabular}
%Source: https://freestatistics.org/blog/index.php?pk=283041&T=1

[TABLE]
[ROW][C]Autocorrelation Function[/C][/ROW]
[ROW][C]Time lag k[/C][C]ACF(k)[/C][C]T-STAT[/C][C]P-value[/C][/ROW]
[ROW][C]1[/C][C]0.057888[/C][C]0.4446[/C][C]0.329101[/C][/ROW]
[ROW][C]2[/C][C]0.042004[/C][C]0.3226[/C][C]0.374054[/C][/ROW]
[ROW][C]3[/C][C]-0.118829[/C][C]-0.9127[/C][C]0.182547[/C][/ROW]
[ROW][C]4[/C][C]-0.183321[/C][C]-1.4081[/C][C]0.082172[/C][/ROW]
[ROW][C]5[/C][C]-0.090758[/C][C]-0.6971[/C][C]0.244232[/C][/ROW]
[ROW][C]6[/C][C]0.083959[/C][C]0.6449[/C][C]0.260745[/C][/ROW]
[ROW][C]7[/C][C]-0.106185[/C][C]-0.8156[/C][C]0.208999[/C][/ROW]
[ROW][C]8[/C][C]0.055871[/C][C]0.4292[/C][C]0.334688[/C][/ROW]
[ROW][C]9[/C][C]0.111015[/C][C]0.8527[/C][C]0.198632[/C][/ROW]
[ROW][C]10[/C][C]-0.064932[/C][C]-0.4987[/C][C]0.309905[/C][/ROW]
[ROW][C]11[/C][C]-0.023199[/C][C]-0.1782[/C][C]0.429589[/C][/ROW]
[ROW][C]12[/C][C]-0.018942[/C][C]-0.1455[/C][C]0.442408[/C][/ROW]
[ROW][C]13[/C][C]0.031259[/C][C]0.2401[/C][C]0.40554[/C][/ROW]
[ROW][C]14[/C][C]0.133647[/C][C]1.0266[/C][C]0.154408[/C][/ROW]
[ROW][C]15[/C][C]-0.042283[/C][C]-0.3248[/C][C]0.373247[/C][/ROW]
[ROW][C]16[/C][C]-0.166981[/C][C]-1.2826[/C][C]0.102323[/C][/ROW]
[ROW][C]17[/C][C]-0.004408[/C][C]-0.0339[/C][C]0.486553[/C][/ROW]
[ROW][C]18[/C][C]-0.03121[/C][C]-0.2397[/C][C]0.405685[/C][/ROW]
[ROW][C]19[/C][C]0.250052[/C][C]1.9207[/C][C]0.029804[/C][/ROW]
[ROW][C]20[/C][C]0.079112[/C][C]0.6077[/C][C]0.272868[/C][/ROW]
[ROW][C]21[/C][C]0.108677[/C][C]0.8348[/C][C]0.203609[/C][/ROW]
[ROW][C]22[/C][C]-0.148015[/C][C]-1.1369[/C][C]0.130083[/C][/ROW]
[ROW][C]23[/C][C]0.002912[/C][C]0.0224[/C][C]0.491116[/C][/ROW]
[ROW][C]24[/C][C]-0.050426[/C][C]-0.3873[/C][C]0.349954[/C][/ROW]
[ROW][C]25[/C][C]0.024383[/C][C]0.1873[/C][C]0.426039[/C][/ROW]
[ROW][C]26[/C][C]-0.030567[/C][C]-0.2348[/C][C]0.407592[/C][/ROW]
[ROW][C]27[/C][C]-0.02696[/C][C]-0.2071[/C][C]0.41833[/C][/ROW]
[ROW][C]28[/C][C]-0.014681[/C][C]-0.1128[/C][C]0.455299[/C][/ROW]
[ROW][C]29[/C][C]-0.072417[/C][C]-0.5562[/C][C]0.290073[/C][/ROW]
[ROW][C]30[/C][C]-0.101834[/C][C]-0.7822[/C][C]0.218612[/C][/ROW]
[ROW][C]31[/C][C]-0.058127[/C][C]-0.4465[/C][C]0.328441[/C][/ROW]
[ROW][C]32[/C][C]-0.068495[/C][C]-0.5261[/C][C]0.30039[/C][/ROW]
[ROW][C]33[/C][C]0.117885[/C][C]0.9055[/C][C]0.184444[/C][/ROW]
[ROW][C]34[/C][C]0.069051[/C][C]0.5304[/C][C]0.298916[/C][/ROW]
[ROW][C]35[/C][C]-0.022311[/C][C]-0.1714[/C][C]0.432257[/C][/ROW]
[ROW][C]36[/C][C]-0.012223[/C][C]-0.0939[/C][C]0.46276[/C][/ROW]
[ROW][C]37[/C][C]-0.019763[/C][C]-0.1518[/C][C]0.43993[/C][/ROW]
[ROW][C]38[/C][C]-0.044915[/C][C]-0.345[/C][C]0.365662[/C][/ROW]
[ROW][C]39[/C][C]-0.045699[/C][C]-0.351[/C][C]0.363412[/C][/ROW]
[ROW][C]40[/C][C]-0.020529[/C][C]-0.1577[/C][C]0.437622[/C][/ROW]
[ROW][C]41[/C][C]-0.056148[/C][C]-0.4313[/C][C]0.333917[/C][/ROW]
[ROW][C]42[/C][C]0.084111[/C][C]0.6461[/C][C]0.260369[/C][/ROW]
[ROW][C]43[/C][C]-0.014813[/C][C]-0.1138[/C][C]0.4549[/C][/ROW]
[ROW][C]44[/C][C]-0.053225[/C][C]-0.4088[/C][C]0.342074[/C][/ROW]
[ROW][C]45[/C][C]0.042934[/C][C]0.3298[/C][C]0.371365[/C][/ROW]
[ROW][C]46[/C][C]-0.045563[/C][C]-0.35[/C][C]0.363802[/C][/ROW]
[ROW][C]47[/C][C]-0.045593[/C][C]-0.3502[/C][C]0.363716[/C][/ROW]
[ROW][C]48[/C][C]0.013443[/C][C]0.1033[/C][C]0.459054[/C][/ROW]
[/TABLE]
Source: https://freestatistics.org/blog/index.php?pk=283041&T=1

Globally Unique Identifier (entire table): ba.freestatistics.org/blog/index.php?pk=283041&T=1

As an alternative you can also use a QR Code:  

The GUIDs for individual cells are displayed in the table below:

Autocorrelation Function
Time lag kACF(k)T-STATP-value
10.0578880.44460.329101
20.0420040.32260.374054
3-0.118829-0.91270.182547
4-0.183321-1.40810.082172
5-0.090758-0.69710.244232
60.0839590.64490.260745
7-0.106185-0.81560.208999
80.0558710.42920.334688
90.1110150.85270.198632
10-0.064932-0.49870.309905
11-0.023199-0.17820.429589
12-0.018942-0.14550.442408
130.0312590.24010.40554
140.1336471.02660.154408
15-0.042283-0.32480.373247
16-0.166981-1.28260.102323
17-0.004408-0.03390.486553
18-0.03121-0.23970.405685
190.2500521.92070.029804
200.0791120.60770.272868
210.1086770.83480.203609
22-0.148015-1.13690.130083
230.0029120.02240.491116
24-0.050426-0.38730.349954
250.0243830.18730.426039
26-0.030567-0.23480.407592
27-0.02696-0.20710.41833
28-0.014681-0.11280.455299
29-0.072417-0.55620.290073
30-0.101834-0.78220.218612
31-0.058127-0.44650.328441
32-0.068495-0.52610.30039
330.1178850.90550.184444
340.0690510.53040.298916
35-0.022311-0.17140.432257
36-0.012223-0.09390.46276
37-0.019763-0.15180.43993
38-0.044915-0.3450.365662
39-0.045699-0.3510.363412
40-0.020529-0.15770.437622
41-0.056148-0.43130.333917
420.0841110.64610.260369
43-0.014813-0.11380.4549
44-0.053225-0.40880.342074
450.0429340.32980.371365
46-0.045563-0.350.363802
47-0.045593-0.35020.363716
480.0134430.10330.459054


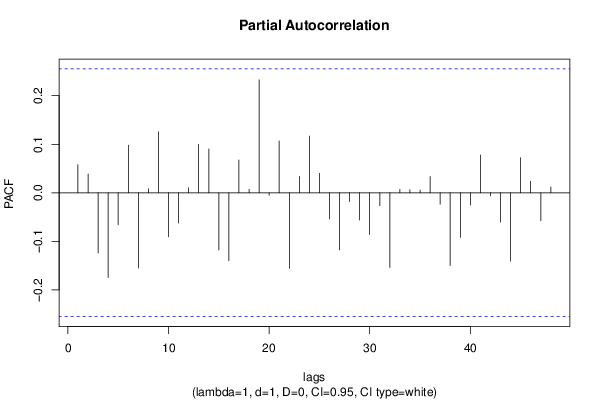
Partial Autocorrelation Function
Time lag kPACF(k)T-STATP-value
10.0578880.44460.329101
20.0387830.29790.383413
3-0.124012-0.95260.17235
4-0.174393-1.33950.092767
5-0.065684-0.50450.307884
60.0981750.75410.226896
7-0.155041-1.19090.119232
80.0084310.06480.474291
90.1254980.9640.169499
10-0.090732-0.69690.244293
11-0.062411-0.47940.316719
120.0105030.08070.467987
130.0997910.76650.223214
140.0901780.69270.245618
15-0.117964-0.90610.184285
16-0.139879-1.07440.143502
170.0677060.52010.302485
180.0071750.05510.478118
190.2326681.78720.039524
20-0.005169-0.03970.484231
210.1068010.82040.207657
22-0.155856-1.19720.118018
230.0337570.25930.398156
240.1167470.89670.186749
250.0399860.30710.379908
26-0.053716-0.41260.340698
27-0.117529-0.90280.185164
28-0.018099-0.1390.444954
29-0.056195-0.43160.333787
30-0.085895-0.65980.255984
31-0.026704-0.20510.419094
32-0.153656-1.18030.121317
330.0071390.05480.478227
340.0064290.04940.480389
350.0055060.04230.483203
360.0336430.25840.398492
37-0.023353-0.17940.429128
38-0.149782-1.15050.12729
39-0.091882-0.70580.241557
40-0.025196-0.19350.423603
410.0776670.59660.276538
42-0.006007-0.04610.481676
43-0.060514-0.46480.321888
44-0.140848-1.08190.141855
450.0723490.55570.290251
460.0238740.18340.427565
47-0.057748-0.44360.329486
480.011950.09180.463588

\begin{tabular}{lllllllll}
\hline
Partial Autocorrelation Function \tabularnewline
Time lag k & PACF(k) & T-STAT & P-value \tabularnewline
1 & 0.057888 & 0.4446 & 0.329101 \tabularnewline
2 & 0.038783 & 0.2979 & 0.383413 \tabularnewline
3 & -0.124012 & -0.9526 & 0.17235 \tabularnewline
4 & -0.174393 & -1.3395 & 0.092767 \tabularnewline
5 & -0.065684 & -0.5045 & 0.307884 \tabularnewline
6 & 0.098175 & 0.7541 & 0.226896 \tabularnewline
7 & -0.155041 & -1.1909 & 0.119232 \tabularnewline
8 & 0.008431 & 0.0648 & 0.474291 \tabularnewline
9 & 0.125498 & 0.964 & 0.169499 \tabularnewline
10 & -0.090732 & -0.6969 & 0.244293 \tabularnewline
11 & -0.062411 & -0.4794 & 0.316719 \tabularnewline
12 & 0.010503 & 0.0807 & 0.467987 \tabularnewline
13 & 0.099791 & 0.7665 & 0.223214 \tabularnewline
14 & 0.090178 & 0.6927 & 0.245618 \tabularnewline
15 & -0.117964 & -0.9061 & 0.184285 \tabularnewline
16 & -0.139879 & -1.0744 & 0.143502 \tabularnewline
17 & 0.067706 & 0.5201 & 0.302485 \tabularnewline
18 & 0.007175 & 0.0551 & 0.478118 \tabularnewline
19 & 0.232668 & 1.7872 & 0.039524 \tabularnewline
20 & -0.005169 & -0.0397 & 0.484231 \tabularnewline
21 & 0.106801 & 0.8204 & 0.207657 \tabularnewline
22 & -0.155856 & -1.1972 & 0.118018 \tabularnewline
23 & 0.033757 & 0.2593 & 0.398156 \tabularnewline
24 & 0.116747 & 0.8967 & 0.186749 \tabularnewline
25 & 0.039986 & 0.3071 & 0.379908 \tabularnewline
26 & -0.053716 & -0.4126 & 0.340698 \tabularnewline
27 & -0.117529 & -0.9028 & 0.185164 \tabularnewline
28 & -0.018099 & -0.139 & 0.444954 \tabularnewline
29 & -0.056195 & -0.4316 & 0.333787 \tabularnewline
30 & -0.085895 & -0.6598 & 0.255984 \tabularnewline
31 & -0.026704 & -0.2051 & 0.419094 \tabularnewline
32 & -0.153656 & -1.1803 & 0.121317 \tabularnewline
33 & 0.007139 & 0.0548 & 0.478227 \tabularnewline
34 & 0.006429 & 0.0494 & 0.480389 \tabularnewline
35 & 0.005506 & 0.0423 & 0.483203 \tabularnewline
36 & 0.033643 & 0.2584 & 0.398492 \tabularnewline
37 & -0.023353 & -0.1794 & 0.429128 \tabularnewline
38 & -0.149782 & -1.1505 & 0.12729 \tabularnewline
39 & -0.091882 & -0.7058 & 0.241557 \tabularnewline
40 & -0.025196 & -0.1935 & 0.423603 \tabularnewline
41 & 0.077667 & 0.5966 & 0.276538 \tabularnewline
42 & -0.006007 & -0.0461 & 0.481676 \tabularnewline
43 & -0.060514 & -0.4648 & 0.321888 \tabularnewline
44 & -0.140848 & -1.0819 & 0.141855 \tabularnewline
45 & 0.072349 & 0.5557 & 0.290251 \tabularnewline
46 & 0.023874 & 0.1834 & 0.427565 \tabularnewline
47 & -0.057748 & -0.4436 & 0.329486 \tabularnewline
48 & 0.01195 & 0.0918 & 0.463588 \tabularnewline
\hline
\end{tabular}
%Source: https://freestatistics.org/blog/index.php?pk=283041&T=2

[TABLE]
[ROW][C]Partial Autocorrelation Function[/C][/ROW]
[ROW][C]Time lag k[/C][C]PACF(k)[/C][C]T-STAT[/C][C]P-value[/C][/ROW]
[ROW][C]1[/C][C]0.057888[/C][C]0.4446[/C][C]0.329101[/C][/ROW]
[ROW][C]2[/C][C]0.038783[/C][C]0.2979[/C][C]0.383413[/C][/ROW]
[ROW][C]3[/C][C]-0.124012[/C][C]-0.9526[/C][C]0.17235[/C][/ROW]
[ROW][C]4[/C][C]-0.174393[/C][C]-1.3395[/C][C]0.092767[/C][/ROW]
[ROW][C]5[/C][C]-0.065684[/C][C]-0.5045[/C][C]0.307884[/C][/ROW]
[ROW][C]6[/C][C]0.098175[/C][C]0.7541[/C][C]0.226896[/C][/ROW]
[ROW][C]7[/C][C]-0.155041[/C][C]-1.1909[/C][C]0.119232[/C][/ROW]
[ROW][C]8[/C][C]0.008431[/C][C]0.0648[/C][C]0.474291[/C][/ROW]
[ROW][C]9[/C][C]0.125498[/C][C]0.964[/C][C]0.169499[/C][/ROW]
[ROW][C]10[/C][C]-0.090732[/C][C]-0.6969[/C][C]0.244293[/C][/ROW]
[ROW][C]11[/C][C]-0.062411[/C][C]-0.4794[/C][C]0.316719[/C][/ROW]
[ROW][C]12[/C][C]0.010503[/C][C]0.0807[/C][C]0.467987[/C][/ROW]
[ROW][C]13[/C][C]0.099791[/C][C]0.7665[/C][C]0.223214[/C][/ROW]
[ROW][C]14[/C][C]0.090178[/C][C]0.6927[/C][C]0.245618[/C][/ROW]
[ROW][C]15[/C][C]-0.117964[/C][C]-0.9061[/C][C]0.184285[/C][/ROW]
[ROW][C]16[/C][C]-0.139879[/C][C]-1.0744[/C][C]0.143502[/C][/ROW]
[ROW][C]17[/C][C]0.067706[/C][C]0.5201[/C][C]0.302485[/C][/ROW]
[ROW][C]18[/C][C]0.007175[/C][C]0.0551[/C][C]0.478118[/C][/ROW]
[ROW][C]19[/C][C]0.232668[/C][C]1.7872[/C][C]0.039524[/C][/ROW]
[ROW][C]20[/C][C]-0.005169[/C][C]-0.0397[/C][C]0.484231[/C][/ROW]
[ROW][C]21[/C][C]0.106801[/C][C]0.8204[/C][C]0.207657[/C][/ROW]
[ROW][C]22[/C][C]-0.155856[/C][C]-1.1972[/C][C]0.118018[/C][/ROW]
[ROW][C]23[/C][C]0.033757[/C][C]0.2593[/C][C]0.398156[/C][/ROW]
[ROW][C]24[/C][C]0.116747[/C][C]0.8967[/C][C]0.186749[/C][/ROW]
[ROW][C]25[/C][C]0.039986[/C][C]0.3071[/C][C]0.379908[/C][/ROW]
[ROW][C]26[/C][C]-0.053716[/C][C]-0.4126[/C][C]0.340698[/C][/ROW]
[ROW][C]27[/C][C]-0.117529[/C][C]-0.9028[/C][C]0.185164[/C][/ROW]
[ROW][C]28[/C][C]-0.018099[/C][C]-0.139[/C][C]0.444954[/C][/ROW]
[ROW][C]29[/C][C]-0.056195[/C][C]-0.4316[/C][C]0.333787[/C][/ROW]
[ROW][C]30[/C][C]-0.085895[/C][C]-0.6598[/C][C]0.255984[/C][/ROW]
[ROW][C]31[/C][C]-0.026704[/C][C]-0.2051[/C][C]0.419094[/C][/ROW]
[ROW][C]32[/C][C]-0.153656[/C][C]-1.1803[/C][C]0.121317[/C][/ROW]
[ROW][C]33[/C][C]0.007139[/C][C]0.0548[/C][C]0.478227[/C][/ROW]
[ROW][C]34[/C][C]0.006429[/C][C]0.0494[/C][C]0.480389[/C][/ROW]
[ROW][C]35[/C][C]0.005506[/C][C]0.0423[/C][C]0.483203[/C][/ROW]
[ROW][C]36[/C][C]0.033643[/C][C]0.2584[/C][C]0.398492[/C][/ROW]
[ROW][C]37[/C][C]-0.023353[/C][C]-0.1794[/C][C]0.429128[/C][/ROW]
[ROW][C]38[/C][C]-0.149782[/C][C]-1.1505[/C][C]0.12729[/C][/ROW]
[ROW][C]39[/C][C]-0.091882[/C][C]-0.7058[/C][C]0.241557[/C][/ROW]
[ROW][C]40[/C][C]-0.025196[/C][C]-0.1935[/C][C]0.423603[/C][/ROW]
[ROW][C]41[/C][C]0.077667[/C][C]0.5966[/C][C]0.276538[/C][/ROW]
[ROW][C]42[/C][C]-0.006007[/C][C]-0.0461[/C][C]0.481676[/C][/ROW]
[ROW][C]43[/C][C]-0.060514[/C][C]-0.4648[/C][C]0.321888[/C][/ROW]
[ROW][C]44[/C][C]-0.140848[/C][C]-1.0819[/C][C]0.141855[/C][/ROW]
[ROW][C]45[/C][C]0.072349[/C][C]0.5557[/C][C]0.290251[/C][/ROW]
[ROW][C]46[/C][C]0.023874[/C][C]0.1834[/C][C]0.427565[/C][/ROW]
[ROW][C]47[/C][C]-0.057748[/C][C]-0.4436[/C][C]0.329486[/C][/ROW]
[ROW][C]48[/C][C]0.01195[/C][C]0.0918[/C][C]0.463588[/C][/ROW]
[/TABLE]
Source: https://freestatistics.org/blog/index.php?pk=283041&T=2

Globally Unique Identifier (entire table): ba.freestatistics.org/blog/index.php?pk=283041&T=2

As an alternative you can also use a QR Code:  

The GUIDs for individual cells are displayed in the table below:

Partial Autocorrelation Function
Time lag kPACF(k)T-STATP-value
10.0578880.44460.329101
20.0387830.29790.383413
3-0.124012-0.95260.17235
4-0.174393-1.33950.092767
5-0.065684-0.50450.307884
60.0981750.75410.226896
7-0.155041-1.19090.119232
80.0084310.06480.474291
90.1254980.9640.169499
10-0.090732-0.69690.244293
11-0.062411-0.47940.316719
120.0105030.08070.467987
130.0997910.76650.223214
140.0901780.69270.245618
15-0.117964-0.90610.184285
16-0.139879-1.07440.143502
170.0677060.52010.302485
180.0071750.05510.478118
190.2326681.78720.039524
20-0.005169-0.03970.484231
210.1068010.82040.207657
22-0.155856-1.19720.118018
230.0337570.25930.398156
240.1167470.89670.186749
250.0399860.30710.379908
26-0.053716-0.41260.340698
27-0.117529-0.90280.185164
28-0.018099-0.1390.444954
29-0.056195-0.43160.333787
30-0.085895-0.65980.255984
31-0.026704-0.20510.419094
32-0.153656-1.18030.121317
330.0071390.05480.478227
340.0064290.04940.480389
350.0055060.04230.483203
360.0336430.25840.398492
37-0.023353-0.17940.429128
38-0.149782-1.15050.12729
39-0.091882-0.70580.241557
40-0.025196-0.19350.423603
410.0776670.59660.276538
42-0.006007-0.04610.481676
43-0.060514-0.46480.321888
44-0.140848-1.08190.141855
450.0723490.55570.290251
460.0238740.18340.427565
47-0.057748-0.44360.329486
480.011950.09180.463588


Parameters (Session):
par1 = 48 ; par2 = 1 ; par3 = 1 ; par4 = 0 ; par5 = 12 ; par6 = White Noise ; par7 = 0.95 ;
Parameters (R input):
par1 = 48 ; par2 = 1 ; par3 = 1 ; par4 = 0 ; par5 = 12 ; par6 = White Noise ; par7 = 0.95 ; par8 = ;
R code (references can be found in the software module):
if (par1 == 'Default') {
par1 = 10*log10(length(x))
} else {
par1 <- as.numeric(par1)
}
par2 <- as.numeric(par2)
par3 <- as.numeric(par3)
par4 <- as.numeric(par4)
par5 <- as.numeric(par5)
if (par6 == 'White Noise') par6 <- 'white' else par6 <- 'ma'
par7 <- as.numeric(par7)
if (par8 != '') par8 <- as.numeric(par8)
ox <- x
if (par8 == '') {
if (par2 == 0) {
x <- log(x)
} else {
x <- (x ^ par2 - 1) / par2
}
} else {
x <- log(x,base=par8)
}
if (par3 > 0) x <- diff(x,lag=1,difference=par3)
if (par4 > 0) x <- diff(x,lag=par5,difference=par4)
bitmap(file='picts.png')
op <- par(mfrow=c(2,1))
plot(ox,type='l',main='Original Time Series',xlab='time',ylab='value')
if (par8=='') {
mytitle <- paste('Working Time Series (lambda=',par2,', d=',par3,', D=',par4,')',sep='')
mysub <- paste('(lambda=',par2,', d=',par3,', D=',par4,', CI=', par7, ', CI type=',par6,')',sep='')
} else {
mytitle <- paste('Working Time Series (base=',par8,', d=',par3,', D=',par4,')',sep='')
mysub <- paste('(base=',par8,', d=',par3,', D=',par4,', CI=', par7, ', CI type=',par6,')',sep='')
}
plot(x,type='l', main=mytitle,xlab='time',ylab='value')
par(op)
dev.off()
bitmap(file='pic1.png')
racf <- acf(x, par1, main='Autocorrelation', xlab='time lag', ylab='ACF', ci.type=par6, ci=par7, sub=mysub)
dev.off()
bitmap(file='pic2.png')
rpacf <- pacf(x,par1,main='Partial Autocorrelation',xlab='lags',ylab='PACF',sub=mysub)
dev.off()
(myacf <- c(racf$acf))
(mypacf <- c(rpacf$acf))
lengthx <- length(x)
sqrtn <- sqrt(lengthx)
load(file='createtable')
a<-table.start()
a<-table.row.start(a)
a<-table.element(a,'Autocorrelation Function',4,TRUE)
a<-table.row.end(a)
a<-table.row.start(a)
a<-table.element(a,'Time lag k',header=TRUE)
a<-table.element(a,hyperlink('basics.htm','ACF(k)','click here for more information about the Autocorrelation Function'),header=TRUE)
a<-table.element(a,'T-STAT',header=TRUE)
a<-table.element(a,'P-value',header=TRUE)
a<-table.row.end(a)
for (i in 2:(par1+1)) {
a<-table.row.start(a)
a<-table.element(a,i-1,header=TRUE)
a<-table.element(a,round(myacf[i],6))
mytstat <- myacf[i]*sqrtn
a<-table.element(a,round(mytstat,4))
a<-table.element(a,round(1-pt(abs(mytstat),lengthx),6))
a<-table.row.end(a)
}
a<-table.end(a)
table.save(a,file='mytable.tab')
a<-table.start()
a<-table.row.start(a)
a<-table.element(a,'Partial Autocorrelation Function',4,TRUE)
a<-table.row.end(a)
a<-table.row.start(a)
a<-table.element(a,'Time lag k',header=TRUE)
a<-table.element(a,hyperlink('basics.htm','PACF(k)','click here for more information about the Partial Autocorrelation Function'),header=TRUE)
a<-table.element(a,'T-STAT',header=TRUE)
a<-table.element(a,'P-value',header=TRUE)
a<-table.row.end(a)
for (i in 1:par1) {
a<-table.row.start(a)
a<-table.element(a,i,header=TRUE)
a<-table.element(a,round(mypacf[i],6))
mytstat <- mypacf[i]*sqrtn
a<-table.element(a,round(mytstat,4))
a<-table.element(a,round(1-pt(abs(mytstat),lengthx),6))
a<-table.row.end(a)
}
a<-table.end(a)
table.save(a,file='mytable1.tab')