Free Statistics

of Irreproducible Research!

Author's title

Author*Unverified author*
R Software Modulerwasp_autocorrelation.wasp
Title produced by software(Partial) Autocorrelation Function
Date of computationSat, 24 Oct 2015 17:52:49 +0100
Cite this page as followsStatistical Computations at FreeStatistics.org, Office for Research Development and Education, URL https://freestatistics.org/blog/index.php?v=date/2015/Oct/24/t1445705658yox6rgxtph8e6v7.htm/, Retrieved Wed, 15 May 2024 09:11:28 +0000
Statistical Computations at FreeStatistics.org, Office for Research Development and Education, URL https://freestatistics.org/blog/index.php?pk=283051, Retrieved Wed, 15 May 2024 09:11:28 +0000
QR Codes:

Original text written by user:
IsPrivate?No (this computation is public)
User-defined keywords
Estimated Impact123
Family? (F = Feedback message, R = changed R code, M = changed R Module, P = changed Parameters, D = changed Data)
-       [(Partial) Autocorrelation Function] [autocorrelation f...] [2015-10-24 16:52:49] [31d3819645a417a2d8d176ca2e093c99] [Current]
Feedback Forum

Post a new message
Dataseries X:
790
766
1040
949
758
1023
921
775
907
835
871
836
789
811
996
778
603
990
735
800
706
766
870
647
726
784
884
696
893
674
703
799
793
799
1022
758
1021
944
915
864
1022
891
1087
822
890
1092
967
833
1104
1063
1103
1039
1185
1047
1155
878
879
1133
920
943
938
900
781
1040
792
653
866
679
799
760
699
762


Summary of computational transaction
Raw Inputview raw input (R code)
Raw Outputview raw output of R engine
Computing time2 seconds
R Server'Gertrude Mary Cox' @ cox.wessa.net

\begin{tabular}{lllllllll}
\hline
Summary of computational transaction \tabularnewline
Raw Input & view raw input (R code)  \tabularnewline
Raw Output & view raw output of R engine  \tabularnewline
Computing time & 2 seconds \tabularnewline
R Server & 'Gertrude Mary Cox' @ cox.wessa.net \tabularnewline
\hline
\end{tabular}
%Source: https://freestatistics.org/blog/index.php?pk=283051&T=0

[TABLE]
[ROW][C]Summary of computational transaction[/C][/ROW]
[ROW][C]Raw Input[/C][C]view raw input (R code) [/C][/ROW]
[ROW][C]Raw Output[/C][C]view raw output of R engine [/C][/ROW]
[ROW][C]Computing time[/C][C]2 seconds[/C][/ROW]
[ROW][C]R Server[/C][C]'Gertrude Mary Cox' @ cox.wessa.net[/C][/ROW]
[/TABLE]
Source: https://freestatistics.org/blog/index.php?pk=283051&T=0

Globally Unique Identifier (entire table): ba.freestatistics.org/blog/index.php?pk=283051&T=0

As an alternative you can also use a QR Code:  

The GUIDs for individual cells are displayed in the table below:

Summary of computational transaction
Raw Inputview raw input (R code)
Raw Outputview raw output of R engine
Computing time2 seconds
R Server'Gertrude Mary Cox' @ cox.wessa.net


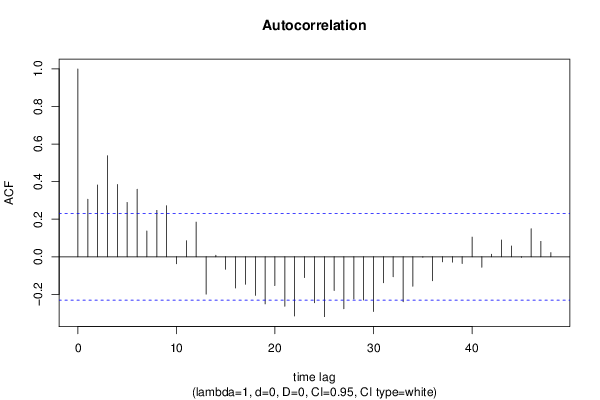
Autocorrelation Function
Time lag kACF(k)T-STATP-value
10.3064912.60070.005642
20.3825053.24570.00089
30.5375434.56121e-05
40.3843813.26160.000847
50.289432.45590.008234
60.3596233.05150.001594
70.1375981.16760.123419
80.2471642.09730.019742
90.2718522.30670.011975
10-0.036918-0.31330.377496
110.0857520.72760.234601
120.1845321.56580.06089
13-0.198928-1.6880.047873
140.0082860.07030.47207
15-0.066515-0.56440.287119
16-0.166324-1.41130.08123
17-0.146175-1.24030.109439
18-0.205525-1.74390.042719
19-0.25082-2.12830.018369
20-0.15352-1.30270.098421
21-0.263119-2.23260.014342
22-0.315538-2.67740.004591
23-0.110937-0.94130.17484
24-0.245311-2.08150.020471
25-0.318866-2.70570.004252
26-0.179316-1.52150.066251
27-0.27664-2.34740.01083
28-0.225079-1.90990.030068
29-0.229881-1.95060.027498
30-0.291341-2.47210.007898
31-0.138804-1.17780.12138
32-0.10656-0.90420.184455
33-0.2392-2.02970.023043
34-0.157404-1.33560.092941
35-0.003006-0.02550.48986
36-0.127716-1.08370.141055
37-0.027085-0.22980.40944
38-0.028761-0.2440.403944
39-0.036367-0.30860.379263
400.1045460.88710.18899
41-0.055787-0.47340.318692
420.0131270.11140.455811
430.0895280.75970.224966
440.0572130.48550.31441
45-0.003351-0.02840.488696
460.1488421.2630.105339
470.0819080.6950.244642
480.0220150.18680.426171

\begin{tabular}{lllllllll}
\hline
Autocorrelation Function \tabularnewline
Time lag k & ACF(k) & T-STAT & P-value \tabularnewline
1 & 0.306491 & 2.6007 & 0.005642 \tabularnewline
2 & 0.382505 & 3.2457 & 0.00089 \tabularnewline
3 & 0.537543 & 4.5612 & 1e-05 \tabularnewline
4 & 0.384381 & 3.2616 & 0.000847 \tabularnewline
5 & 0.28943 & 2.4559 & 0.008234 \tabularnewline
6 & 0.359623 & 3.0515 & 0.001594 \tabularnewline
7 & 0.137598 & 1.1676 & 0.123419 \tabularnewline
8 & 0.247164 & 2.0973 & 0.019742 \tabularnewline
9 & 0.271852 & 2.3067 & 0.011975 \tabularnewline
10 & -0.036918 & -0.3133 & 0.377496 \tabularnewline
11 & 0.085752 & 0.7276 & 0.234601 \tabularnewline
12 & 0.184532 & 1.5658 & 0.06089 \tabularnewline
13 & -0.198928 & -1.688 & 0.047873 \tabularnewline
14 & 0.008286 & 0.0703 & 0.47207 \tabularnewline
15 & -0.066515 & -0.5644 & 0.287119 \tabularnewline
16 & -0.166324 & -1.4113 & 0.08123 \tabularnewline
17 & -0.146175 & -1.2403 & 0.109439 \tabularnewline
18 & -0.205525 & -1.7439 & 0.042719 \tabularnewline
19 & -0.25082 & -2.1283 & 0.018369 \tabularnewline
20 & -0.15352 & -1.3027 & 0.098421 \tabularnewline
21 & -0.263119 & -2.2326 & 0.014342 \tabularnewline
22 & -0.315538 & -2.6774 & 0.004591 \tabularnewline
23 & -0.110937 & -0.9413 & 0.17484 \tabularnewline
24 & -0.245311 & -2.0815 & 0.020471 \tabularnewline
25 & -0.318866 & -2.7057 & 0.004252 \tabularnewline
26 & -0.179316 & -1.5215 & 0.066251 \tabularnewline
27 & -0.27664 & -2.3474 & 0.01083 \tabularnewline
28 & -0.225079 & -1.9099 & 0.030068 \tabularnewline
29 & -0.229881 & -1.9506 & 0.027498 \tabularnewline
30 & -0.291341 & -2.4721 & 0.007898 \tabularnewline
31 & -0.138804 & -1.1778 & 0.12138 \tabularnewline
32 & -0.10656 & -0.9042 & 0.184455 \tabularnewline
33 & -0.2392 & -2.0297 & 0.023043 \tabularnewline
34 & -0.157404 & -1.3356 & 0.092941 \tabularnewline
35 & -0.003006 & -0.0255 & 0.48986 \tabularnewline
36 & -0.127716 & -1.0837 & 0.141055 \tabularnewline
37 & -0.027085 & -0.2298 & 0.40944 \tabularnewline
38 & -0.028761 & -0.244 & 0.403944 \tabularnewline
39 & -0.036367 & -0.3086 & 0.379263 \tabularnewline
40 & 0.104546 & 0.8871 & 0.18899 \tabularnewline
41 & -0.055787 & -0.4734 & 0.318692 \tabularnewline
42 & 0.013127 & 0.1114 & 0.455811 \tabularnewline
43 & 0.089528 & 0.7597 & 0.224966 \tabularnewline
44 & 0.057213 & 0.4855 & 0.31441 \tabularnewline
45 & -0.003351 & -0.0284 & 0.488696 \tabularnewline
46 & 0.148842 & 1.263 & 0.105339 \tabularnewline
47 & 0.081908 & 0.695 & 0.244642 \tabularnewline
48 & 0.022015 & 0.1868 & 0.426171 \tabularnewline
\hline
\end{tabular}
%Source: https://freestatistics.org/blog/index.php?pk=283051&T=1

[TABLE]
[ROW][C]Autocorrelation Function[/C][/ROW]
[ROW][C]Time lag k[/C][C]ACF(k)[/C][C]T-STAT[/C][C]P-value[/C][/ROW]
[ROW][C]1[/C][C]0.306491[/C][C]2.6007[/C][C]0.005642[/C][/ROW]
[ROW][C]2[/C][C]0.382505[/C][C]3.2457[/C][C]0.00089[/C][/ROW]
[ROW][C]3[/C][C]0.537543[/C][C]4.5612[/C][C]1e-05[/C][/ROW]
[ROW][C]4[/C][C]0.384381[/C][C]3.2616[/C][C]0.000847[/C][/ROW]
[ROW][C]5[/C][C]0.28943[/C][C]2.4559[/C][C]0.008234[/C][/ROW]
[ROW][C]6[/C][C]0.359623[/C][C]3.0515[/C][C]0.001594[/C][/ROW]
[ROW][C]7[/C][C]0.137598[/C][C]1.1676[/C][C]0.123419[/C][/ROW]
[ROW][C]8[/C][C]0.247164[/C][C]2.0973[/C][C]0.019742[/C][/ROW]
[ROW][C]9[/C][C]0.271852[/C][C]2.3067[/C][C]0.011975[/C][/ROW]
[ROW][C]10[/C][C]-0.036918[/C][C]-0.3133[/C][C]0.377496[/C][/ROW]
[ROW][C]11[/C][C]0.085752[/C][C]0.7276[/C][C]0.234601[/C][/ROW]
[ROW][C]12[/C][C]0.184532[/C][C]1.5658[/C][C]0.06089[/C][/ROW]
[ROW][C]13[/C][C]-0.198928[/C][C]-1.688[/C][C]0.047873[/C][/ROW]
[ROW][C]14[/C][C]0.008286[/C][C]0.0703[/C][C]0.47207[/C][/ROW]
[ROW][C]15[/C][C]-0.066515[/C][C]-0.5644[/C][C]0.287119[/C][/ROW]
[ROW][C]16[/C][C]-0.166324[/C][C]-1.4113[/C][C]0.08123[/C][/ROW]
[ROW][C]17[/C][C]-0.146175[/C][C]-1.2403[/C][C]0.109439[/C][/ROW]
[ROW][C]18[/C][C]-0.205525[/C][C]-1.7439[/C][C]0.042719[/C][/ROW]
[ROW][C]19[/C][C]-0.25082[/C][C]-2.1283[/C][C]0.018369[/C][/ROW]
[ROW][C]20[/C][C]-0.15352[/C][C]-1.3027[/C][C]0.098421[/C][/ROW]
[ROW][C]21[/C][C]-0.263119[/C][C]-2.2326[/C][C]0.014342[/C][/ROW]
[ROW][C]22[/C][C]-0.315538[/C][C]-2.6774[/C][C]0.004591[/C][/ROW]
[ROW][C]23[/C][C]-0.110937[/C][C]-0.9413[/C][C]0.17484[/C][/ROW]
[ROW][C]24[/C][C]-0.245311[/C][C]-2.0815[/C][C]0.020471[/C][/ROW]
[ROW][C]25[/C][C]-0.318866[/C][C]-2.7057[/C][C]0.004252[/C][/ROW]
[ROW][C]26[/C][C]-0.179316[/C][C]-1.5215[/C][C]0.066251[/C][/ROW]
[ROW][C]27[/C][C]-0.27664[/C][C]-2.3474[/C][C]0.01083[/C][/ROW]
[ROW][C]28[/C][C]-0.225079[/C][C]-1.9099[/C][C]0.030068[/C][/ROW]
[ROW][C]29[/C][C]-0.229881[/C][C]-1.9506[/C][C]0.027498[/C][/ROW]
[ROW][C]30[/C][C]-0.291341[/C][C]-2.4721[/C][C]0.007898[/C][/ROW]
[ROW][C]31[/C][C]-0.138804[/C][C]-1.1778[/C][C]0.12138[/C][/ROW]
[ROW][C]32[/C][C]-0.10656[/C][C]-0.9042[/C][C]0.184455[/C][/ROW]
[ROW][C]33[/C][C]-0.2392[/C][C]-2.0297[/C][C]0.023043[/C][/ROW]
[ROW][C]34[/C][C]-0.157404[/C][C]-1.3356[/C][C]0.092941[/C][/ROW]
[ROW][C]35[/C][C]-0.003006[/C][C]-0.0255[/C][C]0.48986[/C][/ROW]
[ROW][C]36[/C][C]-0.127716[/C][C]-1.0837[/C][C]0.141055[/C][/ROW]
[ROW][C]37[/C][C]-0.027085[/C][C]-0.2298[/C][C]0.40944[/C][/ROW]
[ROW][C]38[/C][C]-0.028761[/C][C]-0.244[/C][C]0.403944[/C][/ROW]
[ROW][C]39[/C][C]-0.036367[/C][C]-0.3086[/C][C]0.379263[/C][/ROW]
[ROW][C]40[/C][C]0.104546[/C][C]0.8871[/C][C]0.18899[/C][/ROW]
[ROW][C]41[/C][C]-0.055787[/C][C]-0.4734[/C][C]0.318692[/C][/ROW]
[ROW][C]42[/C][C]0.013127[/C][C]0.1114[/C][C]0.455811[/C][/ROW]
[ROW][C]43[/C][C]0.089528[/C][C]0.7597[/C][C]0.224966[/C][/ROW]
[ROW][C]44[/C][C]0.057213[/C][C]0.4855[/C][C]0.31441[/C][/ROW]
[ROW][C]45[/C][C]-0.003351[/C][C]-0.0284[/C][C]0.488696[/C][/ROW]
[ROW][C]46[/C][C]0.148842[/C][C]1.263[/C][C]0.105339[/C][/ROW]
[ROW][C]47[/C][C]0.081908[/C][C]0.695[/C][C]0.244642[/C][/ROW]
[ROW][C]48[/C][C]0.022015[/C][C]0.1868[/C][C]0.426171[/C][/ROW]
[/TABLE]
Source: https://freestatistics.org/blog/index.php?pk=283051&T=1

Globally Unique Identifier (entire table): ba.freestatistics.org/blog/index.php?pk=283051&T=1

As an alternative you can also use a QR Code:  

The GUIDs for individual cells are displayed in the table below:

Autocorrelation Function
Time lag kACF(k)T-STATP-value
10.3064912.60070.005642
20.3825053.24570.00089
30.5375434.56121e-05
40.3843813.26160.000847
50.289432.45590.008234
60.3596233.05150.001594
70.1375981.16760.123419
80.2471642.09730.019742
90.2718522.30670.011975
10-0.036918-0.31330.377496
110.0857520.72760.234601
120.1845321.56580.06089
13-0.198928-1.6880.047873
140.0082860.07030.47207
15-0.066515-0.56440.287119
16-0.166324-1.41130.08123
17-0.146175-1.24030.109439
18-0.205525-1.74390.042719
19-0.25082-2.12830.018369
20-0.15352-1.30270.098421
21-0.263119-2.23260.014342
22-0.315538-2.67740.004591
23-0.110937-0.94130.17484
24-0.245311-2.08150.020471
25-0.318866-2.70570.004252
26-0.179316-1.52150.066251
27-0.27664-2.34740.01083
28-0.225079-1.90990.030068
29-0.229881-1.95060.027498
30-0.291341-2.47210.007898
31-0.138804-1.17780.12138
32-0.10656-0.90420.184455
33-0.2392-2.02970.023043
34-0.157404-1.33560.092941
35-0.003006-0.02550.48986
36-0.127716-1.08370.141055
37-0.027085-0.22980.40944
38-0.028761-0.2440.403944
39-0.036367-0.30860.379263
400.1045460.88710.18899
41-0.055787-0.47340.318692
420.0131270.11140.455811
430.0895280.75970.224966
440.0572130.48550.31441
45-0.003351-0.02840.488696
460.1488421.2630.105339
470.0819080.6950.244642
480.0220150.18680.426171


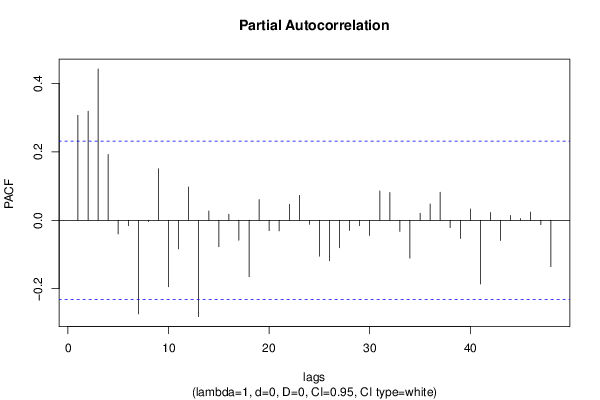
Partial Autocorrelation Function
Time lag kPACF(k)T-STATP-value
10.3064912.60070.005642
20.3184862.70240.00429
30.4422153.75230.000176
40.1920491.62960.053778
5-0.040103-0.34030.367318
6-0.016022-0.1360.44612
7-0.273753-2.32290.011508
8-0.003958-0.03360.486651
90.1506031.27790.102693
10-0.194541-1.65070.051574
11-0.083702-0.71020.239925
120.0970230.82330.206538
13-0.281755-2.39080.009715
140.0268690.2280.410149
15-0.077425-0.6570.256646
160.0175930.14930.440874
17-0.058668-0.49780.310067
18-0.164896-1.39920.083025
190.0603080.51170.305204
20-0.030416-0.25810.398536
21-0.031089-0.26380.396344
220.0465550.3950.346992
230.0727320.61720.26954
24-0.012179-0.10330.458988
25-0.104966-0.89070.188037
26-0.118527-1.00570.158955
27-0.08019-0.68040.249205
28-0.03002-0.25470.399828
29-0.015774-0.13390.446947
30-0.044685-0.37920.352841
310.0855140.72560.235216
320.0812160.68910.246474
33-0.032524-0.2760.391677
34-0.110679-0.93910.175399
350.0202690.1720.431964
360.047280.40120.344737
370.0816660.6930.245283
38-0.021486-0.18230.427923
39-0.053614-0.45490.325263
400.0327050.27750.391091
41-0.186561-1.5830.0589
420.0227890.19340.423605
43-0.059109-0.50160.308755
440.0140690.11940.452654
450.0050740.04310.482889
460.0238720.20260.420026
47-0.012919-0.10960.456507
48-0.135574-1.15040.126896

\begin{tabular}{lllllllll}
\hline
Partial Autocorrelation Function \tabularnewline
Time lag k & PACF(k) & T-STAT & P-value \tabularnewline
1 & 0.306491 & 2.6007 & 0.005642 \tabularnewline
2 & 0.318486 & 2.7024 & 0.00429 \tabularnewline
3 & 0.442215 & 3.7523 & 0.000176 \tabularnewline
4 & 0.192049 & 1.6296 & 0.053778 \tabularnewline
5 & -0.040103 & -0.3403 & 0.367318 \tabularnewline
6 & -0.016022 & -0.136 & 0.44612 \tabularnewline
7 & -0.273753 & -2.3229 & 0.011508 \tabularnewline
8 & -0.003958 & -0.0336 & 0.486651 \tabularnewline
9 & 0.150603 & 1.2779 & 0.102693 \tabularnewline
10 & -0.194541 & -1.6507 & 0.051574 \tabularnewline
11 & -0.083702 & -0.7102 & 0.239925 \tabularnewline
12 & 0.097023 & 0.8233 & 0.206538 \tabularnewline
13 & -0.281755 & -2.3908 & 0.009715 \tabularnewline
14 & 0.026869 & 0.228 & 0.410149 \tabularnewline
15 & -0.077425 & -0.657 & 0.256646 \tabularnewline
16 & 0.017593 & 0.1493 & 0.440874 \tabularnewline
17 & -0.058668 & -0.4978 & 0.310067 \tabularnewline
18 & -0.164896 & -1.3992 & 0.083025 \tabularnewline
19 & 0.060308 & 0.5117 & 0.305204 \tabularnewline
20 & -0.030416 & -0.2581 & 0.398536 \tabularnewline
21 & -0.031089 & -0.2638 & 0.396344 \tabularnewline
22 & 0.046555 & 0.395 & 0.346992 \tabularnewline
23 & 0.072732 & 0.6172 & 0.26954 \tabularnewline
24 & -0.012179 & -0.1033 & 0.458988 \tabularnewline
25 & -0.104966 & -0.8907 & 0.188037 \tabularnewline
26 & -0.118527 & -1.0057 & 0.158955 \tabularnewline
27 & -0.08019 & -0.6804 & 0.249205 \tabularnewline
28 & -0.03002 & -0.2547 & 0.399828 \tabularnewline
29 & -0.015774 & -0.1339 & 0.446947 \tabularnewline
30 & -0.044685 & -0.3792 & 0.352841 \tabularnewline
31 & 0.085514 & 0.7256 & 0.235216 \tabularnewline
32 & 0.081216 & 0.6891 & 0.246474 \tabularnewline
33 & -0.032524 & -0.276 & 0.391677 \tabularnewline
34 & -0.110679 & -0.9391 & 0.175399 \tabularnewline
35 & 0.020269 & 0.172 & 0.431964 \tabularnewline
36 & 0.04728 & 0.4012 & 0.344737 \tabularnewline
37 & 0.081666 & 0.693 & 0.245283 \tabularnewline
38 & -0.021486 & -0.1823 & 0.427923 \tabularnewline
39 & -0.053614 & -0.4549 & 0.325263 \tabularnewline
40 & 0.032705 & 0.2775 & 0.391091 \tabularnewline
41 & -0.186561 & -1.583 & 0.0589 \tabularnewline
42 & 0.022789 & 0.1934 & 0.423605 \tabularnewline
43 & -0.059109 & -0.5016 & 0.308755 \tabularnewline
44 & 0.014069 & 0.1194 & 0.452654 \tabularnewline
45 & 0.005074 & 0.0431 & 0.482889 \tabularnewline
46 & 0.023872 & 0.2026 & 0.420026 \tabularnewline
47 & -0.012919 & -0.1096 & 0.456507 \tabularnewline
48 & -0.135574 & -1.1504 & 0.126896 \tabularnewline
\hline
\end{tabular}
%Source: https://freestatistics.org/blog/index.php?pk=283051&T=2

[TABLE]
[ROW][C]Partial Autocorrelation Function[/C][/ROW]
[ROW][C]Time lag k[/C][C]PACF(k)[/C][C]T-STAT[/C][C]P-value[/C][/ROW]
[ROW][C]1[/C][C]0.306491[/C][C]2.6007[/C][C]0.005642[/C][/ROW]
[ROW][C]2[/C][C]0.318486[/C][C]2.7024[/C][C]0.00429[/C][/ROW]
[ROW][C]3[/C][C]0.442215[/C][C]3.7523[/C][C]0.000176[/C][/ROW]
[ROW][C]4[/C][C]0.192049[/C][C]1.6296[/C][C]0.053778[/C][/ROW]
[ROW][C]5[/C][C]-0.040103[/C][C]-0.3403[/C][C]0.367318[/C][/ROW]
[ROW][C]6[/C][C]-0.016022[/C][C]-0.136[/C][C]0.44612[/C][/ROW]
[ROW][C]7[/C][C]-0.273753[/C][C]-2.3229[/C][C]0.011508[/C][/ROW]
[ROW][C]8[/C][C]-0.003958[/C][C]-0.0336[/C][C]0.486651[/C][/ROW]
[ROW][C]9[/C][C]0.150603[/C][C]1.2779[/C][C]0.102693[/C][/ROW]
[ROW][C]10[/C][C]-0.194541[/C][C]-1.6507[/C][C]0.051574[/C][/ROW]
[ROW][C]11[/C][C]-0.083702[/C][C]-0.7102[/C][C]0.239925[/C][/ROW]
[ROW][C]12[/C][C]0.097023[/C][C]0.8233[/C][C]0.206538[/C][/ROW]
[ROW][C]13[/C][C]-0.281755[/C][C]-2.3908[/C][C]0.009715[/C][/ROW]
[ROW][C]14[/C][C]0.026869[/C][C]0.228[/C][C]0.410149[/C][/ROW]
[ROW][C]15[/C][C]-0.077425[/C][C]-0.657[/C][C]0.256646[/C][/ROW]
[ROW][C]16[/C][C]0.017593[/C][C]0.1493[/C][C]0.440874[/C][/ROW]
[ROW][C]17[/C][C]-0.058668[/C][C]-0.4978[/C][C]0.310067[/C][/ROW]
[ROW][C]18[/C][C]-0.164896[/C][C]-1.3992[/C][C]0.083025[/C][/ROW]
[ROW][C]19[/C][C]0.060308[/C][C]0.5117[/C][C]0.305204[/C][/ROW]
[ROW][C]20[/C][C]-0.030416[/C][C]-0.2581[/C][C]0.398536[/C][/ROW]
[ROW][C]21[/C][C]-0.031089[/C][C]-0.2638[/C][C]0.396344[/C][/ROW]
[ROW][C]22[/C][C]0.046555[/C][C]0.395[/C][C]0.346992[/C][/ROW]
[ROW][C]23[/C][C]0.072732[/C][C]0.6172[/C][C]0.26954[/C][/ROW]
[ROW][C]24[/C][C]-0.012179[/C][C]-0.1033[/C][C]0.458988[/C][/ROW]
[ROW][C]25[/C][C]-0.104966[/C][C]-0.8907[/C][C]0.188037[/C][/ROW]
[ROW][C]26[/C][C]-0.118527[/C][C]-1.0057[/C][C]0.158955[/C][/ROW]
[ROW][C]27[/C][C]-0.08019[/C][C]-0.6804[/C][C]0.249205[/C][/ROW]
[ROW][C]28[/C][C]-0.03002[/C][C]-0.2547[/C][C]0.399828[/C][/ROW]
[ROW][C]29[/C][C]-0.015774[/C][C]-0.1339[/C][C]0.446947[/C][/ROW]
[ROW][C]30[/C][C]-0.044685[/C][C]-0.3792[/C][C]0.352841[/C][/ROW]
[ROW][C]31[/C][C]0.085514[/C][C]0.7256[/C][C]0.235216[/C][/ROW]
[ROW][C]32[/C][C]0.081216[/C][C]0.6891[/C][C]0.246474[/C][/ROW]
[ROW][C]33[/C][C]-0.032524[/C][C]-0.276[/C][C]0.391677[/C][/ROW]
[ROW][C]34[/C][C]-0.110679[/C][C]-0.9391[/C][C]0.175399[/C][/ROW]
[ROW][C]35[/C][C]0.020269[/C][C]0.172[/C][C]0.431964[/C][/ROW]
[ROW][C]36[/C][C]0.04728[/C][C]0.4012[/C][C]0.344737[/C][/ROW]
[ROW][C]37[/C][C]0.081666[/C][C]0.693[/C][C]0.245283[/C][/ROW]
[ROW][C]38[/C][C]-0.021486[/C][C]-0.1823[/C][C]0.427923[/C][/ROW]
[ROW][C]39[/C][C]-0.053614[/C][C]-0.4549[/C][C]0.325263[/C][/ROW]
[ROW][C]40[/C][C]0.032705[/C][C]0.2775[/C][C]0.391091[/C][/ROW]
[ROW][C]41[/C][C]-0.186561[/C][C]-1.583[/C][C]0.0589[/C][/ROW]
[ROW][C]42[/C][C]0.022789[/C][C]0.1934[/C][C]0.423605[/C][/ROW]
[ROW][C]43[/C][C]-0.059109[/C][C]-0.5016[/C][C]0.308755[/C][/ROW]
[ROW][C]44[/C][C]0.014069[/C][C]0.1194[/C][C]0.452654[/C][/ROW]
[ROW][C]45[/C][C]0.005074[/C][C]0.0431[/C][C]0.482889[/C][/ROW]
[ROW][C]46[/C][C]0.023872[/C][C]0.2026[/C][C]0.420026[/C][/ROW]
[ROW][C]47[/C][C]-0.012919[/C][C]-0.1096[/C][C]0.456507[/C][/ROW]
[ROW][C]48[/C][C]-0.135574[/C][C]-1.1504[/C][C]0.126896[/C][/ROW]
[/TABLE]
Source: https://freestatistics.org/blog/index.php?pk=283051&T=2

Globally Unique Identifier (entire table): ba.freestatistics.org/blog/index.php?pk=283051&T=2

As an alternative you can also use a QR Code:  

The GUIDs for individual cells are displayed in the table below:

Partial Autocorrelation Function
Time lag kPACF(k)T-STATP-value
10.3064912.60070.005642
20.3184862.70240.00429
30.4422153.75230.000176
40.1920491.62960.053778
5-0.040103-0.34030.367318
6-0.016022-0.1360.44612
7-0.273753-2.32290.011508
8-0.003958-0.03360.486651
90.1506031.27790.102693
10-0.194541-1.65070.051574
11-0.083702-0.71020.239925
120.0970230.82330.206538
13-0.281755-2.39080.009715
140.0268690.2280.410149
15-0.077425-0.6570.256646
160.0175930.14930.440874
17-0.058668-0.49780.310067
18-0.164896-1.39920.083025
190.0603080.51170.305204
20-0.030416-0.25810.398536
21-0.031089-0.26380.396344
220.0465550.3950.346992
230.0727320.61720.26954
24-0.012179-0.10330.458988
25-0.104966-0.89070.188037
26-0.118527-1.00570.158955
27-0.08019-0.68040.249205
28-0.03002-0.25470.399828
29-0.015774-0.13390.446947
30-0.044685-0.37920.352841
310.0855140.72560.235216
320.0812160.68910.246474
33-0.032524-0.2760.391677
34-0.110679-0.93910.175399
350.0202690.1720.431964
360.047280.40120.344737
370.0816660.6930.245283
38-0.021486-0.18230.427923
39-0.053614-0.45490.325263
400.0327050.27750.391091
41-0.186561-1.5830.0589
420.0227890.19340.423605
43-0.059109-0.50160.308755
440.0140690.11940.452654
450.0050740.04310.482889
460.0238720.20260.420026
47-0.012919-0.10960.456507
48-0.135574-1.15040.126896


Parameters (Session):
par1 = 48 ; par2 = 1 ; par3 = 0 ; par4 = 0 ; par5 = 12 ; par6 = White Noise ; par7 = 0.95 ;
Parameters (R input):
par1 = 48 ; par2 = 1 ; par3 = 0 ; par4 = 0 ; par5 = 12 ; par6 = White Noise ; par7 = 0.95 ; par8 = ;
R code (references can be found in the software module):
par8 <- ''
par7 <- '0.95'
par6 <- 'White Noise'
par5 <- '12'
par4 <- '0'
par3 <- '0'
par2 <- '1'
par1 <- 'Default'
if (par1 == 'Default') {
par1 = 10*log10(length(x))
} else {
par1 <- as.numeric(par1)
}
par2 <- as.numeric(par2)
par3 <- as.numeric(par3)
par4 <- as.numeric(par4)
par5 <- as.numeric(par5)
if (par6 == 'White Noise') par6 <- 'white' else par6 <- 'ma'
par7 <- as.numeric(par7)
if (par8 != '') par8 <- as.numeric(par8)
ox <- x
if (par8 == '') {
if (par2 == 0) {
x <- log(x)
} else {
x <- (x ^ par2 - 1) / par2
}
} else {
x <- log(x,base=par8)
}
if (par3 > 0) x <- diff(x,lag=1,difference=par3)
if (par4 > 0) x <- diff(x,lag=par5,difference=par4)
bitmap(file='picts.png')
op <- par(mfrow=c(2,1))
plot(ox,type='l',main='Original Time Series',xlab='time',ylab='value')
if (par8=='') {
mytitle <- paste('Working Time Series (lambda=',par2,', d=',par3,', D=',par4,')',sep='')
mysub <- paste('(lambda=',par2,', d=',par3,', D=',par4,', CI=', par7, ', CI type=',par6,')',sep='')
} else {
mytitle <- paste('Working Time Series (base=',par8,', d=',par3,', D=',par4,')',sep='')
mysub <- paste('(base=',par8,', d=',par3,', D=',par4,', CI=', par7, ', CI type=',par6,')',sep='')
}
plot(x,type='l', main=mytitle,xlab='time',ylab='value')
par(op)
dev.off()
bitmap(file='pic1.png')
racf <- acf(x, par1, main='Autocorrelation', xlab='time lag', ylab='ACF', ci.type=par6, ci=par7, sub=mysub)
dev.off()
bitmap(file='pic2.png')
rpacf <- pacf(x,par1,main='Partial Autocorrelation',xlab='lags',ylab='PACF',sub=mysub)
dev.off()
(myacf <- c(racf$acf))
(mypacf <- c(rpacf$acf))
lengthx <- length(x)
sqrtn <- sqrt(lengthx)
load(file='createtable')
a<-table.start()
a<-table.row.start(a)
a<-table.element(a,'Autocorrelation Function',4,TRUE)
a<-table.row.end(a)
a<-table.row.start(a)
a<-table.element(a,'Time lag k',header=TRUE)
a<-table.element(a,hyperlink('basics.htm','ACF(k)','click here for more information about the Autocorrelation Function'),header=TRUE)
a<-table.element(a,'T-STAT',header=TRUE)
a<-table.element(a,'P-value',header=TRUE)
a<-table.row.end(a)
for (i in 2:(par1+1)) {
a<-table.row.start(a)
a<-table.element(a,i-1,header=TRUE)
a<-table.element(a,round(myacf[i],6))
mytstat <- myacf[i]*sqrtn
a<-table.element(a,round(mytstat,4))
a<-table.element(a,round(1-pt(abs(mytstat),lengthx),6))
a<-table.row.end(a)
}
a<-table.end(a)
table.save(a,file='mytable.tab')
a<-table.start()
a<-table.row.start(a)
a<-table.element(a,'Partial Autocorrelation Function',4,TRUE)
a<-table.row.end(a)
a<-table.row.start(a)
a<-table.element(a,'Time lag k',header=TRUE)
a<-table.element(a,hyperlink('basics.htm','PACF(k)','click here for more information about the Partial Autocorrelation Function'),header=TRUE)
a<-table.element(a,'T-STAT',header=TRUE)
a<-table.element(a,'P-value',header=TRUE)
a<-table.row.end(a)
for (i in 1:par1) {
a<-table.row.start(a)
a<-table.element(a,i,header=TRUE)
a<-table.element(a,round(mypacf[i],6))
mytstat <- mypacf[i]*sqrtn
a<-table.element(a,round(mytstat,4))
a<-table.element(a,round(1-pt(abs(mytstat),lengthx),6))
a<-table.row.end(a)
}
a<-table.end(a)
table.save(a,file='mytable1.tab')