Free Statistics

of Irreproducible Research!

Author's title

Author*Unverified author*
R Software Modulerwasp_autocorrelation.wasp
Title produced by software(Partial) Autocorrelation Function
Date of computationSat, 24 Oct 2015 19:58:57 +0100
Cite this page as followsStatistical Computations at FreeStatistics.org, Office for Research Development and Education, URL https://freestatistics.org/blog/index.php?v=date/2015/Oct/24/t1445713427s47xyvo5ga60atz.htm/, Retrieved Wed, 15 May 2024 07:44:10 +0000
Statistical Computations at FreeStatistics.org, Office for Research Development and Education, URL https://freestatistics.org/blog/index.php?pk=283058, Retrieved Wed, 15 May 2024 07:44:10 +0000
QR Codes:

Original text written by user:
IsPrivate?No (this computation is public)
User-defined keywords
Estimated Impact69
Family? (F = Feedback message, R = changed R code, M = changed R Module, P = changed Parameters, D = changed Data)
-       [(Partial) Autocorrelation Function] [Autocorrelatie we...] [2015-10-24 18:58:57] [ad5e328aab07d5d247de986d4dfd18ff] [Current]
Feedback Forum

Post a new message
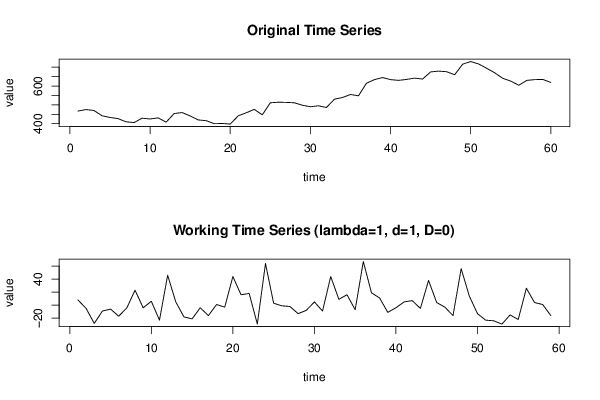
Dataseries X:
467
475
470
442
433
427
410
406
429
425
431
408
454
459
441
420
416
400
401
398
442
458
476
447
511
514
513
511
498
490
495
486
530
539
555
548
615
634
645
634
630
635
642
637
675
679
676
660
716
730
717
694
670
641
626
604
630
634
635
619


Summary of computational transaction
Raw Inputview raw input (R code)
Raw Outputview raw output of R engine
Computing time2 seconds
R Server'George Udny Yule' @ yule.wessa.net

\begin{tabular}{lllllllll}
\hline
Summary of computational transaction \tabularnewline
Raw Input & view raw input (R code)  \tabularnewline
Raw Output & view raw output of R engine  \tabularnewline
Computing time & 2 seconds \tabularnewline
R Server & 'George Udny Yule' @ yule.wessa.net \tabularnewline
\hline
\end{tabular}
%Source: https://freestatistics.org/blog/index.php?pk=283058&T=0

[TABLE]
[ROW][C]Summary of computational transaction[/C][/ROW]
[ROW][C]Raw Input[/C][C]view raw input (R code) [/C][/ROW]
[ROW][C]Raw Output[/C][C]view raw output of R engine [/C][/ROW]
[ROW][C]Computing time[/C][C]2 seconds[/C][/ROW]
[ROW][C]R Server[/C][C]'George Udny Yule' @ yule.wessa.net[/C][/ROW]
[/TABLE]
Source: https://freestatistics.org/blog/index.php?pk=283058&T=0

Globally Unique Identifier (entire table): ba.freestatistics.org/blog/index.php?pk=283058&T=0

As an alternative you can also use a QR Code:  

The GUIDs for individual cells are displayed in the table below:

Summary of computational transaction
Raw Inputview raw input (R code)
Raw Outputview raw output of R engine
Computing time2 seconds
R Server'George Udny Yule' @ yule.wessa.net


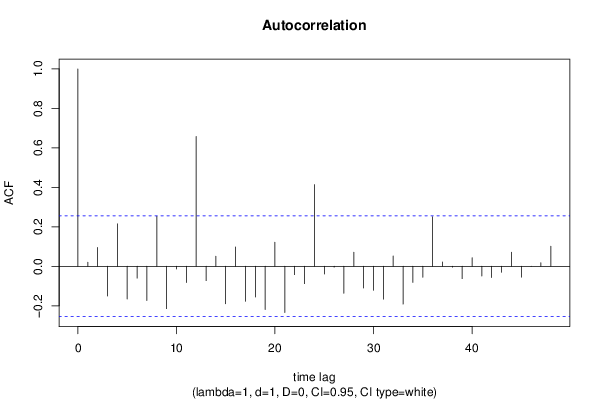
Autocorrelation Function
Time lag kACF(k)T-STATP-value
10.0205050.15750.437693
20.0954230.7330.233244
3-0.150589-1.15670.12603
40.214971.65120.052004
5-0.165525-1.27140.104285
6-0.059896-0.46010.323577
7-0.173109-1.32970.094371
80.2533231.94580.028223
9-0.214429-1.64710.052431
10-0.013406-0.1030.459168
11-0.082288-0.63210.264893
120.6579165.05362e-06
13-0.072509-0.5570.289833
140.0508380.39050.348789
15-0.189588-1.45630.075312
160.0977120.75050.227956
17-0.176981-1.35940.089594
18-0.155801-1.19670.118099
19-0.218644-1.67940.049178
200.1219630.93680.176336
21-0.234525-1.80140.038374
22-0.042193-0.32410.373507
23-0.087803-0.67440.251336
240.4138533.17890.001178
25-0.038839-0.29830.383251
26-0.004241-0.03260.487061
27-0.136794-1.05070.148832
280.0709340.54490.293954
29-0.110172-0.84620.200417
30-0.121031-0.92970.178169
31-0.16654-1.27920.102915
320.0521190.40030.345177
33-0.191547-1.47130.073262
34-0.081455-0.62570.266973
35-0.055982-0.430.33438
360.2512351.92980.029224
370.0217760.16730.433868
38-0.00417-0.0320.487279
39-0.062561-0.48050.316309
400.0433560.3330.370149
41-0.049079-0.3770.353769
42-0.056742-0.43580.332271
43-0.030615-0.23520.407451
440.0714730.5490.29254
45-0.055115-0.42330.336792
460.0001950.00150.499403
470.0176990.1360.446161
480.1016440.78070.219039

\begin{tabular}{lllllllll}
\hline
Autocorrelation Function \tabularnewline
Time lag k & ACF(k) & T-STAT & P-value \tabularnewline
1 & 0.020505 & 0.1575 & 0.437693 \tabularnewline
2 & 0.095423 & 0.733 & 0.233244 \tabularnewline
3 & -0.150589 & -1.1567 & 0.12603 \tabularnewline
4 & 0.21497 & 1.6512 & 0.052004 \tabularnewline
5 & -0.165525 & -1.2714 & 0.104285 \tabularnewline
6 & -0.059896 & -0.4601 & 0.323577 \tabularnewline
7 & -0.173109 & -1.3297 & 0.094371 \tabularnewline
8 & 0.253323 & 1.9458 & 0.028223 \tabularnewline
9 & -0.214429 & -1.6471 & 0.052431 \tabularnewline
10 & -0.013406 & -0.103 & 0.459168 \tabularnewline
11 & -0.082288 & -0.6321 & 0.264893 \tabularnewline
12 & 0.657916 & 5.0536 & 2e-06 \tabularnewline
13 & -0.072509 & -0.557 & 0.289833 \tabularnewline
14 & 0.050838 & 0.3905 & 0.348789 \tabularnewline
15 & -0.189588 & -1.4563 & 0.075312 \tabularnewline
16 & 0.097712 & 0.7505 & 0.227956 \tabularnewline
17 & -0.176981 & -1.3594 & 0.089594 \tabularnewline
18 & -0.155801 & -1.1967 & 0.118099 \tabularnewline
19 & -0.218644 & -1.6794 & 0.049178 \tabularnewline
20 & 0.121963 & 0.9368 & 0.176336 \tabularnewline
21 & -0.234525 & -1.8014 & 0.038374 \tabularnewline
22 & -0.042193 & -0.3241 & 0.373507 \tabularnewline
23 & -0.087803 & -0.6744 & 0.251336 \tabularnewline
24 & 0.413853 & 3.1789 & 0.001178 \tabularnewline
25 & -0.038839 & -0.2983 & 0.383251 \tabularnewline
26 & -0.004241 & -0.0326 & 0.487061 \tabularnewline
27 & -0.136794 & -1.0507 & 0.148832 \tabularnewline
28 & 0.070934 & 0.5449 & 0.293954 \tabularnewline
29 & -0.110172 & -0.8462 & 0.200417 \tabularnewline
30 & -0.121031 & -0.9297 & 0.178169 \tabularnewline
31 & -0.16654 & -1.2792 & 0.102915 \tabularnewline
32 & 0.052119 & 0.4003 & 0.345177 \tabularnewline
33 & -0.191547 & -1.4713 & 0.073262 \tabularnewline
34 & -0.081455 & -0.6257 & 0.266973 \tabularnewline
35 & -0.055982 & -0.43 & 0.33438 \tabularnewline
36 & 0.251235 & 1.9298 & 0.029224 \tabularnewline
37 & 0.021776 & 0.1673 & 0.433868 \tabularnewline
38 & -0.00417 & -0.032 & 0.487279 \tabularnewline
39 & -0.062561 & -0.4805 & 0.316309 \tabularnewline
40 & 0.043356 & 0.333 & 0.370149 \tabularnewline
41 & -0.049079 & -0.377 & 0.353769 \tabularnewline
42 & -0.056742 & -0.4358 & 0.332271 \tabularnewline
43 & -0.030615 & -0.2352 & 0.407451 \tabularnewline
44 & 0.071473 & 0.549 & 0.29254 \tabularnewline
45 & -0.055115 & -0.4233 & 0.336792 \tabularnewline
46 & 0.000195 & 0.0015 & 0.499403 \tabularnewline
47 & 0.017699 & 0.136 & 0.446161 \tabularnewline
48 & 0.101644 & 0.7807 & 0.219039 \tabularnewline
\hline
\end{tabular}
%Source: https://freestatistics.org/blog/index.php?pk=283058&T=1

[TABLE]
[ROW][C]Autocorrelation Function[/C][/ROW]
[ROW][C]Time lag k[/C][C]ACF(k)[/C][C]T-STAT[/C][C]P-value[/C][/ROW]
[ROW][C]1[/C][C]0.020505[/C][C]0.1575[/C][C]0.437693[/C][/ROW]
[ROW][C]2[/C][C]0.095423[/C][C]0.733[/C][C]0.233244[/C][/ROW]
[ROW][C]3[/C][C]-0.150589[/C][C]-1.1567[/C][C]0.12603[/C][/ROW]
[ROW][C]4[/C][C]0.21497[/C][C]1.6512[/C][C]0.052004[/C][/ROW]
[ROW][C]5[/C][C]-0.165525[/C][C]-1.2714[/C][C]0.104285[/C][/ROW]
[ROW][C]6[/C][C]-0.059896[/C][C]-0.4601[/C][C]0.323577[/C][/ROW]
[ROW][C]7[/C][C]-0.173109[/C][C]-1.3297[/C][C]0.094371[/C][/ROW]
[ROW][C]8[/C][C]0.253323[/C][C]1.9458[/C][C]0.028223[/C][/ROW]
[ROW][C]9[/C][C]-0.214429[/C][C]-1.6471[/C][C]0.052431[/C][/ROW]
[ROW][C]10[/C][C]-0.013406[/C][C]-0.103[/C][C]0.459168[/C][/ROW]
[ROW][C]11[/C][C]-0.082288[/C][C]-0.6321[/C][C]0.264893[/C][/ROW]
[ROW][C]12[/C][C]0.657916[/C][C]5.0536[/C][C]2e-06[/C][/ROW]
[ROW][C]13[/C][C]-0.072509[/C][C]-0.557[/C][C]0.289833[/C][/ROW]
[ROW][C]14[/C][C]0.050838[/C][C]0.3905[/C][C]0.348789[/C][/ROW]
[ROW][C]15[/C][C]-0.189588[/C][C]-1.4563[/C][C]0.075312[/C][/ROW]
[ROW][C]16[/C][C]0.097712[/C][C]0.7505[/C][C]0.227956[/C][/ROW]
[ROW][C]17[/C][C]-0.176981[/C][C]-1.3594[/C][C]0.089594[/C][/ROW]
[ROW][C]18[/C][C]-0.155801[/C][C]-1.1967[/C][C]0.118099[/C][/ROW]
[ROW][C]19[/C][C]-0.218644[/C][C]-1.6794[/C][C]0.049178[/C][/ROW]
[ROW][C]20[/C][C]0.121963[/C][C]0.9368[/C][C]0.176336[/C][/ROW]
[ROW][C]21[/C][C]-0.234525[/C][C]-1.8014[/C][C]0.038374[/C][/ROW]
[ROW][C]22[/C][C]-0.042193[/C][C]-0.3241[/C][C]0.373507[/C][/ROW]
[ROW][C]23[/C][C]-0.087803[/C][C]-0.6744[/C][C]0.251336[/C][/ROW]
[ROW][C]24[/C][C]0.413853[/C][C]3.1789[/C][C]0.001178[/C][/ROW]
[ROW][C]25[/C][C]-0.038839[/C][C]-0.2983[/C][C]0.383251[/C][/ROW]
[ROW][C]26[/C][C]-0.004241[/C][C]-0.0326[/C][C]0.487061[/C][/ROW]
[ROW][C]27[/C][C]-0.136794[/C][C]-1.0507[/C][C]0.148832[/C][/ROW]
[ROW][C]28[/C][C]0.070934[/C][C]0.5449[/C][C]0.293954[/C][/ROW]
[ROW][C]29[/C][C]-0.110172[/C][C]-0.8462[/C][C]0.200417[/C][/ROW]
[ROW][C]30[/C][C]-0.121031[/C][C]-0.9297[/C][C]0.178169[/C][/ROW]
[ROW][C]31[/C][C]-0.16654[/C][C]-1.2792[/C][C]0.102915[/C][/ROW]
[ROW][C]32[/C][C]0.052119[/C][C]0.4003[/C][C]0.345177[/C][/ROW]
[ROW][C]33[/C][C]-0.191547[/C][C]-1.4713[/C][C]0.073262[/C][/ROW]
[ROW][C]34[/C][C]-0.081455[/C][C]-0.6257[/C][C]0.266973[/C][/ROW]
[ROW][C]35[/C][C]-0.055982[/C][C]-0.43[/C][C]0.33438[/C][/ROW]
[ROW][C]36[/C][C]0.251235[/C][C]1.9298[/C][C]0.029224[/C][/ROW]
[ROW][C]37[/C][C]0.021776[/C][C]0.1673[/C][C]0.433868[/C][/ROW]
[ROW][C]38[/C][C]-0.00417[/C][C]-0.032[/C][C]0.487279[/C][/ROW]
[ROW][C]39[/C][C]-0.062561[/C][C]-0.4805[/C][C]0.316309[/C][/ROW]
[ROW][C]40[/C][C]0.043356[/C][C]0.333[/C][C]0.370149[/C][/ROW]
[ROW][C]41[/C][C]-0.049079[/C][C]-0.377[/C][C]0.353769[/C][/ROW]
[ROW][C]42[/C][C]-0.056742[/C][C]-0.4358[/C][C]0.332271[/C][/ROW]
[ROW][C]43[/C][C]-0.030615[/C][C]-0.2352[/C][C]0.407451[/C][/ROW]
[ROW][C]44[/C][C]0.071473[/C][C]0.549[/C][C]0.29254[/C][/ROW]
[ROW][C]45[/C][C]-0.055115[/C][C]-0.4233[/C][C]0.336792[/C][/ROW]
[ROW][C]46[/C][C]0.000195[/C][C]0.0015[/C][C]0.499403[/C][/ROW]
[ROW][C]47[/C][C]0.017699[/C][C]0.136[/C][C]0.446161[/C][/ROW]
[ROW][C]48[/C][C]0.101644[/C][C]0.7807[/C][C]0.219039[/C][/ROW]
[/TABLE]
Source: https://freestatistics.org/blog/index.php?pk=283058&T=1

Globally Unique Identifier (entire table): ba.freestatistics.org/blog/index.php?pk=283058&T=1

As an alternative you can also use a QR Code:  

The GUIDs for individual cells are displayed in the table below:

Autocorrelation Function
Time lag kACF(k)T-STATP-value
10.0205050.15750.437693
20.0954230.7330.233244
3-0.150589-1.15670.12603
40.214971.65120.052004
5-0.165525-1.27140.104285
6-0.059896-0.46010.323577
7-0.173109-1.32970.094371
80.2533231.94580.028223
9-0.214429-1.64710.052431
10-0.013406-0.1030.459168
11-0.082288-0.63210.264893
120.6579165.05362e-06
13-0.072509-0.5570.289833
140.0508380.39050.348789
15-0.189588-1.45630.075312
160.0977120.75050.227956
17-0.176981-1.35940.089594
18-0.155801-1.19670.118099
19-0.218644-1.67940.049178
200.1219630.93680.176336
21-0.234525-1.80140.038374
22-0.042193-0.32410.373507
23-0.087803-0.67440.251336
240.4138533.17890.001178
25-0.038839-0.29830.383251
26-0.004241-0.03260.487061
27-0.136794-1.05070.148832
280.0709340.54490.293954
29-0.110172-0.84620.200417
30-0.121031-0.92970.178169
31-0.16654-1.27920.102915
320.0521190.40030.345177
33-0.191547-1.47130.073262
34-0.081455-0.62570.266973
35-0.055982-0.430.33438
360.2512351.92980.029224
370.0217760.16730.433868
38-0.00417-0.0320.487279
39-0.062561-0.48050.316309
400.0433560.3330.370149
41-0.049079-0.3770.353769
42-0.056742-0.43580.332271
43-0.030615-0.23520.407451
440.0714730.5490.29254
45-0.055115-0.42330.336792
460.0001950.00150.499403
470.0176990.1360.446161
480.1016440.78070.219039


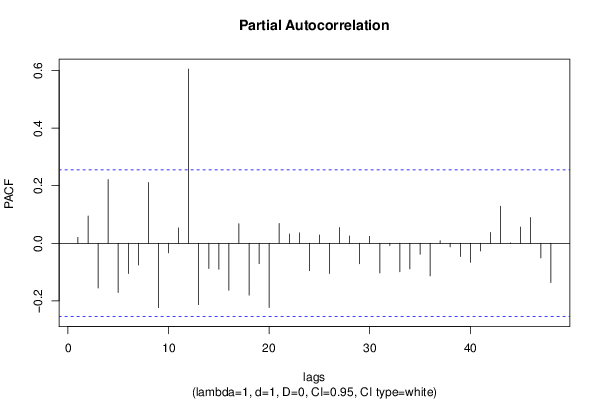
Partial Autocorrelation Function
Time lag kPACF(k)T-STATP-value
10.0205050.15750.437693
20.0950420.730.23413
3-0.15578-1.19660.11813
40.2212531.69950.047248
5-0.171441-1.31690.096488
6-0.105449-0.810.210606
7-0.075759-0.58190.281421
80.2114651.62430.054822
9-0.2241-1.72130.045214
10-0.03334-0.25610.399386
110.053380.410.341639
120.6059954.65479e-06
13-0.213492-1.63990.053177
14-0.088028-0.67620.250792
15-0.090134-0.69230.245723
16-0.163556-1.25630.10698
170.06760.51920.302767
18-0.180494-1.38640.085421
19-0.07088-0.54440.294095
20-0.223319-1.71530.045765
210.0688210.52860.299526
220.0324770.24950.401935
230.0361740.27790.391046
24-0.095083-0.73030.234034
250.028580.21950.413499
26-0.104895-0.80570.211821
270.0548490.42130.337533
280.025260.1940.423412
29-0.071555-0.54960.292327
300.0239550.1840.42732
31-0.103287-0.79340.215373
32-0.007639-0.05870.476705
33-0.099323-0.76290.224277
34-0.089139-0.68470.248111
35-0.038536-0.2960.384133
36-0.113491-0.87170.193442
370.0088740.06820.472944
38-0.012647-0.09710.46147
39-0.046373-0.35620.361482
40-0.066551-0.51120.305565
41-0.026789-0.20580.418838
420.0372440.28610.387909
430.1286860.98850.163483
445e-040.00380.498473
450.0561720.43150.333851
460.0893450.68630.247616
47-0.050807-0.39030.348877
48-0.136761-1.05050.148891

\begin{tabular}{lllllllll}
\hline
Partial Autocorrelation Function \tabularnewline
Time lag k & PACF(k) & T-STAT & P-value \tabularnewline
1 & 0.020505 & 0.1575 & 0.437693 \tabularnewline
2 & 0.095042 & 0.73 & 0.23413 \tabularnewline
3 & -0.15578 & -1.1966 & 0.11813 \tabularnewline
4 & 0.221253 & 1.6995 & 0.047248 \tabularnewline
5 & -0.171441 & -1.3169 & 0.096488 \tabularnewline
6 & -0.105449 & -0.81 & 0.210606 \tabularnewline
7 & -0.075759 & -0.5819 & 0.281421 \tabularnewline
8 & 0.211465 & 1.6243 & 0.054822 \tabularnewline
9 & -0.2241 & -1.7213 & 0.045214 \tabularnewline
10 & -0.03334 & -0.2561 & 0.399386 \tabularnewline
11 & 0.05338 & 0.41 & 0.341639 \tabularnewline
12 & 0.605995 & 4.6547 & 9e-06 \tabularnewline
13 & -0.213492 & -1.6399 & 0.053177 \tabularnewline
14 & -0.088028 & -0.6762 & 0.250792 \tabularnewline
15 & -0.090134 & -0.6923 & 0.245723 \tabularnewline
16 & -0.163556 & -1.2563 & 0.10698 \tabularnewline
17 & 0.0676 & 0.5192 & 0.302767 \tabularnewline
18 & -0.180494 & -1.3864 & 0.085421 \tabularnewline
19 & -0.07088 & -0.5444 & 0.294095 \tabularnewline
20 & -0.223319 & -1.7153 & 0.045765 \tabularnewline
21 & 0.068821 & 0.5286 & 0.299526 \tabularnewline
22 & 0.032477 & 0.2495 & 0.401935 \tabularnewline
23 & 0.036174 & 0.2779 & 0.391046 \tabularnewline
24 & -0.095083 & -0.7303 & 0.234034 \tabularnewline
25 & 0.02858 & 0.2195 & 0.413499 \tabularnewline
26 & -0.104895 & -0.8057 & 0.211821 \tabularnewline
27 & 0.054849 & 0.4213 & 0.337533 \tabularnewline
28 & 0.02526 & 0.194 & 0.423412 \tabularnewline
29 & -0.071555 & -0.5496 & 0.292327 \tabularnewline
30 & 0.023955 & 0.184 & 0.42732 \tabularnewline
31 & -0.103287 & -0.7934 & 0.215373 \tabularnewline
32 & -0.007639 & -0.0587 & 0.476705 \tabularnewline
33 & -0.099323 & -0.7629 & 0.224277 \tabularnewline
34 & -0.089139 & -0.6847 & 0.248111 \tabularnewline
35 & -0.038536 & -0.296 & 0.384133 \tabularnewline
36 & -0.113491 & -0.8717 & 0.193442 \tabularnewline
37 & 0.008874 & 0.0682 & 0.472944 \tabularnewline
38 & -0.012647 & -0.0971 & 0.46147 \tabularnewline
39 & -0.046373 & -0.3562 & 0.361482 \tabularnewline
40 & -0.066551 & -0.5112 & 0.305565 \tabularnewline
41 & -0.026789 & -0.2058 & 0.418838 \tabularnewline
42 & 0.037244 & 0.2861 & 0.387909 \tabularnewline
43 & 0.128686 & 0.9885 & 0.163483 \tabularnewline
44 & 5e-04 & 0.0038 & 0.498473 \tabularnewline
45 & 0.056172 & 0.4315 & 0.333851 \tabularnewline
46 & 0.089345 & 0.6863 & 0.247616 \tabularnewline
47 & -0.050807 & -0.3903 & 0.348877 \tabularnewline
48 & -0.136761 & -1.0505 & 0.148891 \tabularnewline
\hline
\end{tabular}
%Source: https://freestatistics.org/blog/index.php?pk=283058&T=2

[TABLE]
[ROW][C]Partial Autocorrelation Function[/C][/ROW]
[ROW][C]Time lag k[/C][C]PACF(k)[/C][C]T-STAT[/C][C]P-value[/C][/ROW]
[ROW][C]1[/C][C]0.020505[/C][C]0.1575[/C][C]0.437693[/C][/ROW]
[ROW][C]2[/C][C]0.095042[/C][C]0.73[/C][C]0.23413[/C][/ROW]
[ROW][C]3[/C][C]-0.15578[/C][C]-1.1966[/C][C]0.11813[/C][/ROW]
[ROW][C]4[/C][C]0.221253[/C][C]1.6995[/C][C]0.047248[/C][/ROW]
[ROW][C]5[/C][C]-0.171441[/C][C]-1.3169[/C][C]0.096488[/C][/ROW]
[ROW][C]6[/C][C]-0.105449[/C][C]-0.81[/C][C]0.210606[/C][/ROW]
[ROW][C]7[/C][C]-0.075759[/C][C]-0.5819[/C][C]0.281421[/C][/ROW]
[ROW][C]8[/C][C]0.211465[/C][C]1.6243[/C][C]0.054822[/C][/ROW]
[ROW][C]9[/C][C]-0.2241[/C][C]-1.7213[/C][C]0.045214[/C][/ROW]
[ROW][C]10[/C][C]-0.03334[/C][C]-0.2561[/C][C]0.399386[/C][/ROW]
[ROW][C]11[/C][C]0.05338[/C][C]0.41[/C][C]0.341639[/C][/ROW]
[ROW][C]12[/C][C]0.605995[/C][C]4.6547[/C][C]9e-06[/C][/ROW]
[ROW][C]13[/C][C]-0.213492[/C][C]-1.6399[/C][C]0.053177[/C][/ROW]
[ROW][C]14[/C][C]-0.088028[/C][C]-0.6762[/C][C]0.250792[/C][/ROW]
[ROW][C]15[/C][C]-0.090134[/C][C]-0.6923[/C][C]0.245723[/C][/ROW]
[ROW][C]16[/C][C]-0.163556[/C][C]-1.2563[/C][C]0.10698[/C][/ROW]
[ROW][C]17[/C][C]0.0676[/C][C]0.5192[/C][C]0.302767[/C][/ROW]
[ROW][C]18[/C][C]-0.180494[/C][C]-1.3864[/C][C]0.085421[/C][/ROW]
[ROW][C]19[/C][C]-0.07088[/C][C]-0.5444[/C][C]0.294095[/C][/ROW]
[ROW][C]20[/C][C]-0.223319[/C][C]-1.7153[/C][C]0.045765[/C][/ROW]
[ROW][C]21[/C][C]0.068821[/C][C]0.5286[/C][C]0.299526[/C][/ROW]
[ROW][C]22[/C][C]0.032477[/C][C]0.2495[/C][C]0.401935[/C][/ROW]
[ROW][C]23[/C][C]0.036174[/C][C]0.2779[/C][C]0.391046[/C][/ROW]
[ROW][C]24[/C][C]-0.095083[/C][C]-0.7303[/C][C]0.234034[/C][/ROW]
[ROW][C]25[/C][C]0.02858[/C][C]0.2195[/C][C]0.413499[/C][/ROW]
[ROW][C]26[/C][C]-0.104895[/C][C]-0.8057[/C][C]0.211821[/C][/ROW]
[ROW][C]27[/C][C]0.054849[/C][C]0.4213[/C][C]0.337533[/C][/ROW]
[ROW][C]28[/C][C]0.02526[/C][C]0.194[/C][C]0.423412[/C][/ROW]
[ROW][C]29[/C][C]-0.071555[/C][C]-0.5496[/C][C]0.292327[/C][/ROW]
[ROW][C]30[/C][C]0.023955[/C][C]0.184[/C][C]0.42732[/C][/ROW]
[ROW][C]31[/C][C]-0.103287[/C][C]-0.7934[/C][C]0.215373[/C][/ROW]
[ROW][C]32[/C][C]-0.007639[/C][C]-0.0587[/C][C]0.476705[/C][/ROW]
[ROW][C]33[/C][C]-0.099323[/C][C]-0.7629[/C][C]0.224277[/C][/ROW]
[ROW][C]34[/C][C]-0.089139[/C][C]-0.6847[/C][C]0.248111[/C][/ROW]
[ROW][C]35[/C][C]-0.038536[/C][C]-0.296[/C][C]0.384133[/C][/ROW]
[ROW][C]36[/C][C]-0.113491[/C][C]-0.8717[/C][C]0.193442[/C][/ROW]
[ROW][C]37[/C][C]0.008874[/C][C]0.0682[/C][C]0.472944[/C][/ROW]
[ROW][C]38[/C][C]-0.012647[/C][C]-0.0971[/C][C]0.46147[/C][/ROW]
[ROW][C]39[/C][C]-0.046373[/C][C]-0.3562[/C][C]0.361482[/C][/ROW]
[ROW][C]40[/C][C]-0.066551[/C][C]-0.5112[/C][C]0.305565[/C][/ROW]
[ROW][C]41[/C][C]-0.026789[/C][C]-0.2058[/C][C]0.418838[/C][/ROW]
[ROW][C]42[/C][C]0.037244[/C][C]0.2861[/C][C]0.387909[/C][/ROW]
[ROW][C]43[/C][C]0.128686[/C][C]0.9885[/C][C]0.163483[/C][/ROW]
[ROW][C]44[/C][C]5e-04[/C][C]0.0038[/C][C]0.498473[/C][/ROW]
[ROW][C]45[/C][C]0.056172[/C][C]0.4315[/C][C]0.333851[/C][/ROW]
[ROW][C]46[/C][C]0.089345[/C][C]0.6863[/C][C]0.247616[/C][/ROW]
[ROW][C]47[/C][C]-0.050807[/C][C]-0.3903[/C][C]0.348877[/C][/ROW]
[ROW][C]48[/C][C]-0.136761[/C][C]-1.0505[/C][C]0.148891[/C][/ROW]
[/TABLE]
Source: https://freestatistics.org/blog/index.php?pk=283058&T=2

Globally Unique Identifier (entire table): ba.freestatistics.org/blog/index.php?pk=283058&T=2

As an alternative you can also use a QR Code:  

The GUIDs for individual cells are displayed in the table below:

Partial Autocorrelation Function
Time lag kPACF(k)T-STATP-value
10.0205050.15750.437693
20.0950420.730.23413
3-0.15578-1.19660.11813
40.2212531.69950.047248
5-0.171441-1.31690.096488
6-0.105449-0.810.210606
7-0.075759-0.58190.281421
80.2114651.62430.054822
9-0.2241-1.72130.045214
10-0.03334-0.25610.399386
110.053380.410.341639
120.6059954.65479e-06
13-0.213492-1.63990.053177
14-0.088028-0.67620.250792
15-0.090134-0.69230.245723
16-0.163556-1.25630.10698
170.06760.51920.302767
18-0.180494-1.38640.085421
19-0.07088-0.54440.294095
20-0.223319-1.71530.045765
210.0688210.52860.299526
220.0324770.24950.401935
230.0361740.27790.391046
24-0.095083-0.73030.234034
250.028580.21950.413499
26-0.104895-0.80570.211821
270.0548490.42130.337533
280.025260.1940.423412
29-0.071555-0.54960.292327
300.0239550.1840.42732
31-0.103287-0.79340.215373
32-0.007639-0.05870.476705
33-0.099323-0.76290.224277
34-0.089139-0.68470.248111
35-0.038536-0.2960.384133
36-0.113491-0.87170.193442
370.0088740.06820.472944
38-0.012647-0.09710.46147
39-0.046373-0.35620.361482
40-0.066551-0.51120.305565
41-0.026789-0.20580.418838
420.0372440.28610.387909
430.1286860.98850.163483
445e-040.00380.498473
450.0561720.43150.333851
460.0893450.68630.247616
47-0.050807-0.39030.348877
48-0.136761-1.05050.148891


Parameters (Session):
par1 = 48 ; par2 = 1 ; par3 = 1 ; par4 = 0 ; par5 = 12 ; par6 = White Noise ; par7 = 0.95 ;
Parameters (R input):
par1 = 48 ; par2 = 1 ; par3 = 1 ; par4 = 0 ; par5 = 12 ; par6 = White Noise ; par7 = 0.95 ; par8 = ;
R code (references can be found in the software module):
if (par1 == 'Default') {
par1 = 10*log10(length(x))
} else {
par1 <- as.numeric(par1)
}
par2 <- as.numeric(par2)
par3 <- as.numeric(par3)
par4 <- as.numeric(par4)
par5 <- as.numeric(par5)
if (par6 == 'White Noise') par6 <- 'white' else par6 <- 'ma'
par7 <- as.numeric(par7)
if (par8 != '') par8 <- as.numeric(par8)
ox <- x
if (par8 == '') {
if (par2 == 0) {
x <- log(x)
} else {
x <- (x ^ par2 - 1) / par2
}
} else {
x <- log(x,base=par8)
}
if (par3 > 0) x <- diff(x,lag=1,difference=par3)
if (par4 > 0) x <- diff(x,lag=par5,difference=par4)
bitmap(file='picts.png')
op <- par(mfrow=c(2,1))
plot(ox,type='l',main='Original Time Series',xlab='time',ylab='value')
if (par8=='') {
mytitle <- paste('Working Time Series (lambda=',par2,', d=',par3,', D=',par4,')',sep='')
mysub <- paste('(lambda=',par2,', d=',par3,', D=',par4,', CI=', par7, ', CI type=',par6,')',sep='')
} else {
mytitle <- paste('Working Time Series (base=',par8,', d=',par3,', D=',par4,')',sep='')
mysub <- paste('(base=',par8,', d=',par3,', D=',par4,', CI=', par7, ', CI type=',par6,')',sep='')
}
plot(x,type='l', main=mytitle,xlab='time',ylab='value')
par(op)
dev.off()
bitmap(file='pic1.png')
racf <- acf(x, par1, main='Autocorrelation', xlab='time lag', ylab='ACF', ci.type=par6, ci=par7, sub=mysub)
dev.off()
bitmap(file='pic2.png')
rpacf <- pacf(x,par1,main='Partial Autocorrelation',xlab='lags',ylab='PACF',sub=mysub)
dev.off()
(myacf <- c(racf$acf))
(mypacf <- c(rpacf$acf))
lengthx <- length(x)
sqrtn <- sqrt(lengthx)
load(file='createtable')
a<-table.start()
a<-table.row.start(a)
a<-table.element(a,'Autocorrelation Function',4,TRUE)
a<-table.row.end(a)
a<-table.row.start(a)
a<-table.element(a,'Time lag k',header=TRUE)
a<-table.element(a,hyperlink('basics.htm','ACF(k)','click here for more information about the Autocorrelation Function'),header=TRUE)
a<-table.element(a,'T-STAT',header=TRUE)
a<-table.element(a,'P-value',header=TRUE)
a<-table.row.end(a)
for (i in 2:(par1+1)) {
a<-table.row.start(a)
a<-table.element(a,i-1,header=TRUE)
a<-table.element(a,round(myacf[i],6))
mytstat <- myacf[i]*sqrtn
a<-table.element(a,round(mytstat,4))
a<-table.element(a,round(1-pt(abs(mytstat),lengthx),6))
a<-table.row.end(a)
}
a<-table.end(a)
table.save(a,file='mytable.tab')
a<-table.start()
a<-table.row.start(a)
a<-table.element(a,'Partial Autocorrelation Function',4,TRUE)
a<-table.row.end(a)
a<-table.row.start(a)
a<-table.element(a,'Time lag k',header=TRUE)
a<-table.element(a,hyperlink('basics.htm','PACF(k)','click here for more information about the Partial Autocorrelation Function'),header=TRUE)
a<-table.element(a,'T-STAT',header=TRUE)
a<-table.element(a,'P-value',header=TRUE)
a<-table.row.end(a)
for (i in 1:par1) {
a<-table.row.start(a)
a<-table.element(a,i,header=TRUE)
a<-table.element(a,round(mypacf[i],6))
mytstat <- mypacf[i]*sqrtn
a<-table.element(a,round(mytstat,4))
a<-table.element(a,round(1-pt(abs(mytstat),lengthx),6))
a<-table.row.end(a)
}
a<-table.end(a)
table.save(a,file='mytable1.tab')