Free Statistics

of Irreproducible Research!

Author's title

Author*Unverified author*
R Software Modulerwasp_autocorrelation.wasp
Title produced by software(Partial) Autocorrelation Function
Date of computationSat, 24 Oct 2015 20:31:09 +0100
Cite this page as followsStatistical Computations at FreeStatistics.org, Office for Research Development and Education, URL https://freestatistics.org/blog/index.php?v=date/2015/Oct/24/t1445715222q8k5zuur8rkdx4g.htm/, Retrieved Thu, 16 May 2024 01:22:28 +0000
Statistical Computations at FreeStatistics.org, Office for Research Development and Education, URL https://freestatistics.org/blog/index.php?pk=283062, Retrieved Thu, 16 May 2024 01:22:28 +0000
QR Codes:

Original text written by user:
IsPrivate?No (this computation is public)
User-defined keywords
Estimated Impact94
Family? (F = Feedback message, R = changed R code, M = changed R Module, P = changed Parameters, D = changed Data)
-     [Mean Plot] [] [2015-10-24 19:06:33] [b0aab221b45ede45fa239f31e845a68c]
- RMPD    [(Partial) Autocorrelation Function] [] [2015-10-24 19:31:09] [9f6f73fad9c1c9780dcaf60f96d9a566] [Current]
Feedback Forum

Post a new message
Dataseries X:
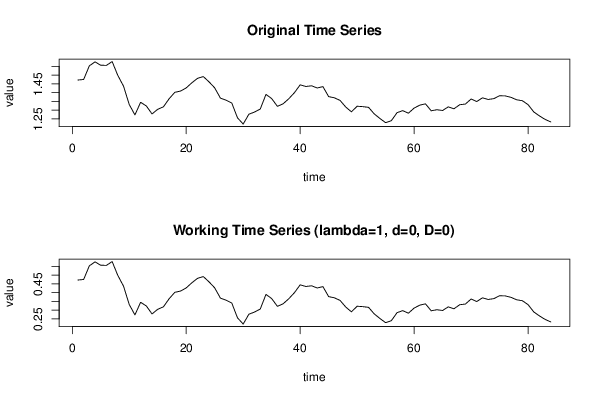
1,4718
1,4748
1,5527
1,5751
1,5557
1,5553
1,577
1,4975
1,4369
1,3322
1,2732
1,3449
1,3239
1,2785
1,305
1,319
1,365
1,4016
1,4088
1,4268
1,4562
1,4816
1,4914
1,4614
1,4272
1,3686
1,3569
1,3406
1,2565
1,2209
1,277
1,2894
1,3067
1,3898
1,3661
1,322
1,336
1,3649
1,3999
1,4442
1,4349
1,4388
1,4264
1,4343
1,377
1,3706
1,3556
1,3179
1,2905
1,3224
1,3201
1,3162
1,2789
1,2526
1,2288
1,24
1,2856
1,2974
1,2828
1,3119
1,3288
1,3359
1,2964
1,3026
1,2982
1,3189
1,308
1,331
1,3348
1,3635
1,3493
1,3704
1,361
1,3658
1,3823
1,3812
1,3732
1,3592
1,3539
1,3316
1,2901
1,2673
1,2472
1,2331


Summary of computational transaction
Raw Inputview raw input (R code)
Raw Outputview raw output of R engine
Computing time1 seconds
R Server'Gwilym Jenkins' @ jenkins.wessa.net

\begin{tabular}{lllllllll}
\hline
Summary of computational transaction \tabularnewline
Raw Input & view raw input (R code)  \tabularnewline
Raw Output & view raw output of R engine  \tabularnewline
Computing time & 1 seconds \tabularnewline
R Server & 'Gwilym Jenkins' @ jenkins.wessa.net \tabularnewline
\hline
\end{tabular}
%Source: https://freestatistics.org/blog/index.php?pk=283062&T=0

[TABLE]
[ROW][C]Summary of computational transaction[/C][/ROW]
[ROW][C]Raw Input[/C][C]view raw input (R code) [/C][/ROW]
[ROW][C]Raw Output[/C][C]view raw output of R engine [/C][/ROW]
[ROW][C]Computing time[/C][C]1 seconds[/C][/ROW]
[ROW][C]R Server[/C][C]'Gwilym Jenkins' @ jenkins.wessa.net[/C][/ROW]
[/TABLE]
Source: https://freestatistics.org/blog/index.php?pk=283062&T=0

Globally Unique Identifier (entire table): ba.freestatistics.org/blog/index.php?pk=283062&T=0

As an alternative you can also use a QR Code:  

The GUIDs for individual cells are displayed in the table below:

Summary of computational transaction
Raw Inputview raw input (R code)
Raw Outputview raw output of R engine
Computing time1 seconds
R Server'Gwilym Jenkins' @ jenkins.wessa.net


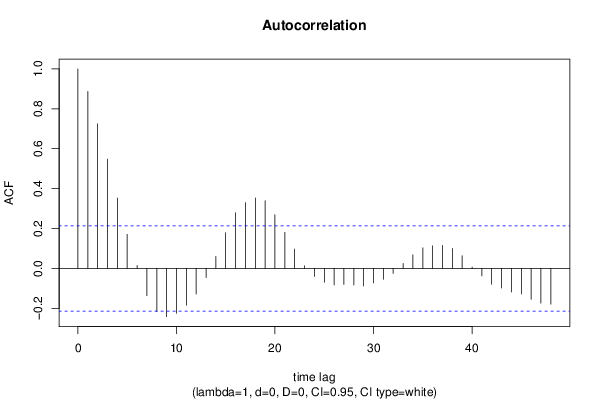
Autocorrelation Function
Time lag kACF(k)T-STATP-value
10.8869638.12920
20.724656.64150
30.5477345.02011e-06
40.352493.23060.000882
50.1707481.56490.060679
60.0149270.13680.445754
7-0.136647-1.25240.106952
8-0.216413-1.98350.025291
9-0.241932-2.21730.01465
10-0.224588-2.05840.021326
11-0.185233-1.69770.046634
12-0.128695-1.17950.120763
13-0.045456-0.41660.339011
140.0599640.54960.292032
150.1790531.64110.052263
160.2790552.55760.006168
170.3300033.02450.001652
180.3533073.23810.000862
190.3396163.11260.001267
200.2691742.4670.007828
210.1808351.65740.050587
220.0967330.88660.188921
230.0130.11910.452722
24-0.040464-0.37090.355839
25-0.069857-0.64020.261878
26-0.082729-0.75820.225219
27-0.080353-0.73640.231755
28-0.083035-0.7610.224386
29-0.087664-0.80350.211989
30-0.072653-0.66590.253657
31-0.054574-0.50020.309128
32-0.025035-0.22940.40954
330.0244310.22390.411684
340.0679650.62290.267515
350.1028810.94290.174214
360.1130411.0360.15158
370.1147121.05140.148055
380.1001770.91810.180588
390.0635930.58280.280782
400.0066030.06050.475942
41-0.037715-0.34570.365229
42-0.079395-0.72770.234421
43-0.098529-0.9030.184545
44-0.118384-1.0850.140511
45-0.127943-1.17260.122133
46-0.155046-1.4210.079506
47-0.174016-1.59490.057248
48-0.179353-1.64380.051978

\begin{tabular}{lllllllll}
\hline
Autocorrelation Function \tabularnewline
Time lag k & ACF(k) & T-STAT & P-value \tabularnewline
1 & 0.886963 & 8.1292 & 0 \tabularnewline
2 & 0.72465 & 6.6415 & 0 \tabularnewline
3 & 0.547734 & 5.0201 & 1e-06 \tabularnewline
4 & 0.35249 & 3.2306 & 0.000882 \tabularnewline
5 & 0.170748 & 1.5649 & 0.060679 \tabularnewline
6 & 0.014927 & 0.1368 & 0.445754 \tabularnewline
7 & -0.136647 & -1.2524 & 0.106952 \tabularnewline
8 & -0.216413 & -1.9835 & 0.025291 \tabularnewline
9 & -0.241932 & -2.2173 & 0.01465 \tabularnewline
10 & -0.224588 & -2.0584 & 0.021326 \tabularnewline
11 & -0.185233 & -1.6977 & 0.046634 \tabularnewline
12 & -0.128695 & -1.1795 & 0.120763 \tabularnewline
13 & -0.045456 & -0.4166 & 0.339011 \tabularnewline
14 & 0.059964 & 0.5496 & 0.292032 \tabularnewline
15 & 0.179053 & 1.6411 & 0.052263 \tabularnewline
16 & 0.279055 & 2.5576 & 0.006168 \tabularnewline
17 & 0.330003 & 3.0245 & 0.001652 \tabularnewline
18 & 0.353307 & 3.2381 & 0.000862 \tabularnewline
19 & 0.339616 & 3.1126 & 0.001267 \tabularnewline
20 & 0.269174 & 2.467 & 0.007828 \tabularnewline
21 & 0.180835 & 1.6574 & 0.050587 \tabularnewline
22 & 0.096733 & 0.8866 & 0.188921 \tabularnewline
23 & 0.013 & 0.1191 & 0.452722 \tabularnewline
24 & -0.040464 & -0.3709 & 0.355839 \tabularnewline
25 & -0.069857 & -0.6402 & 0.261878 \tabularnewline
26 & -0.082729 & -0.7582 & 0.225219 \tabularnewline
27 & -0.080353 & -0.7364 & 0.231755 \tabularnewline
28 & -0.083035 & -0.761 & 0.224386 \tabularnewline
29 & -0.087664 & -0.8035 & 0.211989 \tabularnewline
30 & -0.072653 & -0.6659 & 0.253657 \tabularnewline
31 & -0.054574 & -0.5002 & 0.309128 \tabularnewline
32 & -0.025035 & -0.2294 & 0.40954 \tabularnewline
33 & 0.024431 & 0.2239 & 0.411684 \tabularnewline
34 & 0.067965 & 0.6229 & 0.267515 \tabularnewline
35 & 0.102881 & 0.9429 & 0.174214 \tabularnewline
36 & 0.113041 & 1.036 & 0.15158 \tabularnewline
37 & 0.114712 & 1.0514 & 0.148055 \tabularnewline
38 & 0.100177 & 0.9181 & 0.180588 \tabularnewline
39 & 0.063593 & 0.5828 & 0.280782 \tabularnewline
40 & 0.006603 & 0.0605 & 0.475942 \tabularnewline
41 & -0.037715 & -0.3457 & 0.365229 \tabularnewline
42 & -0.079395 & -0.7277 & 0.234421 \tabularnewline
43 & -0.098529 & -0.903 & 0.184545 \tabularnewline
44 & -0.118384 & -1.085 & 0.140511 \tabularnewline
45 & -0.127943 & -1.1726 & 0.122133 \tabularnewline
46 & -0.155046 & -1.421 & 0.079506 \tabularnewline
47 & -0.174016 & -1.5949 & 0.057248 \tabularnewline
48 & -0.179353 & -1.6438 & 0.051978 \tabularnewline
\hline
\end{tabular}
%Source: https://freestatistics.org/blog/index.php?pk=283062&T=1

[TABLE]
[ROW][C]Autocorrelation Function[/C][/ROW]
[ROW][C]Time lag k[/C][C]ACF(k)[/C][C]T-STAT[/C][C]P-value[/C][/ROW]
[ROW][C]1[/C][C]0.886963[/C][C]8.1292[/C][C]0[/C][/ROW]
[ROW][C]2[/C][C]0.72465[/C][C]6.6415[/C][C]0[/C][/ROW]
[ROW][C]3[/C][C]0.547734[/C][C]5.0201[/C][C]1e-06[/C][/ROW]
[ROW][C]4[/C][C]0.35249[/C][C]3.2306[/C][C]0.000882[/C][/ROW]
[ROW][C]5[/C][C]0.170748[/C][C]1.5649[/C][C]0.060679[/C][/ROW]
[ROW][C]6[/C][C]0.014927[/C][C]0.1368[/C][C]0.445754[/C][/ROW]
[ROW][C]7[/C][C]-0.136647[/C][C]-1.2524[/C][C]0.106952[/C][/ROW]
[ROW][C]8[/C][C]-0.216413[/C][C]-1.9835[/C][C]0.025291[/C][/ROW]
[ROW][C]9[/C][C]-0.241932[/C][C]-2.2173[/C][C]0.01465[/C][/ROW]
[ROW][C]10[/C][C]-0.224588[/C][C]-2.0584[/C][C]0.021326[/C][/ROW]
[ROW][C]11[/C][C]-0.185233[/C][C]-1.6977[/C][C]0.046634[/C][/ROW]
[ROW][C]12[/C][C]-0.128695[/C][C]-1.1795[/C][C]0.120763[/C][/ROW]
[ROW][C]13[/C][C]-0.045456[/C][C]-0.4166[/C][C]0.339011[/C][/ROW]
[ROW][C]14[/C][C]0.059964[/C][C]0.5496[/C][C]0.292032[/C][/ROW]
[ROW][C]15[/C][C]0.179053[/C][C]1.6411[/C][C]0.052263[/C][/ROW]
[ROW][C]16[/C][C]0.279055[/C][C]2.5576[/C][C]0.006168[/C][/ROW]
[ROW][C]17[/C][C]0.330003[/C][C]3.0245[/C][C]0.001652[/C][/ROW]
[ROW][C]18[/C][C]0.353307[/C][C]3.2381[/C][C]0.000862[/C][/ROW]
[ROW][C]19[/C][C]0.339616[/C][C]3.1126[/C][C]0.001267[/C][/ROW]
[ROW][C]20[/C][C]0.269174[/C][C]2.467[/C][C]0.007828[/C][/ROW]
[ROW][C]21[/C][C]0.180835[/C][C]1.6574[/C][C]0.050587[/C][/ROW]
[ROW][C]22[/C][C]0.096733[/C][C]0.8866[/C][C]0.188921[/C][/ROW]
[ROW][C]23[/C][C]0.013[/C][C]0.1191[/C][C]0.452722[/C][/ROW]
[ROW][C]24[/C][C]-0.040464[/C][C]-0.3709[/C][C]0.355839[/C][/ROW]
[ROW][C]25[/C][C]-0.069857[/C][C]-0.6402[/C][C]0.261878[/C][/ROW]
[ROW][C]26[/C][C]-0.082729[/C][C]-0.7582[/C][C]0.225219[/C][/ROW]
[ROW][C]27[/C][C]-0.080353[/C][C]-0.7364[/C][C]0.231755[/C][/ROW]
[ROW][C]28[/C][C]-0.083035[/C][C]-0.761[/C][C]0.224386[/C][/ROW]
[ROW][C]29[/C][C]-0.087664[/C][C]-0.8035[/C][C]0.211989[/C][/ROW]
[ROW][C]30[/C][C]-0.072653[/C][C]-0.6659[/C][C]0.253657[/C][/ROW]
[ROW][C]31[/C][C]-0.054574[/C][C]-0.5002[/C][C]0.309128[/C][/ROW]
[ROW][C]32[/C][C]-0.025035[/C][C]-0.2294[/C][C]0.40954[/C][/ROW]
[ROW][C]33[/C][C]0.024431[/C][C]0.2239[/C][C]0.411684[/C][/ROW]
[ROW][C]34[/C][C]0.067965[/C][C]0.6229[/C][C]0.267515[/C][/ROW]
[ROW][C]35[/C][C]0.102881[/C][C]0.9429[/C][C]0.174214[/C][/ROW]
[ROW][C]36[/C][C]0.113041[/C][C]1.036[/C][C]0.15158[/C][/ROW]
[ROW][C]37[/C][C]0.114712[/C][C]1.0514[/C][C]0.148055[/C][/ROW]
[ROW][C]38[/C][C]0.100177[/C][C]0.9181[/C][C]0.180588[/C][/ROW]
[ROW][C]39[/C][C]0.063593[/C][C]0.5828[/C][C]0.280782[/C][/ROW]
[ROW][C]40[/C][C]0.006603[/C][C]0.0605[/C][C]0.475942[/C][/ROW]
[ROW][C]41[/C][C]-0.037715[/C][C]-0.3457[/C][C]0.365229[/C][/ROW]
[ROW][C]42[/C][C]-0.079395[/C][C]-0.7277[/C][C]0.234421[/C][/ROW]
[ROW][C]43[/C][C]-0.098529[/C][C]-0.903[/C][C]0.184545[/C][/ROW]
[ROW][C]44[/C][C]-0.118384[/C][C]-1.085[/C][C]0.140511[/C][/ROW]
[ROW][C]45[/C][C]-0.127943[/C][C]-1.1726[/C][C]0.122133[/C][/ROW]
[ROW][C]46[/C][C]-0.155046[/C][C]-1.421[/C][C]0.079506[/C][/ROW]
[ROW][C]47[/C][C]-0.174016[/C][C]-1.5949[/C][C]0.057248[/C][/ROW]
[ROW][C]48[/C][C]-0.179353[/C][C]-1.6438[/C][C]0.051978[/C][/ROW]
[/TABLE]
Source: https://freestatistics.org/blog/index.php?pk=283062&T=1

Globally Unique Identifier (entire table): ba.freestatistics.org/blog/index.php?pk=283062&T=1

As an alternative you can also use a QR Code:  

The GUIDs for individual cells are displayed in the table below:

Autocorrelation Function
Time lag kACF(k)T-STATP-value
10.8869638.12920
20.724656.64150
30.5477345.02011e-06
40.352493.23060.000882
50.1707481.56490.060679
60.0149270.13680.445754
7-0.136647-1.25240.106952
8-0.216413-1.98350.025291
9-0.241932-2.21730.01465
10-0.224588-2.05840.021326
11-0.185233-1.69770.046634
12-0.128695-1.17950.120763
13-0.045456-0.41660.339011
140.0599640.54960.292032
150.1790531.64110.052263
160.2790552.55760.006168
170.3300033.02450.001652
180.3533073.23810.000862
190.3396163.11260.001267
200.2691742.4670.007828
210.1808351.65740.050587
220.0967330.88660.188921
230.0130.11910.452722
24-0.040464-0.37090.355839
25-0.069857-0.64020.261878
26-0.082729-0.75820.225219
27-0.080353-0.73640.231755
28-0.083035-0.7610.224386
29-0.087664-0.80350.211989
30-0.072653-0.66590.253657
31-0.054574-0.50020.309128
32-0.025035-0.22940.40954
330.0244310.22390.411684
340.0679650.62290.267515
350.1028810.94290.174214
360.1130411.0360.15158
370.1147121.05140.148055
380.1001770.91810.180588
390.0635930.58280.280782
400.0066030.06050.475942
41-0.037715-0.34570.365229
42-0.079395-0.72770.234421
43-0.098529-0.9030.184545
44-0.118384-1.0850.140511
45-0.127943-1.17260.122133
46-0.155046-1.4210.079506
47-0.174016-1.59490.057248
48-0.179353-1.64380.051978


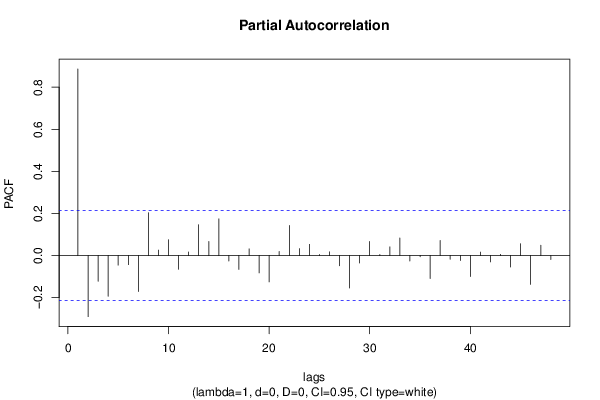
Partial Autocorrelation Function
Time lag kPACF(k)T-STATP-value
10.8869638.12920
2-0.290929-2.66640.004597
3-0.122672-1.12430.132042
4-0.193852-1.77670.039621
5-0.045909-0.42080.337502
6-0.043739-0.40090.344764
7-0.171376-1.57070.060007
80.2033231.86350.032944
90.0254190.2330.408174
100.0747240.68490.247659
11-0.06566-0.60180.274469
120.0165940.15210.43974
130.1461251.33930.09205
140.0664410.60890.272104
150.1739531.59430.057312
16-0.026295-0.2410.405072
17-0.066248-0.60720.272686
180.0315060.28880.386739
19-0.082668-0.75770.225387
20-0.125507-1.15030.126645
210.0186520.1710.432336
220.1422871.30410.097884
230.032520.29810.3832
240.0529380.48520.314405
250.0048420.04440.482354
260.0173120.15870.437155
27-0.049131-0.45030.326829
28-0.154505-1.41610.080227
29-0.035799-0.32810.371824
300.0662120.60680.272795
310.0048410.04440.482357
320.0410870.37660.353721
330.0831080.76170.224187
34-0.026675-0.24450.403726
35-0.005841-0.05350.478716
36-0.109808-1.00640.158555
370.0709850.65060.258543
38-0.018011-0.16510.43464
39-0.023767-0.21780.414044
40-0.09996-0.91610.181106
410.0158870.14560.442292
42-0.030663-0.2810.38969
430.005440.04990.480178
44-0.05509-0.50490.307474
450.0554780.50850.306229
46-0.137403-1.25930.105702
470.0486310.44570.328477
48-0.019569-0.17930.429048

\begin{tabular}{lllllllll}
\hline
Partial Autocorrelation Function \tabularnewline
Time lag k & PACF(k) & T-STAT & P-value \tabularnewline
1 & 0.886963 & 8.1292 & 0 \tabularnewline
2 & -0.290929 & -2.6664 & 0.004597 \tabularnewline
3 & -0.122672 & -1.1243 & 0.132042 \tabularnewline
4 & -0.193852 & -1.7767 & 0.039621 \tabularnewline
5 & -0.045909 & -0.4208 & 0.337502 \tabularnewline
6 & -0.043739 & -0.4009 & 0.344764 \tabularnewline
7 & -0.171376 & -1.5707 & 0.060007 \tabularnewline
8 & 0.203323 & 1.8635 & 0.032944 \tabularnewline
9 & 0.025419 & 0.233 & 0.408174 \tabularnewline
10 & 0.074724 & 0.6849 & 0.247659 \tabularnewline
11 & -0.06566 & -0.6018 & 0.274469 \tabularnewline
12 & 0.016594 & 0.1521 & 0.43974 \tabularnewline
13 & 0.146125 & 1.3393 & 0.09205 \tabularnewline
14 & 0.066441 & 0.6089 & 0.272104 \tabularnewline
15 & 0.173953 & 1.5943 & 0.057312 \tabularnewline
16 & -0.026295 & -0.241 & 0.405072 \tabularnewline
17 & -0.066248 & -0.6072 & 0.272686 \tabularnewline
18 & 0.031506 & 0.2888 & 0.386739 \tabularnewline
19 & -0.082668 & -0.7577 & 0.225387 \tabularnewline
20 & -0.125507 & -1.1503 & 0.126645 \tabularnewline
21 & 0.018652 & 0.171 & 0.432336 \tabularnewline
22 & 0.142287 & 1.3041 & 0.097884 \tabularnewline
23 & 0.03252 & 0.2981 & 0.3832 \tabularnewline
24 & 0.052938 & 0.4852 & 0.314405 \tabularnewline
25 & 0.004842 & 0.0444 & 0.482354 \tabularnewline
26 & 0.017312 & 0.1587 & 0.437155 \tabularnewline
27 & -0.049131 & -0.4503 & 0.326829 \tabularnewline
28 & -0.154505 & -1.4161 & 0.080227 \tabularnewline
29 & -0.035799 & -0.3281 & 0.371824 \tabularnewline
30 & 0.066212 & 0.6068 & 0.272795 \tabularnewline
31 & 0.004841 & 0.0444 & 0.482357 \tabularnewline
32 & 0.041087 & 0.3766 & 0.353721 \tabularnewline
33 & 0.083108 & 0.7617 & 0.224187 \tabularnewline
34 & -0.026675 & -0.2445 & 0.403726 \tabularnewline
35 & -0.005841 & -0.0535 & 0.478716 \tabularnewline
36 & -0.109808 & -1.0064 & 0.158555 \tabularnewline
37 & 0.070985 & 0.6506 & 0.258543 \tabularnewline
38 & -0.018011 & -0.1651 & 0.43464 \tabularnewline
39 & -0.023767 & -0.2178 & 0.414044 \tabularnewline
40 & -0.09996 & -0.9161 & 0.181106 \tabularnewline
41 & 0.015887 & 0.1456 & 0.442292 \tabularnewline
42 & -0.030663 & -0.281 & 0.38969 \tabularnewline
43 & 0.00544 & 0.0499 & 0.480178 \tabularnewline
44 & -0.05509 & -0.5049 & 0.307474 \tabularnewline
45 & 0.055478 & 0.5085 & 0.306229 \tabularnewline
46 & -0.137403 & -1.2593 & 0.105702 \tabularnewline
47 & 0.048631 & 0.4457 & 0.328477 \tabularnewline
48 & -0.019569 & -0.1793 & 0.429048 \tabularnewline
\hline
\end{tabular}
%Source: https://freestatistics.org/blog/index.php?pk=283062&T=2

[TABLE]
[ROW][C]Partial Autocorrelation Function[/C][/ROW]
[ROW][C]Time lag k[/C][C]PACF(k)[/C][C]T-STAT[/C][C]P-value[/C][/ROW]
[ROW][C]1[/C][C]0.886963[/C][C]8.1292[/C][C]0[/C][/ROW]
[ROW][C]2[/C][C]-0.290929[/C][C]-2.6664[/C][C]0.004597[/C][/ROW]
[ROW][C]3[/C][C]-0.122672[/C][C]-1.1243[/C][C]0.132042[/C][/ROW]
[ROW][C]4[/C][C]-0.193852[/C][C]-1.7767[/C][C]0.039621[/C][/ROW]
[ROW][C]5[/C][C]-0.045909[/C][C]-0.4208[/C][C]0.337502[/C][/ROW]
[ROW][C]6[/C][C]-0.043739[/C][C]-0.4009[/C][C]0.344764[/C][/ROW]
[ROW][C]7[/C][C]-0.171376[/C][C]-1.5707[/C][C]0.060007[/C][/ROW]
[ROW][C]8[/C][C]0.203323[/C][C]1.8635[/C][C]0.032944[/C][/ROW]
[ROW][C]9[/C][C]0.025419[/C][C]0.233[/C][C]0.408174[/C][/ROW]
[ROW][C]10[/C][C]0.074724[/C][C]0.6849[/C][C]0.247659[/C][/ROW]
[ROW][C]11[/C][C]-0.06566[/C][C]-0.6018[/C][C]0.274469[/C][/ROW]
[ROW][C]12[/C][C]0.016594[/C][C]0.1521[/C][C]0.43974[/C][/ROW]
[ROW][C]13[/C][C]0.146125[/C][C]1.3393[/C][C]0.09205[/C][/ROW]
[ROW][C]14[/C][C]0.066441[/C][C]0.6089[/C][C]0.272104[/C][/ROW]
[ROW][C]15[/C][C]0.173953[/C][C]1.5943[/C][C]0.057312[/C][/ROW]
[ROW][C]16[/C][C]-0.026295[/C][C]-0.241[/C][C]0.405072[/C][/ROW]
[ROW][C]17[/C][C]-0.066248[/C][C]-0.6072[/C][C]0.272686[/C][/ROW]
[ROW][C]18[/C][C]0.031506[/C][C]0.2888[/C][C]0.386739[/C][/ROW]
[ROW][C]19[/C][C]-0.082668[/C][C]-0.7577[/C][C]0.225387[/C][/ROW]
[ROW][C]20[/C][C]-0.125507[/C][C]-1.1503[/C][C]0.126645[/C][/ROW]
[ROW][C]21[/C][C]0.018652[/C][C]0.171[/C][C]0.432336[/C][/ROW]
[ROW][C]22[/C][C]0.142287[/C][C]1.3041[/C][C]0.097884[/C][/ROW]
[ROW][C]23[/C][C]0.03252[/C][C]0.2981[/C][C]0.3832[/C][/ROW]
[ROW][C]24[/C][C]0.052938[/C][C]0.4852[/C][C]0.314405[/C][/ROW]
[ROW][C]25[/C][C]0.004842[/C][C]0.0444[/C][C]0.482354[/C][/ROW]
[ROW][C]26[/C][C]0.017312[/C][C]0.1587[/C][C]0.437155[/C][/ROW]
[ROW][C]27[/C][C]-0.049131[/C][C]-0.4503[/C][C]0.326829[/C][/ROW]
[ROW][C]28[/C][C]-0.154505[/C][C]-1.4161[/C][C]0.080227[/C][/ROW]
[ROW][C]29[/C][C]-0.035799[/C][C]-0.3281[/C][C]0.371824[/C][/ROW]
[ROW][C]30[/C][C]0.066212[/C][C]0.6068[/C][C]0.272795[/C][/ROW]
[ROW][C]31[/C][C]0.004841[/C][C]0.0444[/C][C]0.482357[/C][/ROW]
[ROW][C]32[/C][C]0.041087[/C][C]0.3766[/C][C]0.353721[/C][/ROW]
[ROW][C]33[/C][C]0.083108[/C][C]0.7617[/C][C]0.224187[/C][/ROW]
[ROW][C]34[/C][C]-0.026675[/C][C]-0.2445[/C][C]0.403726[/C][/ROW]
[ROW][C]35[/C][C]-0.005841[/C][C]-0.0535[/C][C]0.478716[/C][/ROW]
[ROW][C]36[/C][C]-0.109808[/C][C]-1.0064[/C][C]0.158555[/C][/ROW]
[ROW][C]37[/C][C]0.070985[/C][C]0.6506[/C][C]0.258543[/C][/ROW]
[ROW][C]38[/C][C]-0.018011[/C][C]-0.1651[/C][C]0.43464[/C][/ROW]
[ROW][C]39[/C][C]-0.023767[/C][C]-0.2178[/C][C]0.414044[/C][/ROW]
[ROW][C]40[/C][C]-0.09996[/C][C]-0.9161[/C][C]0.181106[/C][/ROW]
[ROW][C]41[/C][C]0.015887[/C][C]0.1456[/C][C]0.442292[/C][/ROW]
[ROW][C]42[/C][C]-0.030663[/C][C]-0.281[/C][C]0.38969[/C][/ROW]
[ROW][C]43[/C][C]0.00544[/C][C]0.0499[/C][C]0.480178[/C][/ROW]
[ROW][C]44[/C][C]-0.05509[/C][C]-0.5049[/C][C]0.307474[/C][/ROW]
[ROW][C]45[/C][C]0.055478[/C][C]0.5085[/C][C]0.306229[/C][/ROW]
[ROW][C]46[/C][C]-0.137403[/C][C]-1.2593[/C][C]0.105702[/C][/ROW]
[ROW][C]47[/C][C]0.048631[/C][C]0.4457[/C][C]0.328477[/C][/ROW]
[ROW][C]48[/C][C]-0.019569[/C][C]-0.1793[/C][C]0.429048[/C][/ROW]
[/TABLE]
Source: https://freestatistics.org/blog/index.php?pk=283062&T=2

Globally Unique Identifier (entire table): ba.freestatistics.org/blog/index.php?pk=283062&T=2

As an alternative you can also use a QR Code:  

The GUIDs for individual cells are displayed in the table below:

Partial Autocorrelation Function
Time lag kPACF(k)T-STATP-value
10.8869638.12920
2-0.290929-2.66640.004597
3-0.122672-1.12430.132042
4-0.193852-1.77670.039621
5-0.045909-0.42080.337502
6-0.043739-0.40090.344764
7-0.171376-1.57070.060007
80.2033231.86350.032944
90.0254190.2330.408174
100.0747240.68490.247659
11-0.06566-0.60180.274469
120.0165940.15210.43974
130.1461251.33930.09205
140.0664410.60890.272104
150.1739531.59430.057312
16-0.026295-0.2410.405072
17-0.066248-0.60720.272686
180.0315060.28880.386739
19-0.082668-0.75770.225387
20-0.125507-1.15030.126645
210.0186520.1710.432336
220.1422871.30410.097884
230.032520.29810.3832
240.0529380.48520.314405
250.0048420.04440.482354
260.0173120.15870.437155
27-0.049131-0.45030.326829
28-0.154505-1.41610.080227
29-0.035799-0.32810.371824
300.0662120.60680.272795
310.0048410.04440.482357
320.0410870.37660.353721
330.0831080.76170.224187
34-0.026675-0.24450.403726
35-0.005841-0.05350.478716
36-0.109808-1.00640.158555
370.0709850.65060.258543
38-0.018011-0.16510.43464
39-0.023767-0.21780.414044
40-0.09996-0.91610.181106
410.0158870.14560.442292
42-0.030663-0.2810.38969
430.005440.04990.480178
44-0.05509-0.50490.307474
450.0554780.50850.306229
46-0.137403-1.25930.105702
470.0486310.44570.328477
48-0.019569-0.17930.429048


Parameters (Session):
par1 = 48 ; par2 = 1 ; par3 = 0 ; par4 = 0 ; par5 = 12 ; par6 = White Noise ; par7 = 0.95 ;
Parameters (R input):
par1 = 48 ; par2 = 1 ; par3 = 0 ; par4 = 0 ; par5 = 12 ; par6 = White Noise ; par7 = 0.95 ; par8 = ;
R code (references can be found in the software module):
if (par1 == 'Default') {
par1 = 10*log10(length(x))
} else {
par1 <- as.numeric(par1)
}
par2 <- as.numeric(par2)
par3 <- as.numeric(par3)
par4 <- as.numeric(par4)
par5 <- as.numeric(par5)
if (par6 == 'White Noise') par6 <- 'white' else par6 <- 'ma'
par7 <- as.numeric(par7)
if (par8 != '') par8 <- as.numeric(par8)
ox <- x
if (par8 == '') {
if (par2 == 0) {
x <- log(x)
} else {
x <- (x ^ par2 - 1) / par2
}
} else {
x <- log(x,base=par8)
}
if (par3 > 0) x <- diff(x,lag=1,difference=par3)
if (par4 > 0) x <- diff(x,lag=par5,difference=par4)
bitmap(file='picts.png')
op <- par(mfrow=c(2,1))
plot(ox,type='l',main='Original Time Series',xlab='time',ylab='value')
if (par8=='') {
mytitle <- paste('Working Time Series (lambda=',par2,', d=',par3,', D=',par4,')',sep='')
mysub <- paste('(lambda=',par2,', d=',par3,', D=',par4,', CI=', par7, ', CI type=',par6,')',sep='')
} else {
mytitle <- paste('Working Time Series (base=',par8,', d=',par3,', D=',par4,')',sep='')
mysub <- paste('(base=',par8,', d=',par3,', D=',par4,', CI=', par7, ', CI type=',par6,')',sep='')
}
plot(x,type='l', main=mytitle,xlab='time',ylab='value')
par(op)
dev.off()
bitmap(file='pic1.png')
racf <- acf(x, par1, main='Autocorrelation', xlab='time lag', ylab='ACF', ci.type=par6, ci=par7, sub=mysub)
dev.off()
bitmap(file='pic2.png')
rpacf <- pacf(x,par1,main='Partial Autocorrelation',xlab='lags',ylab='PACF',sub=mysub)
dev.off()
(myacf <- c(racf$acf))
(mypacf <- c(rpacf$acf))
lengthx <- length(x)
sqrtn <- sqrt(lengthx)
load(file='createtable')
a<-table.start()
a<-table.row.start(a)
a<-table.element(a,'Autocorrelation Function',4,TRUE)
a<-table.row.end(a)
a<-table.row.start(a)
a<-table.element(a,'Time lag k',header=TRUE)
a<-table.element(a,hyperlink('basics.htm','ACF(k)','click here for more information about the Autocorrelation Function'),header=TRUE)
a<-table.element(a,'T-STAT',header=TRUE)
a<-table.element(a,'P-value',header=TRUE)
a<-table.row.end(a)
for (i in 2:(par1+1)) {
a<-table.row.start(a)
a<-table.element(a,i-1,header=TRUE)
a<-table.element(a,round(myacf[i],6))
mytstat <- myacf[i]*sqrtn
a<-table.element(a,round(mytstat,4))
a<-table.element(a,round(1-pt(abs(mytstat),lengthx),6))
a<-table.row.end(a)
}
a<-table.end(a)
table.save(a,file='mytable.tab')
a<-table.start()
a<-table.row.start(a)
a<-table.element(a,'Partial Autocorrelation Function',4,TRUE)
a<-table.row.end(a)
a<-table.row.start(a)
a<-table.element(a,'Time lag k',header=TRUE)
a<-table.element(a,hyperlink('basics.htm','PACF(k)','click here for more information about the Partial Autocorrelation Function'),header=TRUE)
a<-table.element(a,'T-STAT',header=TRUE)
a<-table.element(a,'P-value',header=TRUE)
a<-table.row.end(a)
for (i in 1:par1) {
a<-table.row.start(a)
a<-table.element(a,i,header=TRUE)
a<-table.element(a,round(mypacf[i],6))
mytstat <- mypacf[i]*sqrtn
a<-table.element(a,round(mytstat,4))
a<-table.element(a,round(1-pt(abs(mytstat),lengthx),6))
a<-table.row.end(a)
}
a<-table.end(a)
table.save(a,file='mytable1.tab')